14. Infrastructural damage assessment (Illustrative)#
14.1. Summary#
In previous sections we showed you how to create a surface change raster layer using satellite imagery (Mapping and Monitoring Surface Change) and how to access open-source infrastructure data (Mapping Exposure - Infrastructure). In this class, we will go one step further and show you how to combine these two datasets to create an infrastructural damage assessment.
The class shows through an example the methodology followed by the Data Lab for assessing damage to different types of infrastructure.
14.2. Learning Objectives#
14.2.1. Overall goals#
The main goal of this class is to show students a methodology for assessing damage to different types of infrastructure.
14.2.2. Specific goals#
At the end of this notebook, you should have gained an understanding and appreciation of the following:
Know a methodology for assessing damage to infrastructure:
Understand the rules for classifying damage depending on the infrastructure class.
Visualizations that can be done with this type of data.
Understand the limitations of the methodology.
14.3. Methodology#
For the assessment of infrastructural damage in roads, points of interest, or buildings, the different layers are overlaid with the surface change layer and computed whether each feature has been damaged or not. For the different features, their potential damage was computed as follows:
In case of roads, the layer is split into 10-meter road segments, and it is computed whether each of the segments had been damaged or not.
In case of the points-of-interest (POIs):
POIs have been attributed a buffer of 10-meter radius and are overlaid to the change map to detect whether they are likely damaged or not.
Area POIs have been overlaid with the change map to detect whether they are likely damaged or not.
In case of buildings,
Using OpenStreetMap building layer, each building polygon is overlaid with the change map to calculate the percentage of their area that is likely damaged. OSM layers also come with their possible land-use information.
Using Microsoft footprint layer, each building polygon is overlaid with the change map to calculate the percentage of their area that is likely damaged. Unlike OSM, however, they do not come with land-use information.
14.4. Visualizing Damage Buildings and Infrastructure in Gaza#
This notebook provides a visual analysis of Synthetic Aperture Radar (SAR) data to assess and visualize potential damage in the Gaza Strip. SAR data, known for its ability to capture ground features and changes regardless of weather conditions or time of day, can be instrumental in identifying changes in infrastructure or land features following conflict or disasters.
You can now interact with this map by selecting/deselecting different damage layers to visualize where buildings are most impacted in the Gaza Strip. Upon visual inspection, you can see:
Damage: You can select and deselect the layers to see damage to roads, buildings and points of interest. The damage value ranges from \([0,1]\), with \(1\) indicating higher level of damage.
Fig. 14.1 Damage assessment in the Gaza Strip utilizing SAR imagery to evaluate the extent of destruction. The damage map above is based on preliminary estimates and has not been verified through field surveys or satellite imagery. It does not reflect the final estimations by the World Bank. Country borders or names do not necessarily reflect the World Bank Group’s official position. This map is for illustrative purposes and does not imply the expression of any opinion on the part of the World Bank, concerning the legal status of any country or territory or concerning the delimitation of frontiers or boundaries.#
Note
The results shown in this analysis only reflect the damages until April 10, 2024. As the team completes further analysis, the notebook will be updated.
14.4.1. Comparative maps#
The following is a comparative visualization that contrasts the overall estimated damage between two significant time points: October 29 and March 17. These dates mark the onset of the conflict and the most recent available update, enabling us to assess the evolving impact of the conflict over time.
Estimated Damage until Oct 29, 2023 |
Estimated Damage until March 17, 2024 |
|---|---|
|
|
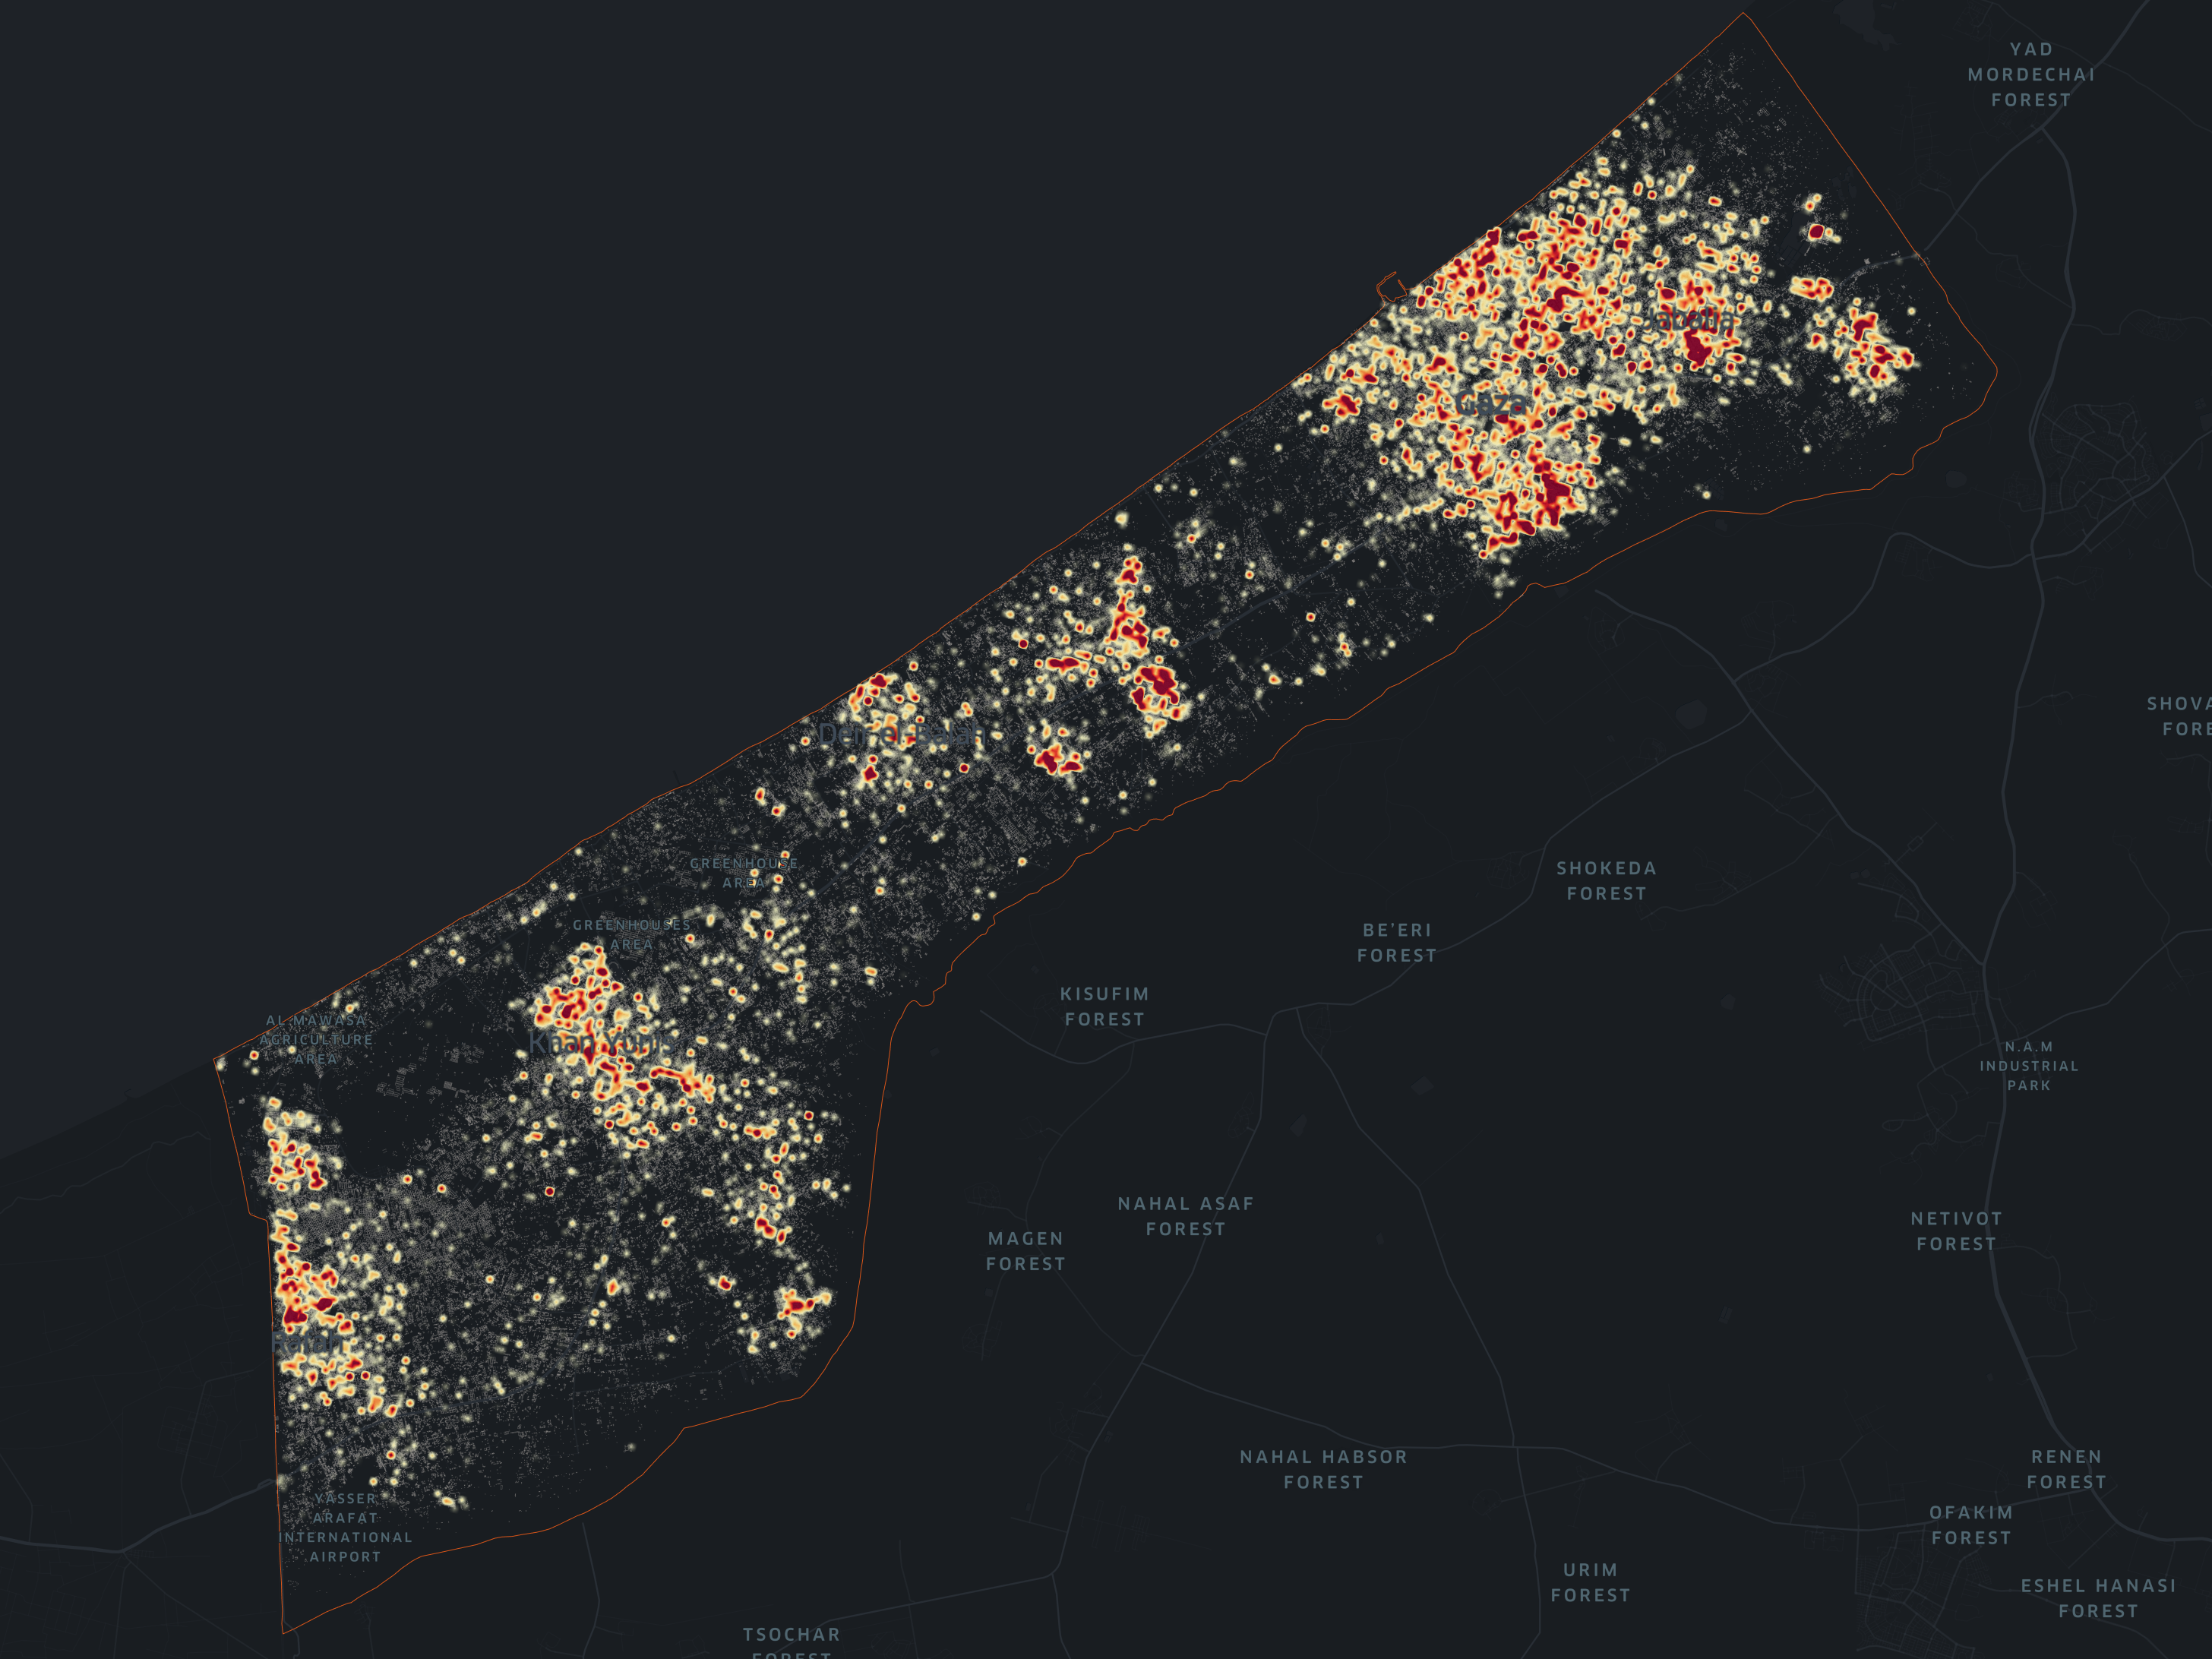
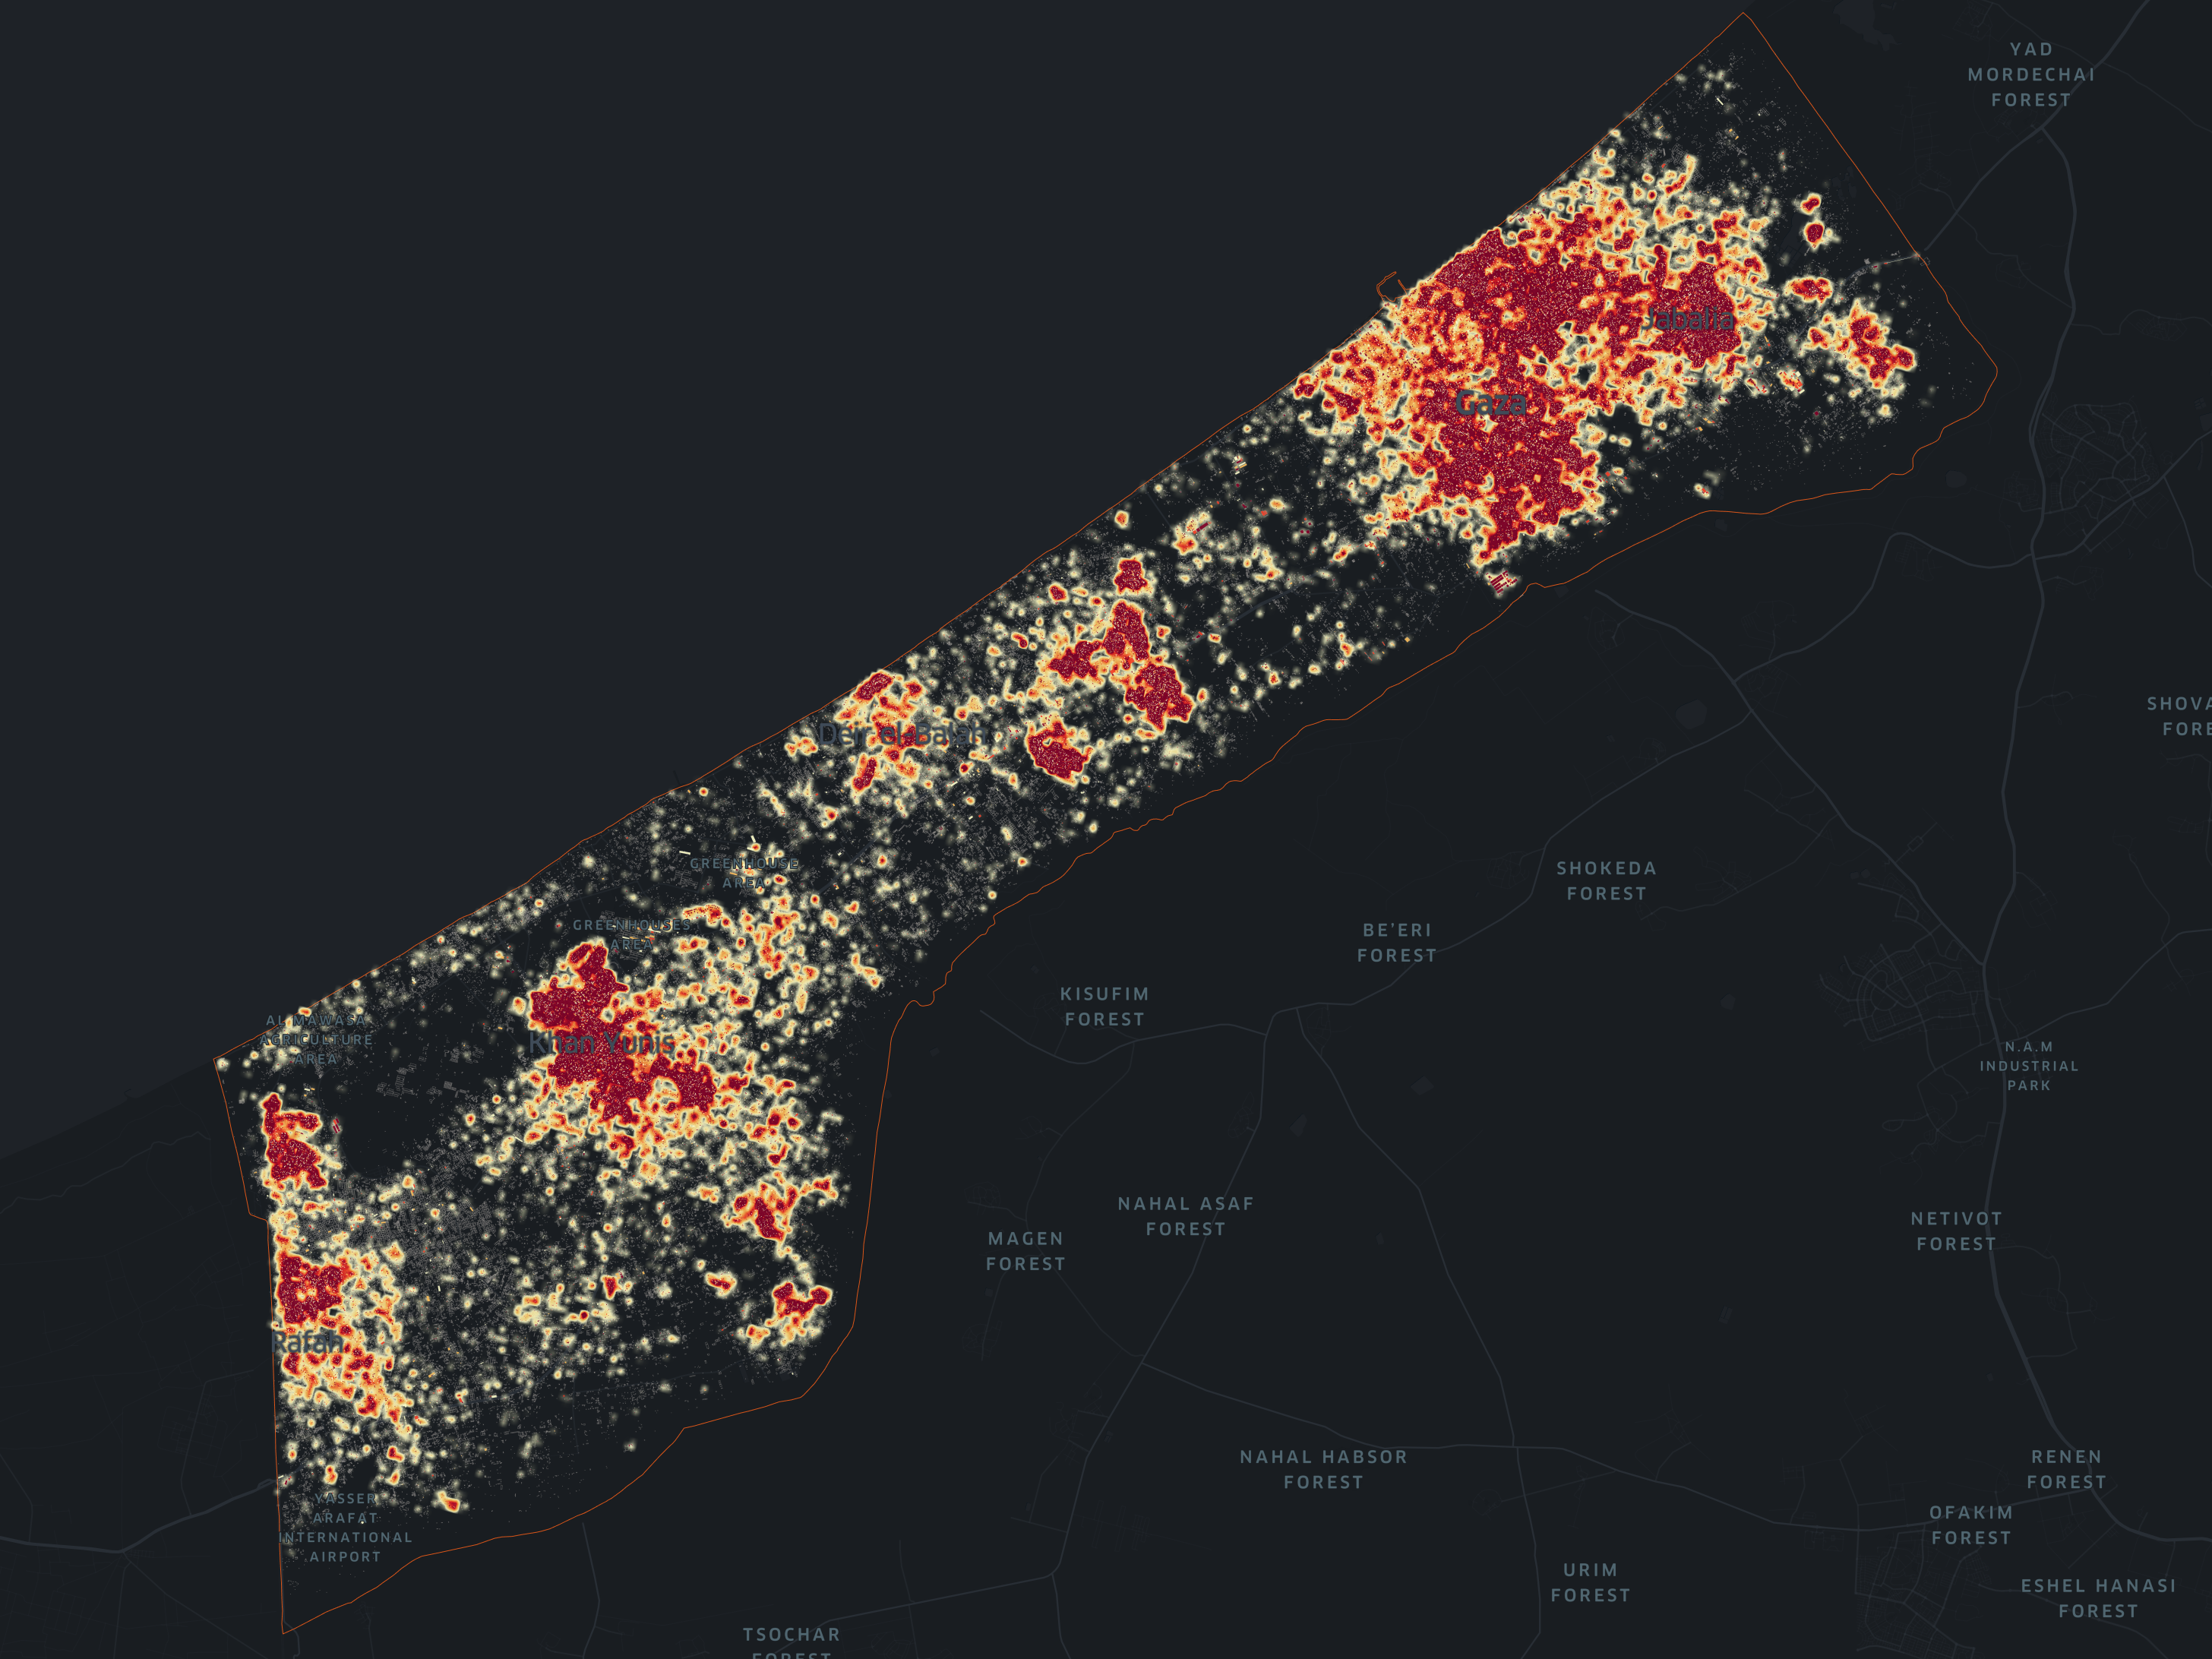
Heatmap depicting estimated damage inflicted to buildings in the Gaza Strip utilizing SAR imagery to evaluate the extent and geographical distribution of estimated destruction. Brighter regions indicate higher levels of damage, denoting the intensity of estimated damage on scale from 0 to 1, from white to red, where 1 signifies total damage.
Important
The below damage assessment maps are based on preliminary estimates and have not been verified through field survey or satellite imagery. They do not reflect the final estimations by the World Bank. The project team is currently working on procuring high resolution imagery to verify whether the buildings identified as damaged have collapsed or experienced impact.
Caution
Using OpenStreetMap (OSM) and Interferometric Synthetic Aperture Radar (InSAR) for estimating building damage has its strengths but also several limitations:
Incomplete Data:
Coverage Discrepancies: OSM data might lack comprehensive coverage, especially in certain regions or areas with limited community input or verification. This can lead to incomplete or outdated information about buildings. For instance, Bittner [Bit17] outlined the Israeli domination of OSM entries, whereas there are far fewer mappers in Palestine.
Quality Variability: Data quality can vary significantly as it relies on volunteer contributions. Accuracy in mapping may vary, leading to inconsistencies or errors in identifying buildings.
Temporal Limitations:
Data Timeliness: OSM data might not be up to date due to infrequent updates or changes in the landscape that haven’t been reflected yet.
InSAR Timing: InSAR data might not capture the most recent changes or damages, especially in rapidly evolving situations where damage continues to occur after the data collection period.
Contextual Understanding:
Local Knowledge: OSM data might lack contextual information crucial for assessing damages accurately, such as the original state of buildings or variations in construction materials.
Verification Challenges: Verifying damages solely based on remote sensing data might lack the on-ground verification necessary for a comprehensive understanding of the situation.