6. Mapping and Monitoring Earthquake Intensity#
6.1. Summary#
After an earthquake, it is critical to identify the areas that were most affected. Knowing the distribution of the damage, for example, allows crisis response teams to allocate resources more efficiently. During the first hours after the event, little information is known, and depending on the magnitude of the earthquake, collecting it might not be possible. The United States Geological Survey (USGS) provides free, up-to-date data on global earthquake location and intensity through their USGS website. This dataset will allow us to obtain, almost in real time, the distribution of earthquake intensity from its epicenter across the earth.
This notebook provides a hands-on tutorial on how to access and use open-source data on earthquakes from USGS to generate base maps that indicate areas afected by a specific earthquake.
6.1.1. Learning Objectives#
6.1.1.1. Overall goals#
The primary objective of this class is to teach students how to access USGS open-source data on earthquakes and create base maps of earthquake intensity to detect affected areas.
6.1.1.2. Specific goals#
At the end of this notebook, you should have gained an understanding and appreciation of the following:
Earthquake data from USGS:
Understand the Modified Mercalli Intensity.
Know how to download USGS data.
Create intensity base maps:
Learn how to summarize data from a vector layer to different geography levels.
Visualize earthquake intensity maps.
6.2. About the data provider#
The data used for creating these maps is provided by the Earthquake Hazards Program from the United States Geological Survey (USGS) program.
The USGS monitors and reports on earthquakes, assesses earthquake impacts and hazards, and conducts targeted research on the causes and effects of earthquakes. We undertake these activities as part of the larger National Earthquake Hazards Reduction Program (NEHRP), a four-agency partnership established by Congress.
Source: USGS.
More information about the program can be found here.
6.3. Modified Mercalli Intensity - MMI#
The impact of the earthquake in this analysis is being measured using the Modified Mercalli Intensity Scale (MMI).
The effect of an earthquake on the Earth’s surface is called the intensity. The intensity scale consists of a series of certain key responses such as people awakening, movement of furniture, damage to chimneys, and finally - total destruction. Although numerous intensity scales have been developed over the last several hundred years to evaluate the effects of earthquakes, the one currently used in the United States is the Modified Mercalli (MM) Intensity Scale. It was developed in 1931 by the American seismologists Harry Wood and Frank Neumann. This scale, composed of increasing levels of intensity that range from imperceptible shaking to catastrophic destruction, is designated by Roman numerals. It does not have a mathematical basis; instead it is an arbitrary ranking based on observed effects.
The Modified Mercalli Intensity value assigned to a specific site after an earthquake has a more meaningful measure of severity to the nonscientist than the magnitude because intensity refers to the effects actually experienced at that place.
Source: USGS.
6.4. Obtain the data - Step by Step Guide#
Follow this link to download the data. There, one can find filters to make the appropriate download. This example will use the data for the 02/06/2023 earthquake in Türkiye.
Establish the desired magnitude range. In this case, the search will be carried out for earthquakes above 6.
Establish the Date & Time. This example searches for every earthquake that happened on the 6th of February 2023. Since the data needs to be introduced in UTC and Türkiye is UTC+3, the start will be 2023-02-06 3:00:00 and the end will be 2023-02-07 02:59:59.
Establish the geographic region using the Custom option by drawing a rectangle as shown below.
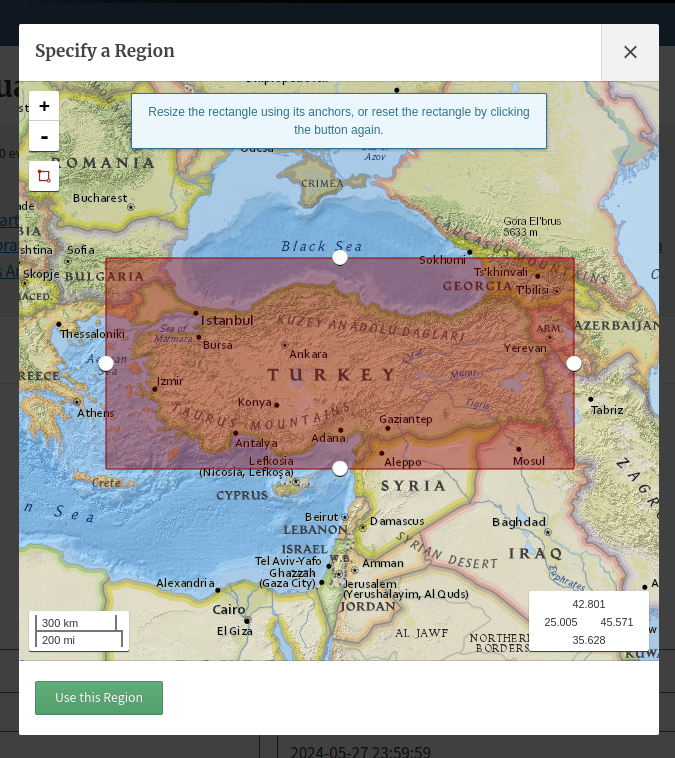
Fig. 6.1 Example of the definition of an area of interest.#
The filters should look as follows.
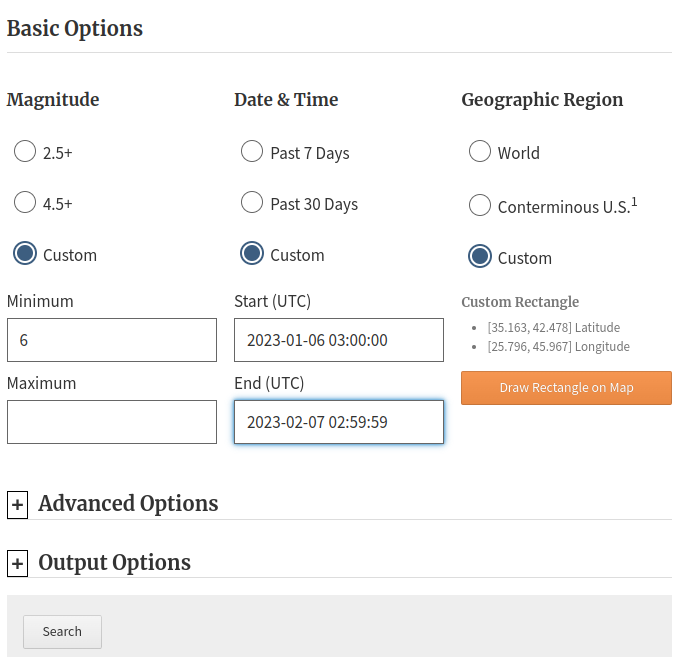
Fig. 6.2 Filters available at the Search Earthquake Catalog.#
In this case, the search found 3 earthquakes that match the description provided above. Download the
Shake Mapfor the 7.5 magnitud earthquake. You will be redirected to a new page where you can download the data in the format needed. In this example, the data is downloaded as in the shapefile format.

Fig. 6.3 Search result example.#
The downloaded zip file has several shapefiles inside it. This example uses the one named
mi.
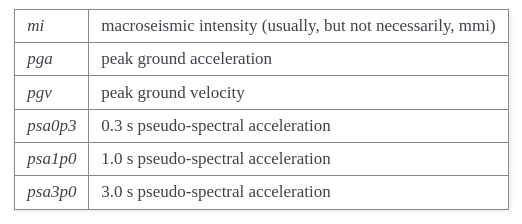
Fig. 6.4 Metadata for downloaded files.#
More information can be found here.
6.5. Work with the data#
6.5.1. Load the data#
import pandas as pd
import geopandas as gpd
import matplotlib.pyplot as plt
%matplotlib inline
import warnings
warnings.simplefilter(action='ignore', category=FutureWarning)
mi = gpd.read_file('../../data/mapping-and-monitoring-earthquake-intensity/shape/mi.shp') # Open the data
mi.head() # Explore the data
| AREA | PERIMETER | PGAPOL_ | PGAPOL_ID | GRID_CODE | PARAMVALUE | geometry | |
|---|---|---|---|---|---|---|---|
| 0 | 0.0 | 0.0 | 16 | 16 | 0 | 3.2 | MULTIPOLYGON (((42.71894 42.55000, 42.72128 42... |
| 1 | 0.0 | 0.0 | 17 | 17 | 0 | 3.4 | MULTIPOLYGON (((42.33777 42.45000, 42.32282 42... |
| 2 | 0.0 | 0.0 | 18 | 18 | 0 | 3.6 | MULTIPOLYGON (((41.90779 42.35000, 41.88884 42... |
| 3 | 0.0 | 0.0 | 19 | 19 | 0 | 3.8 | MULTIPOLYGON (((35.05144 40.88333, 35.05162 40... |
| 4 | 0.0 | 0.0 | 20 | 20 | 0 | 4.0 | MULTIPOLYGON (((35.85531 41.15000, 35.85526 41... |
According to the documentation:
The shape files are contour polygons of the peak ground-motion amplitudes. These contour polygons are actually equal-valued donut-like polygons that sample the contour map at fine enough intervals to accurately represent the surface function.
mi.explore(column = 'PARAMVALUE')
6.5.2. Overlay with Admin level 2#
Download the data for administrative level 2 for Turkey. GADM was used.
adm2 = gpd.read_file('../../data/mapping-and-monitoring-earthquake-intensity/gadm41_TUR_2.json') # Load the data
adm2.explore() # Explore what we have
6.5.2.1. Overlay or Spatial Join?#
The main difference is that gpd.overlay() produces new geometries while the spatial join (gpd.sjoin) only transfers the data from one data frame to the other.
See more here.
Choosing one operation or the other depends on the goal of the task. This example calculates a summary measure for each administrative level.
If the summary measure is a maximum or a minimum, then one might want to use the spatial join.
If the summary measure is the mean, then one might need to use the overlay, which will allow to calculate a weighted by area average.
mi.crs == adm2.crs # Check if both objects are in the same crs
True
amd2_mi = gpd.sjoin(adm2, mi, how = 'left', predicate = 'intersects') # Intersect each adm2 geometry with the earthquake data
len(amd2_mi), len(adm2) # Visualize that the final geodataframe does not have the same length as the original one
# This demonstrates that we need a summary measure
(2799, 929)
amd2_mi['PARAMVALUE'].isnull().values.any() # Check if there are nulls and fill them with 0
amd2_mi['PARAMVALUE'] = amd2_mi['PARAMVALUE'].fillna(0)
amd2_mi.explore(column = 'PARAMVALUE')
# See the duplicated objects in the map (less opacity)
# Sort the sjoin by intensity values so that we can remove repeated polygons
amd2_mi.sort_values(by = 'PARAMVALUE', ascending = False, inplace = True)
amd2_mi.drop_duplicates('GID_2', keep = 'first', inplace = True)
amd2_mi.explore(column = 'PARAMVALUE')
6.6. Practice#
Recreate the map above but instead of providing the maximum intensity level suffered by each administrative boundary, provide an average intensity.
Hint 1: You will need to create a weighted average based on intersected areas and use gpd.overlay.
Hint 2: Let’s create a list together of all the steps.