11.5. Microsoft Building Footprints (MBF)#
This is a worldwide building footprints derived from satellite imagery. Microsoft has detected 1.4B buildings from Bing Maps imagery between 2014 and 2024 including Maxar, Airbus, and IGN France imagery. The data is freely available for download and use under ODbL.
11.5.1. Data coverage#
The below map shows the data coverage across the world.
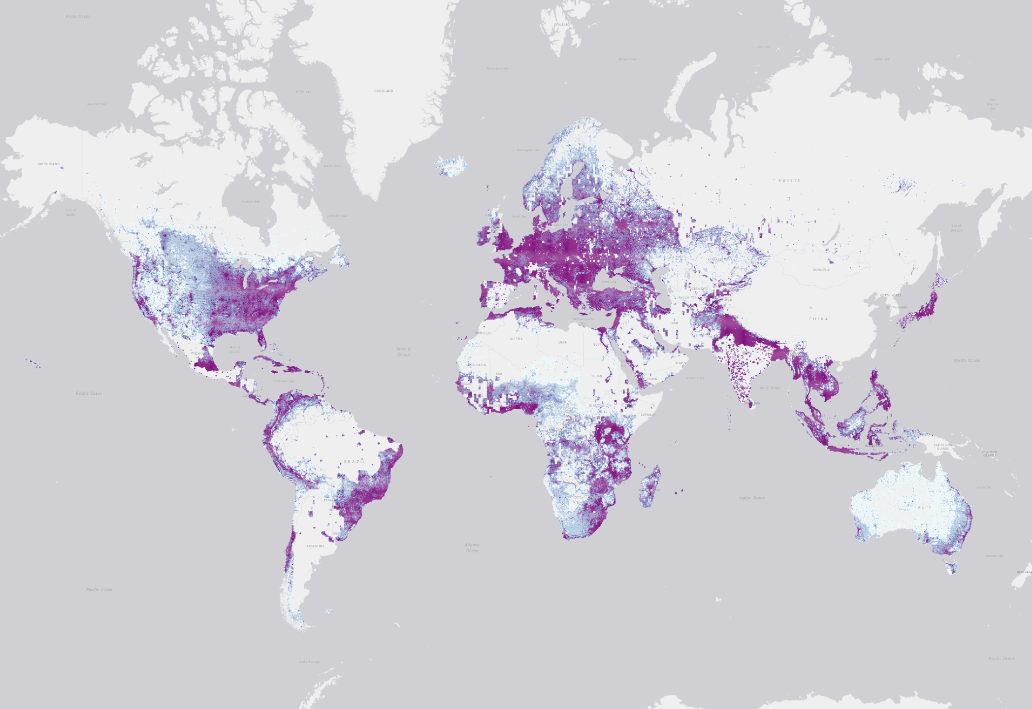
This dataset offers an estimation of the building height as well. However, the height attribute has a lower coverage than the footprint dataset. See below.
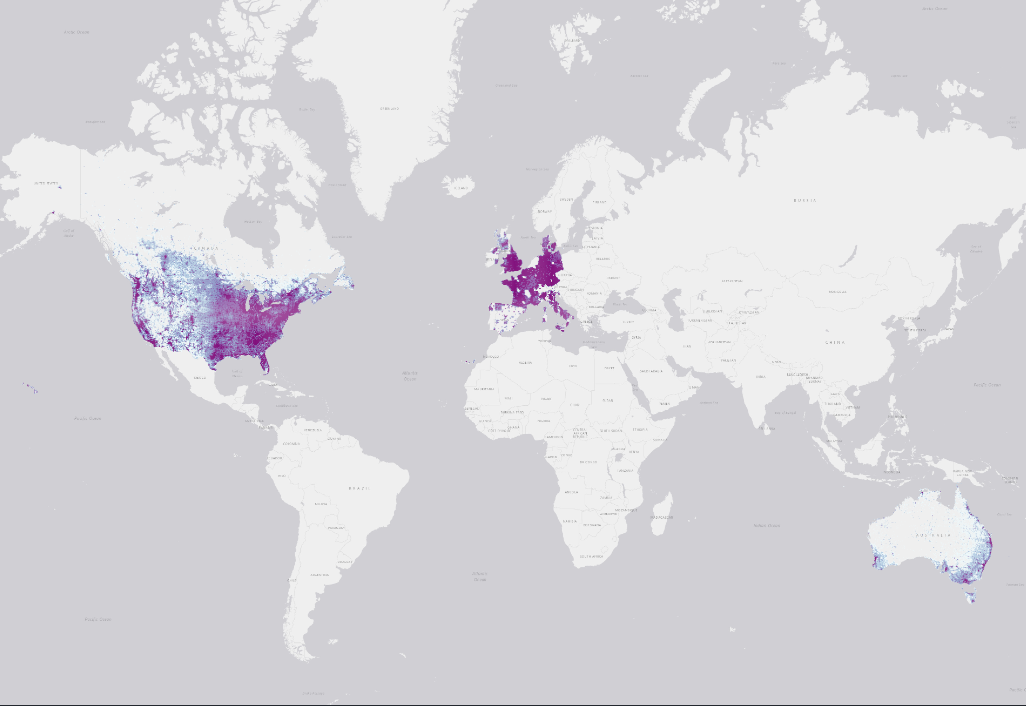
11.5.2. How data was created#
The building extraction is done in two stages:
Semantic Segmentation – Recognizing building pixels on an aerial image using deep neural networks (DNNs).
Polygonization – Converting building pixel detections into polygons.
Stage 1: Semantic Segmentation
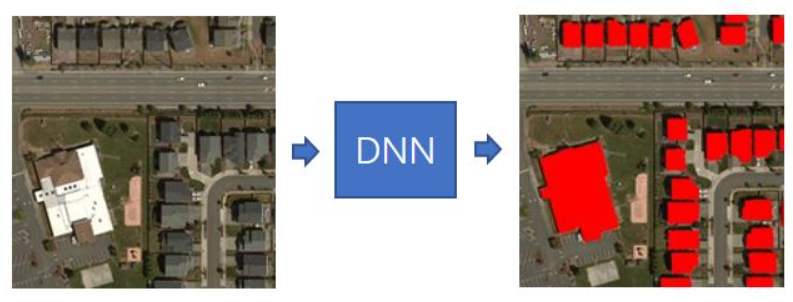
Fig. 11.7 Semantic Segmentation step.#
Stage 2: Polygonization
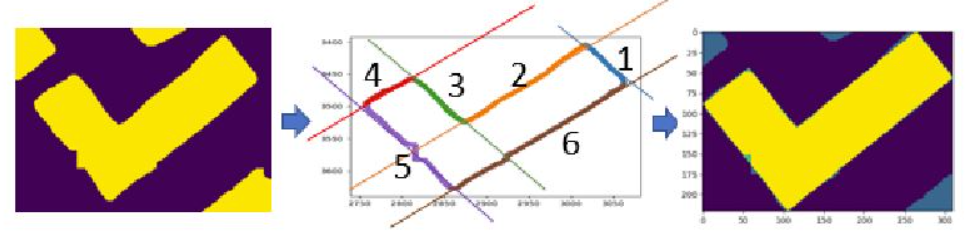
Fig. 11.8 Polygonization step.#
11.5.3. Confidence Score#
Latest releases of this dataset incorporated a confidence score between 0 and 1 that can be read as a percentage confidence.
11.5.4. Evaluation Metrics#
The project provides the Precision/Recall metric for every region.
Region |
Precision |
Recall |
|---|---|---|
Africa |
94.4% |
70.9% |
Caribbean |
92.2% |
76.8% |
Central Asia |
97.17% |
79.47% |
Europe |
94.3% |
85.9% |
Middle East |
95.7% |
85.4% |
South America |
95.4% |
78.0% |
South Asia |
94.8% |
76.7% |
The above information and more details about the project can be found in the Project GitHub repository.
11.5.5. Download the data#
The below code was created following the example on the Project Github repository. The goal is to download the building footprints from the area of interest, the 50 km buffer around the earthquake epicenter.
Step 1 - Determine which tiles intersect the AOI
MBF stores the data in tiles, for each tile there is a downloading link for retrieving the data. So, the first step is to find which tiles intersect with the AOI. This step can be done with the code below or using a What the tile? tool.
import pandas as pd
import mercantile
import geopandas as gpd
from shapely import geometry, Point, Polygon
import mercantile
from tqdm import tqdm
import os
import tempfile
import random
import folium
downloading_links = pd.read_csv('https://minedbuildings.z5.web.core.windows.net/global-buildings/dataset-links.csv', dtype=str)
east, south, west, north = (36.62768265193316, 37.561544985221865, 37.76386851796805, 38.460405921314695)
quad_keys = set()
for tile in list(mercantile.tiles(east, south, west, north, zooms=9)):
    quad_keys.add(mercantile.quadkey(tile))
quad_keys = list(quad_keys)
print(f"The input area spans {len(quad_keys)} tiles: {quad_keys}")
The input area spans 6 tiles: ['122110320', '122110301', '122110321', '122110303', '122110302', '122110300']
Step 2 - Download the data
Using the tiles from above, all footprints are downloaded. After that, the entire dataset is filtered to keep only buildings that lie in the AOI.
# Obtain the Polygon for the Area of Interest
d = {'name': ['epicenter'], 'geometry': [Point(37.196, 38.011)]}
gdf = gpd.GeoDataFrame(d, crs="EPSG:4326")
gdf = gdf.to_crs('EPSG:23036')
gdf['buffer'] = gdf.geometry.apply(lambda x: x.buffer(50000))
gdf = gdf.set_geometry('buffer')
gdf = gdf.to_crs('EPSG:4326')
bounds = gdf.bounds.loc[0]
north, south, east, west = bounds.maxy, bounds.miny, bounds.minx, bounds.maxx
gdf.loc[1, 'name'] = 'epicenter_rectangle'
gdf.loc[1, 'buffer'] = Polygon(((east,north), (west, north), (west, south), (east, south)))
idx = 0
combined_gdf = gpd.GeoDataFrame()
with tempfile.TemporaryDirectory() as tmpdir:
    # Download the GeoJSON files for each tile that intersects the input geometry
    tmp_fns = []
    for quad_key in tqdm(quad_keys):
        print(quad_key)
        rows = downloading_links[downloading_links["QuadKey"] == quad_key]
        if rows.shape[0] == 1:
            url = rows.iloc[0]["Url"]

            df2 = pd.read_json(url, lines=True)
            df2["geometry"] = df2["geometry"].apply(geometry.shape)

            gdf_tile = gpd.GeoDataFrame(df2, crs=4326)
            fn = os.path.join(tmpdir, f"{quad_key}.geojson")
            tmp_fns.append(fn)
            if not os.path.exists(fn):
                gdf_tile.to_file(fn, driver="GeoJSON")
        elif rows.shape[0] > 1:
            raise ValueError(f"Multiple rows found for QuadKey: {quad_key}")
        else:
            raise ValueError(f"QuadKey not found in dataset: {quad_key}")
    # import pdb; pdb.set_trace()
    # Merge the GeoJSON files into a single file
    for fn in tmp_fns:
        gdf_tile = gpd.read_file(fn)  # Read each file into a GeoDataFrame
        gdf_tile = gdf_tile[gdf_tile.geometry.within(gdf.loc[1].buffer)]  # Filter geometries within the AOI
        gdf_tile['id'] = range(idx, idx + len(gdf_tile))  # Update 'id' based on idx
        idx += len(gdf_tile)
        combined_gdf = pd.concat([combined_gdf,gdf_tile],ignore_index=True)
Step 3 - Explore the results
It can be observed that all the records from this area do not have a confidence score, this means they are from a vintage dataset. Also, these datapoints do not have a value for the height.
The map below shows a sample of the results to consume less computation resources.
print('{} building footprints were retrieved'.format(len(combined_gdf)))
194264 building footprints were retrieved
import json # Import json library to read a string into a dictionary
combined_gdf['properties'].loc[0]['confidence']
-1.0
# combined_gdf['properties'] = combined_gdf['properties'].apply(lambda x: json.loads(x)) # older versions of the dataset
combined_gdf['confidence'] = combined_gdf['properties'].apply(lambda x: x['confidence'])
combined_gdf['height'] = combined_gdf['properties'].apply(lambda x: x['height'])
combined_gdf.confidence.value_counts()
-1.0    194264
Name: confidence, dtype: int64
combined_gdf.height.value_counts()
-1.0    194264
Name: height, dtype: int64
idx = list(combined_gdf.index)
idx_shuffled= random.shuffle(idx) # Shuffle indices to avoid spatial oversampling
m = combined_gdf.loc[idx[:1000]].explore(name = 'MBF')
gdf.loc[[1]].explore(m = m, color = 'pink', name = 'AOI')
folium.LayerControl().add_to(m)
m