9. Mapping and Monitoring Surface Change (Illustrative)#
9.1. Summary#
Estimating the infrastructure that has been damaged during a crisis provides a powerful insight into the scale and impact of the event. It allows us to estimate critical factors like number of people who lost their home or essential facilities like hospitals that are out of service. The Interferometric Synthetic Aperture Radar (InSAR) compares synthetic aperture radars (SAR) images across the time to estimate changes in the earth’s surface during the same time period.
In this illustrative class we are showcasing the work done by the World Bank’s Data Lab team to estimate the damage undertaken to buildings and points of interest during the Gaza-Israel conflict. In this first class, we will learn how to create a raster to detect surface changes and, in a subsequent class, we will overlay this raster with infrastructure and points of interest to assess and quantify the damage.
9.1.1. Learning Objectives#
9.1.1.1. Overall goals#
The primary objective of this notebook is to show students how open-source datasets can be employed to create a georeferenced layer indicating areas that experienced a surface change.
9.1.1.2. Specific goals#
At the end of this notebook, you should have gained an understanding and appreciation of the following:
Understand Sentinel-1 data:
Methodology for creating a layer of damaged areas:
Learn the theoretical frame behind the image similarity method.
Understand the methodology limitations.
9.2. Data#
The data used for this analysis is Sentinel-1. This Satellite imagery forms the core of this analysis. These data is obtained once in two weeks to detect changes to building structures.
9.3. Methodology#
The WB Data Lab team developed a multi-step methodology, designed to reduce costs of conducting the analysis while maximizing certainty and frequency of results for damage inventories. Using freely available, bi-weekly satellite radar data, the team has been running a set of automated algorithms to identify significant “changes” to the underlying infrastructure – especially changes in the heights and shapes of features.
Caution
This analysis is still experimental; it can result in false positives and negatives.
The damage assessment analysis relies on the similarity measure computed using SAR medium resolution and openly accessible Sentinel-1, and the employed methodology can be split into 3 steps:
9.3.1. Image similarity computation#
This similarity measurement, namely interferometric coherence ranging from \([0,1]\), provides values of high similarity (usually higher than \(0.6\)) over structures that had not suffered almost any variation, as for example buildings or man-made structures, while exhibits lower values (usually lower than \(0.4\)) over forest and agricultural areas (especially on large time separation between the acquisition time of the satellite data) over water (usually lower than \(0.3\)) bodies already between consecutive acquisitions.
We have employed all the Copernicus Sentinel-1 data acquired over the Gaza strip, which consists in 3 satellite orbits, namely ascending orbit 87 and 160 and descending orbit 94. Then, all the similarity maps were calculated with respect to the first image available for each of the orbits acquired in September 2022. This produces time series measurements that will allow the use of a statistical approach to determine changes using anomaly detection method. Each orbit has 12 days repeat pass, so new updated products can be added regularly every 12 days.
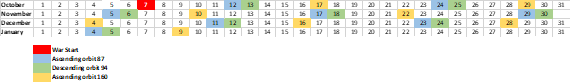
Fig. 9.1 Calendar with Copernicus Sentinel-1 acquisition dates after the war started on past 7th October 2023 until 9th January 2024.#
9.3.2. Change detection based on time series statistics#
For the time series change detection, pre-war data from September 2022 until end September 2023 was computed to obtain statistics in non-war situation. These statistics are also used to classify the newer data acquired during the war period, October 2023, until the present time, with pixels for which had been detected a change (potentially attributable to war damage) using anomaly detection method with different thresholds (i.e. 3-sigma rule and 2.5-sigma rule).
The 3-sigma rule considers as an anomaly those values that are lower than the average minus 3 times the standard deviation. In other words, anomalies are those values that are lower than 99.6% of the values in the pre-war context. Similarly, the 2.5-sigma rules consider anomalies those values that are lower than the average minus 2.5 standard deviations. The 3-sigma rule is more conservative while the 2.5-sigma rule can result in a higher number of false alarms. See example of this empirical rule below.

Fig. 9.2 Illustration of the empirical rule.#
The result of this step is a raster layer of 0-1, where 0 represents that no anomaly was detected and 1 the opposite.
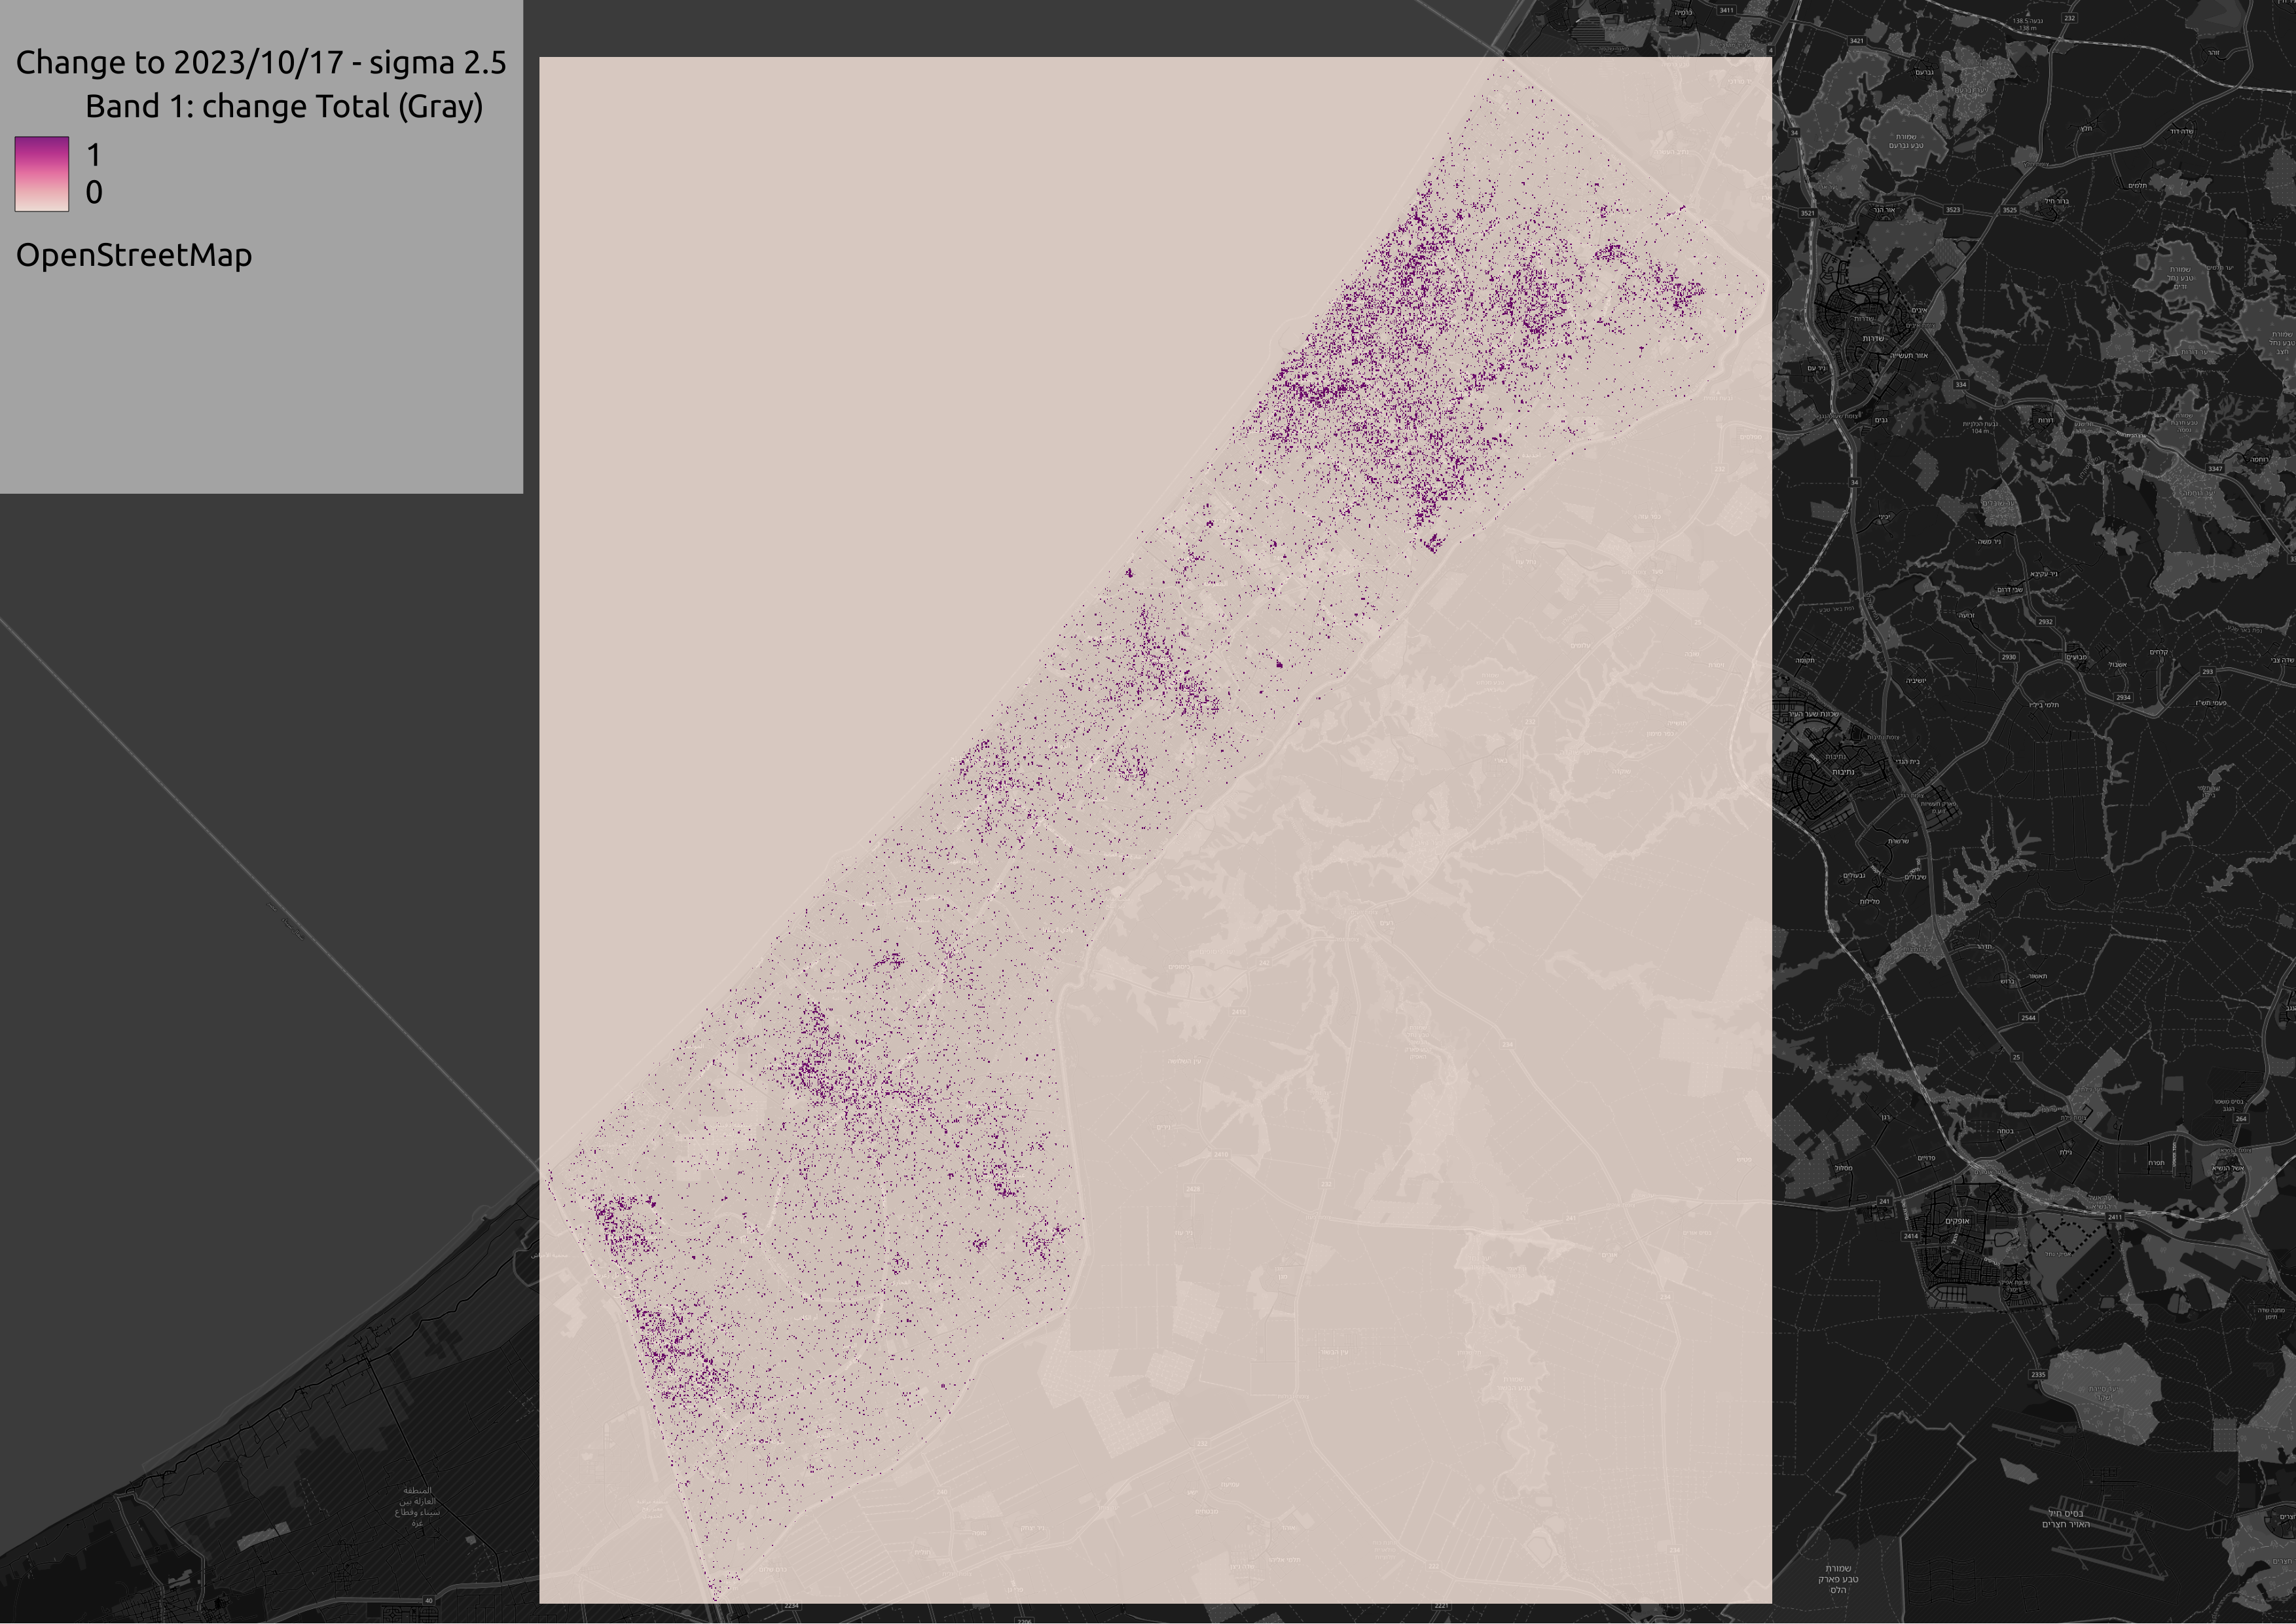
Fig. 9.3 Resulting anomaly detection raster layer for the 2023-10-17.#
9.3.3. Infrastructural damage assessment using the change maps and the vector layers#
This step will be explained when assessing the Infrastructural damage assessment.
9.4. Limitations#
Caution
Using OpenStreetMap (OSM) and Interferometric Synthetic Aperture Radar (InSAR) for estimating building damage has its strengths but also several limitations:
Incomplete Data:
Coverage Discrepancies: OSM data might lack comprehensive coverage, especially in certain regions or areas with limited community input or verification. This can lead to incomplete or outdated information about buildings. For instance, Bittner [Bit17] outlined the Israeli domination of OSM entries, whereas there are far fewer mappers in Palestine.
Quality Variability: Data quality can vary significantly as it relies on volunteer contributions. Accuracy in mapping may vary, leading to inconsistencies or errors in identifying buildings.
Temporal Limitations:
Data Timeliness: OSM data might not be up to date due to infrequent updates or changes in the landscape that haven’t been reflected yet.
InSAR Timing: InSAR data might not capture the most recent changes or damages, especially in rapidly evolving situations where damage continues to occur after the data collection period.
Contextual Understanding:
Local Knowledge: OSM data might lack contextual information crucial for assessing damages accurately, such as the original state of buildings or variations in construction materials.
Verification Challenges: Verifying damages solely based on remote sensing data might lack the on-ground verification necessary for a comprehensive understanding of the situation.
9.5. References#
- Bit17
Christian Bittner. Openstreetmap in israel and palestine – ‘game changer’ or reproducer of contested cartographies? Political Geography, 57:34–48, 2017. URL: https://www.sciencedirect.com/science/article/pii/S096262981630035X, doi:https://doi.org/10.1016/j.polgeo.2016.11.010.