11.4. Open Street Maps - OSM#
OpenStreetMap is a free, editable map of the whole world that is being built by volunteers largely from scratch and released with an open-content license. From this source, one can download Points of Interest (POIs) like schools, hospitals, churchs, etc. Also, the entire road network of a city can be downloaded. Source.
OSM has an API for accessing their data. However, this course uses OSMnx, a Python package that simplifies the querying process.
11.4.1. Downloading POIs#
OSMnx has the features module that downloads OpenStreetMap geospatial features’ geometries and attributes. According to the documentation, the module:
Retrieves points of interest, building footprints, transit lines/stops, or any other map features from OSM, including their geometries and attribute data, then constructs a GeoDataFrame of them. You can use this module to query for nodes, ways, and relations (the latter of type “multipolygon” or “boundary” only) by passing a dictionary of desired OSM tags.
This module allows you to retrieve the data by providing an address, a bounding box, a place, a point (and buffer distance), a polygon, or XML. Tags are used to constrain the download to desired objects alone. In OSM, tags are used to describe map element features. For example, the highway tag is used for describing the importance of the road on the network. Besides, a map element can have more than one tag; for example, a road can also have the oneway tag indicating whether the traffic flows in one direction only, or the lanes tag indicating the number of lanes.
11.4.1.1. Download Hospitals#
In order to download all POIs specified as hospitals, one would do the following:
# ! pip install geopandas osmnx folium

import osmnx as ox
import geopandas as gpd
from shapely import Point, Polygon
import folium
# Obtain the Area of Interest
#Generate a dataframe with the epicenter of the earthquake.
gdf = gpd.GeoDataFrame({'name': ['epicenter'], 'geometry': [Point(37.196, 38.011)]}, crs="EPSG:4326")

# Reproject to a projected CRS that is in meters
gdf = gdf.to_crs('EPSG:23036')
# Generate a buffer of 50km around the epicenter
gdf['buffer'] = gdf.geometry.apply(lambda x: x.buffer(50000))
#GDF cannot have more than one geometry, so, we are defining the buffer as the geometry of the GDF.
gdf = gdf.set_geometry('buffer')
# In the future, we will need to have the bounding box of the circle/square in latitude and longitude, so we will convert the GDF back to EPSG:4326
gdf = gdf.to_crs('EPSG:4326')
east, south, west, north = gdf.loc[0]['buffer'].bounds
gdf.loc[1, 'name'] = 'epicenter_rectangle'
gdf.loc[1, 'buffer'] = Polygon(((east,north), (west, north), (west, south), (east, south)))
gdf.explore(tiles = 'CartoDB positron')
tags = {'amenity': 'hospital'}
hospitals = ox.features_from_polygon(gdf.geometry.loc[1], tags=tags)
hospitals.head() # The result is a GeoDataFrame
| geometry | nodes | addr:district | amenity | barrier | emergency | healthcare | name | operator | operator:wikidata | addr:city | check_date | fixme | note | phone | source | name:en | building | ||
|---|---|---|---|---|---|---|---|---|---|---|---|---|---|---|---|---|---|---|---|
| element_type | osmid | ||||||||||||||||||
| way | 323012799 | POLYGON ((37.66018 37.79079, 37.66082 37.79013... | [2550330093, 2550330094, 2550330095, 255033009... | Gölbaşı | hospital | wall | yes | hospital | Gölbaşı Devlet Hastanesi | Sağlık Bakanlığı | Q4294365 | NaN | NaN | NaN | NaN | NaN | NaN | NaN | NaN |
| 321950596 | POLYGON ((37.15758 38.20408, 37.15762 38.20240... | [3287180177, 3287180178, 6504350304, 650435030... | NaN | hospital | NaN | yes | hospital | Elbistan Devlet Hastanesi | NaN | NaN | Elbistan | NaN | NaN | NaN | NaN | NaN | NaN | NaN | |
| 321950616 | POLYGON ((37.18443 38.20627, 37.18452 38.20593... | [3287184311, 3287184312, 3287184313, 328718431... | Kahramanmaraş | hospital | NaN | NaN | hospital | Ozel Elbistan Yasam Hastanesi | NaN | NaN | NaN | 2023-02-07 | resurvey after recovery | Battalgazi Mah. Adnan Menderes Bulv. | +903444130303 | SafeGraph | NaN | NaN | |
| 879054113 | POLYGON ((37.24591 38.21331, 37.24659 38.21345... | [8177780901, 8177780902, 3287649682, 817778090... | NaN | hospital | NaN | NaN | hospital | Çiçek Sağlık Evi | NaN | NaN | NaN | NaN | NaN | NaN | NaN | NaN | NaN | NaN | |
| node | 3092021920 | POINT (36.92781 37.57840) | NaN | NaN | hospital | NaN | NaN | hospital | Devakent Hastanesi | NaN | NaN | NaN | NaN | NaN | NaN | NaN | NaN | NaN | NaN |
As it is shown, the element type, in this particular case, can be a way or a node. More information about ways can be found here.
The hospitals can be represented as a point or a polygon.
As it can be seen in the map below, “Afşin Devlet Hastanesi” hospital is being double counted. This is expected due to the nature of the data, crowd sourced. Depending on the usage of the data, one might need to clean the dataset with more or less effort. For example, if the goal is to register all the hospitals that might had been affected, then, double-counting might not be an issue. However, if the goal is to estimate number of affected hospitals, double-counting will need to be eliminated.
m = folium.Map(location=(38.236801, 36.896292), zoom_start = 15, tiles = 'CartoDB positron')
hospitals.explore(m = m)
11.4.1.2. Download footprints#
# If the goal is to download all the footprints of buildings, one can avoid specifying a tag and use True
tags = {'building': True}
footprints = ox.features_from_polygon(gdf.geometry.loc[1], tags=tags)
/home/sol/venv/lib/python3.10/site-packages/pandas/core/dtypes/cast.py:1641: DeprecationWarning: np.find_common_type is deprecated.  Please use `np.result_type` or `np.promote_types`.
See https://numpy.org/devdocs/release/1.25.0-notes.html and the docs for more information.  (Deprecated NumPy 1.25)
  return np.find_common_type(types, [])
/home/sol/venv/lib/python3.10/site-packages/pandas/core/algorithms.py:522: DeprecationWarning: np.find_common_type is deprecated.  Please use `np.result_type` or `np.promote_types`.
See https://numpy.org/devdocs/release/1.25.0-notes.html and the docs for more information.  (Deprecated NumPy 1.25)
  common = np.find_common_type([values.dtype, comps_array.dtype], [])
footprints.head()
| nodes | building | source | geometry | layer | amenity | religion | denomination | name | addr:city | ... | stroller | roof:colour | disused:shop | building:levels:underground | grades | name:nl | loc_name | fee | house | operator:short | ||
|---|---|---|---|---|---|---|---|---|---|---|---|---|---|---|---|---|---|---|---|---|---|---|
| element_type | osmid | |||||||||||||||||||||
| way | 96356603 | [1116696897, 1116695889, 1116699267, 111669386... | yes | bing | POLYGON ((37.56554 37.73040, 37.56524 37.73063... | NaN | NaN | NaN | NaN | NaN | NaN | ... | NaN | NaN | NaN | NaN | NaN | NaN | NaN | NaN | NaN | NaN |
| 96356615 | [1116697300, 1116698584, 1116697231, 111669474... | yes | bing | POLYGON ((37.50147 37.58960, 37.50127 37.58934... | NaN | NaN | NaN | NaN | NaN | NaN | ... | NaN | NaN | NaN | NaN | NaN | NaN | NaN | NaN | NaN | NaN | |
| 96356633 | [1116697414, 10657820222, 10657820223, 1116696... | yes | bing | POLYGON ((37.52466 37.79285, 37.52449 37.79282... | NaN | NaN | NaN | NaN | NaN | NaN | ... | NaN | NaN | NaN | NaN | NaN | NaN | NaN | NaN | NaN | NaN | |
| 96356636 | [1116696169, 1116694465, 1116698816, 111669747... | roof | bing | POLYGON ((37.50541 37.64448, 37.50507 37.64464... | 1 | NaN | NaN | NaN | NaN | NaN | ... | NaN | NaN | NaN | NaN | NaN | NaN | NaN | NaN | NaN | NaN | |
| 96356643 | [1116696468, 1116695075, 1116699005, 111669768... | mosque | bing | POLYGON ((37.56499 37.73094, 37.56477 37.73095... | NaN | place_of_worship | muslim | NaN | NaN | NaN | ... | NaN | NaN | NaN | NaN | NaN | NaN | NaN | NaN | NaN | NaN |
5 rows × 125 columns
print('With OSM {} buildings were downloaded'.format(len(footprints)))
With OSM 160180 buildings were downloaded
footprints.amenity.value_counts()
place_of_worship    402
school               13
police                8
library               8
community_centre      7
clinic                6
restaurant            6
bank                  6
townhall              5
cafe                  5
public_building       5
marketplace           4
car_wash              3
parking               3
public_bath           2
bus_station           2
courthouse            2
food_court            2
toilets               2
prison                1
dentist               1
mosque                1
social_facility       1
hospital              1
theatre               1
fire_station          1
Name: amenity, dtype: int64
footprints.head(1000).explore(tiles = 'CartoDB positron')
Let’s explore the limitations of this data with an example. When downloading all the amenities tagged as restaurant, only 17 places are found. It seems unlikely that there are 17 restaurants in the entire region. So, it is worth querying all the amenities. Unfortunately, the result is the same and the quality of the data for restaurants is not good.
tags = {'amenity': 'restaurant'}
restaurant = ox.features_from_polygon(gdf.geometry.loc[1], tags=tags)
/home/sol/venv/lib/python3.10/site-packages/pandas/core/dtypes/cast.py:1641: DeprecationWarning: np.find_common_type is deprecated.  Please use `np.result_type` or `np.promote_types`.
See https://numpy.org/devdocs/release/1.25.0-notes.html and the docs for more information.  (Deprecated NumPy 1.25)
  return np.find_common_type(types, [])
/home/sol/venv/lib/python3.10/site-packages/pandas/core/algorithms.py:522: DeprecationWarning: np.find_common_type is deprecated.  Please use `np.result_type` or `np.promote_types`.
See https://numpy.org/devdocs/release/1.25.0-notes.html and the docs for more information.  (Deprecated NumPy 1.25)
  common = np.find_common_type([values.dtype, comps_array.dtype], [])
len(restaurant)
17
tags = {'amenity': True}
amenities = ox.features_from_polygon(gdf.geometry.loc[1], tags=tags)
/home/sol/venv/lib/python3.10/site-packages/pandas/core/dtypes/cast.py:1641: DeprecationWarning: np.find_common_type is deprecated.  Please use `np.result_type` or `np.promote_types`.
See https://numpy.org/devdocs/release/1.25.0-notes.html and the docs for more information.  (Deprecated NumPy 1.25)
  return np.find_common_type(types, [])
/home/sol/venv/lib/python3.10/site-packages/pandas/core/algorithms.py:522: DeprecationWarning: np.find_common_type is deprecated.  Please use `np.result_type` or `np.promote_types`.
See https://numpy.org/devdocs/release/1.25.0-notes.html and the docs for more information.  (Deprecated NumPy 1.25)
  common = np.find_common_type([values.dtype, comps_array.dtype], [])
amenities['amenity'].value_counts()
place_of_worship    405
pharmacy            224
school              212
fuel                133
parking              80
bank                 58
cafe                 40
clinic               26
hospital             20
atm                  17
restaurant           17
drinking_water       15
waste_disposal       11
food_court           11
police               10
library              10
marketplace           9
toilets               8
kindergarten          8
community_centre      7
university            6
car_wash              6
fast_food             6
townhall              6
public_building       5
social_facility       4
water_point           3
taxi                  3
post_office           3
dentist               3
bus_station           2
prison                2
refugee_site          2
public_bath           2
fire_station          2
courthouse            2
shelter               2
social_centre         2
vending_machine       2
theatre               2
cinema                2
compressed_air        1
mosque                1
internet_cafe         1
veterinary            1
bar                   1
car_rental            1
childcare             1
arts_centre           1
bicycle_parking       1
ticket_validator      1
charging_station      1
payment_terminal      1
museum                1
grave_yard            1
parking_space         1
Name: amenity, dtype: int64
11.4.2. Discussion#
What do you think about this dataset?
In which crisis related task will it become handy?
Do you see any other limitation?
Which are your proposals to clean this type of data?
11.4.2.1. Note#
OSM data can be downloaded in other ways as well, for example using QGIS or even ChatGPT. This course decided to use OSMnx, as it more flexible.
11.4.3. HOT Export Tool#
HOT is an international team dedicated to humanitarian action and community development through open mapping. They work together to provide map data which revolutionizes disaster management, reduces risks, and contributes to achievement of the Sustainable Development Goals.
The Export Tool is an open service that creates customized extracts of up-to-date OSM data in various file formats. This allows users to download the necessary data for a region of interest without requiring coding experience. Below, we show the 4 steps to obtain the data with this tool.
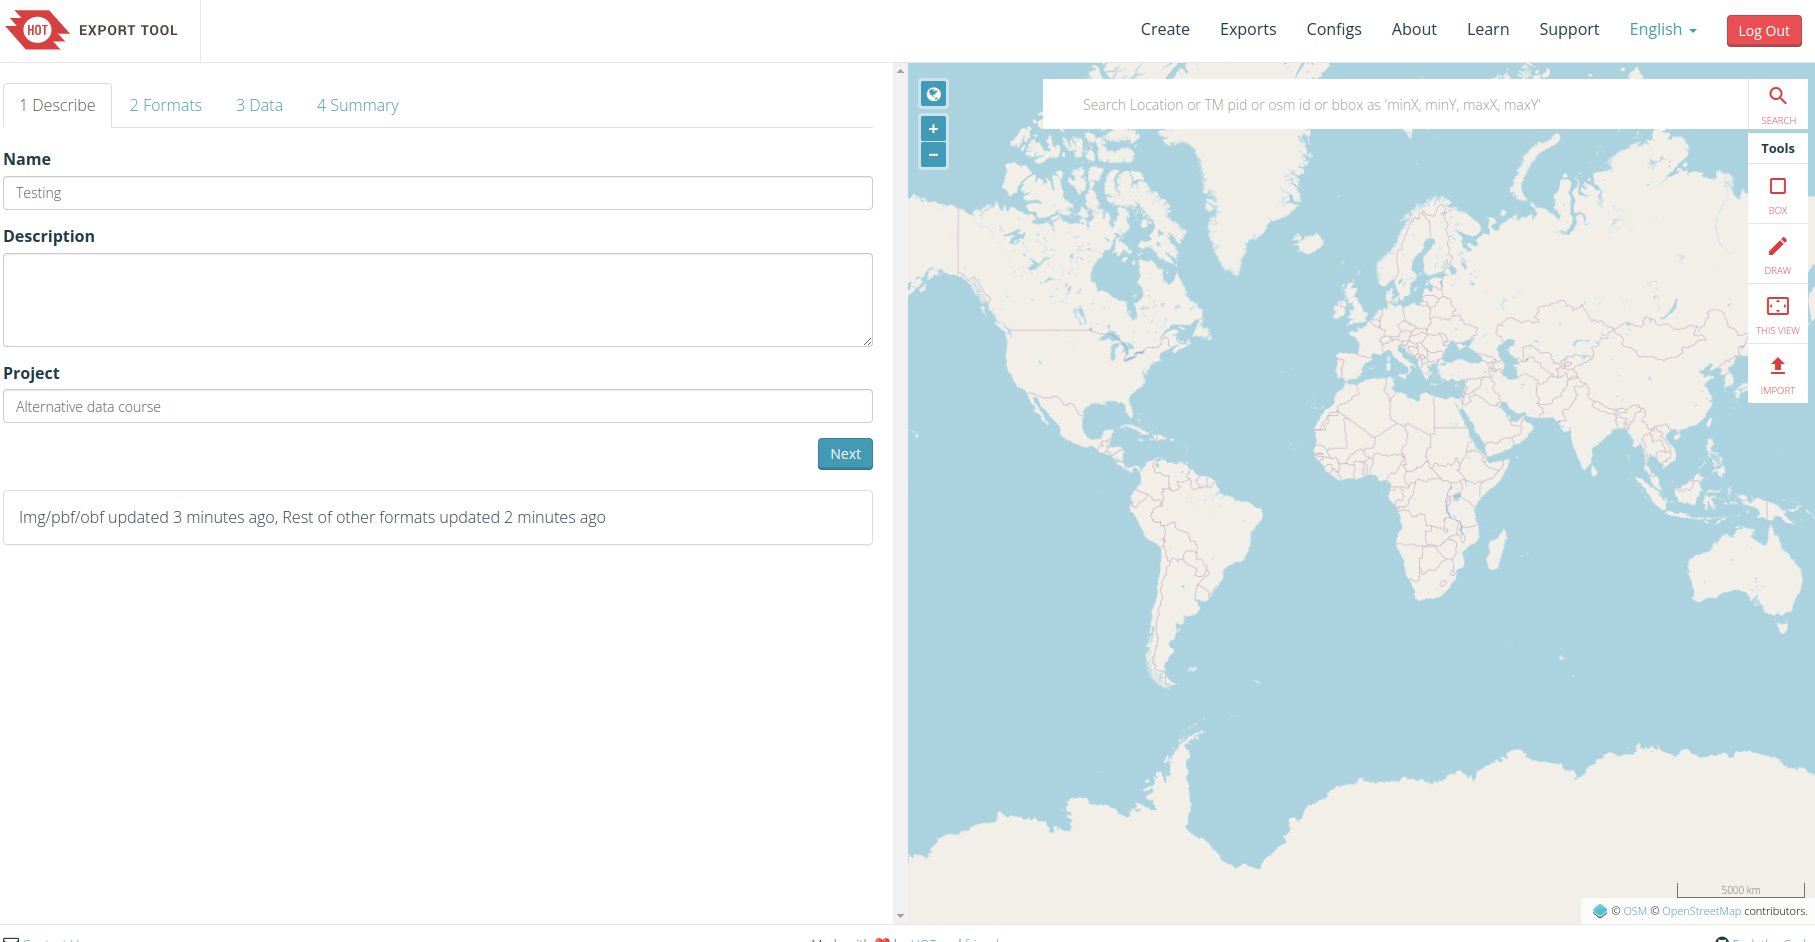
Fig. 11.1 Project definition.#
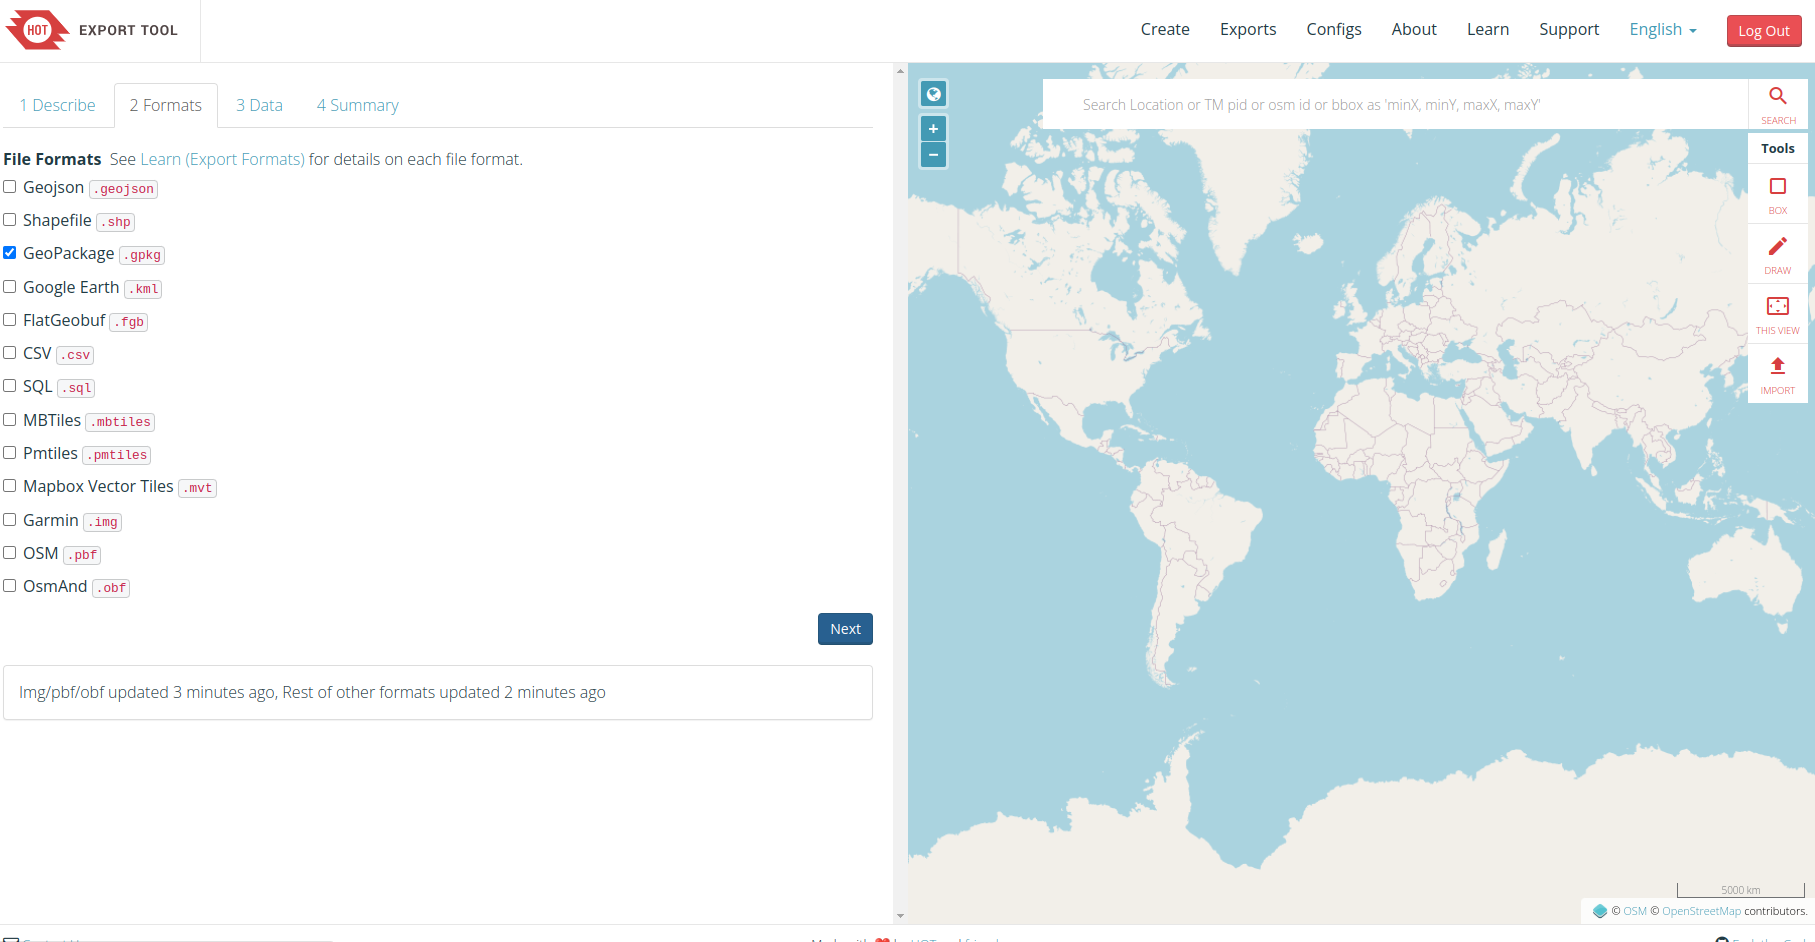
Fig. 11.2 Define the extension of the output file.#
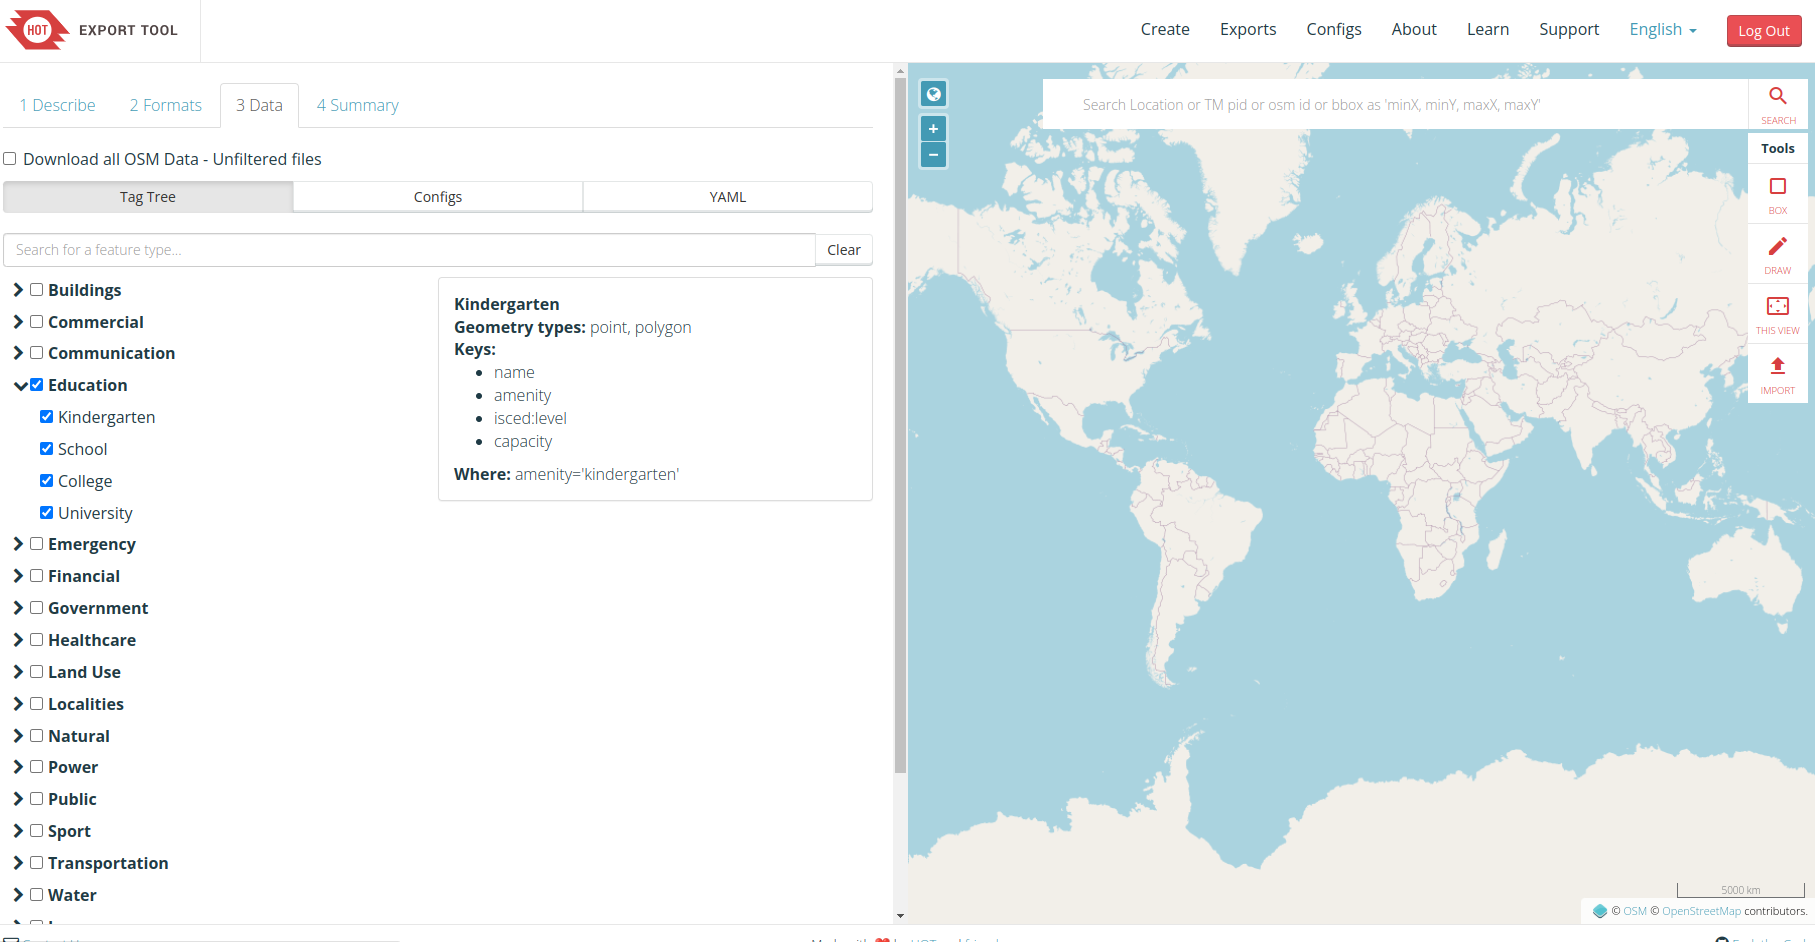
Fig. 11.3 Select the data you want to export.#
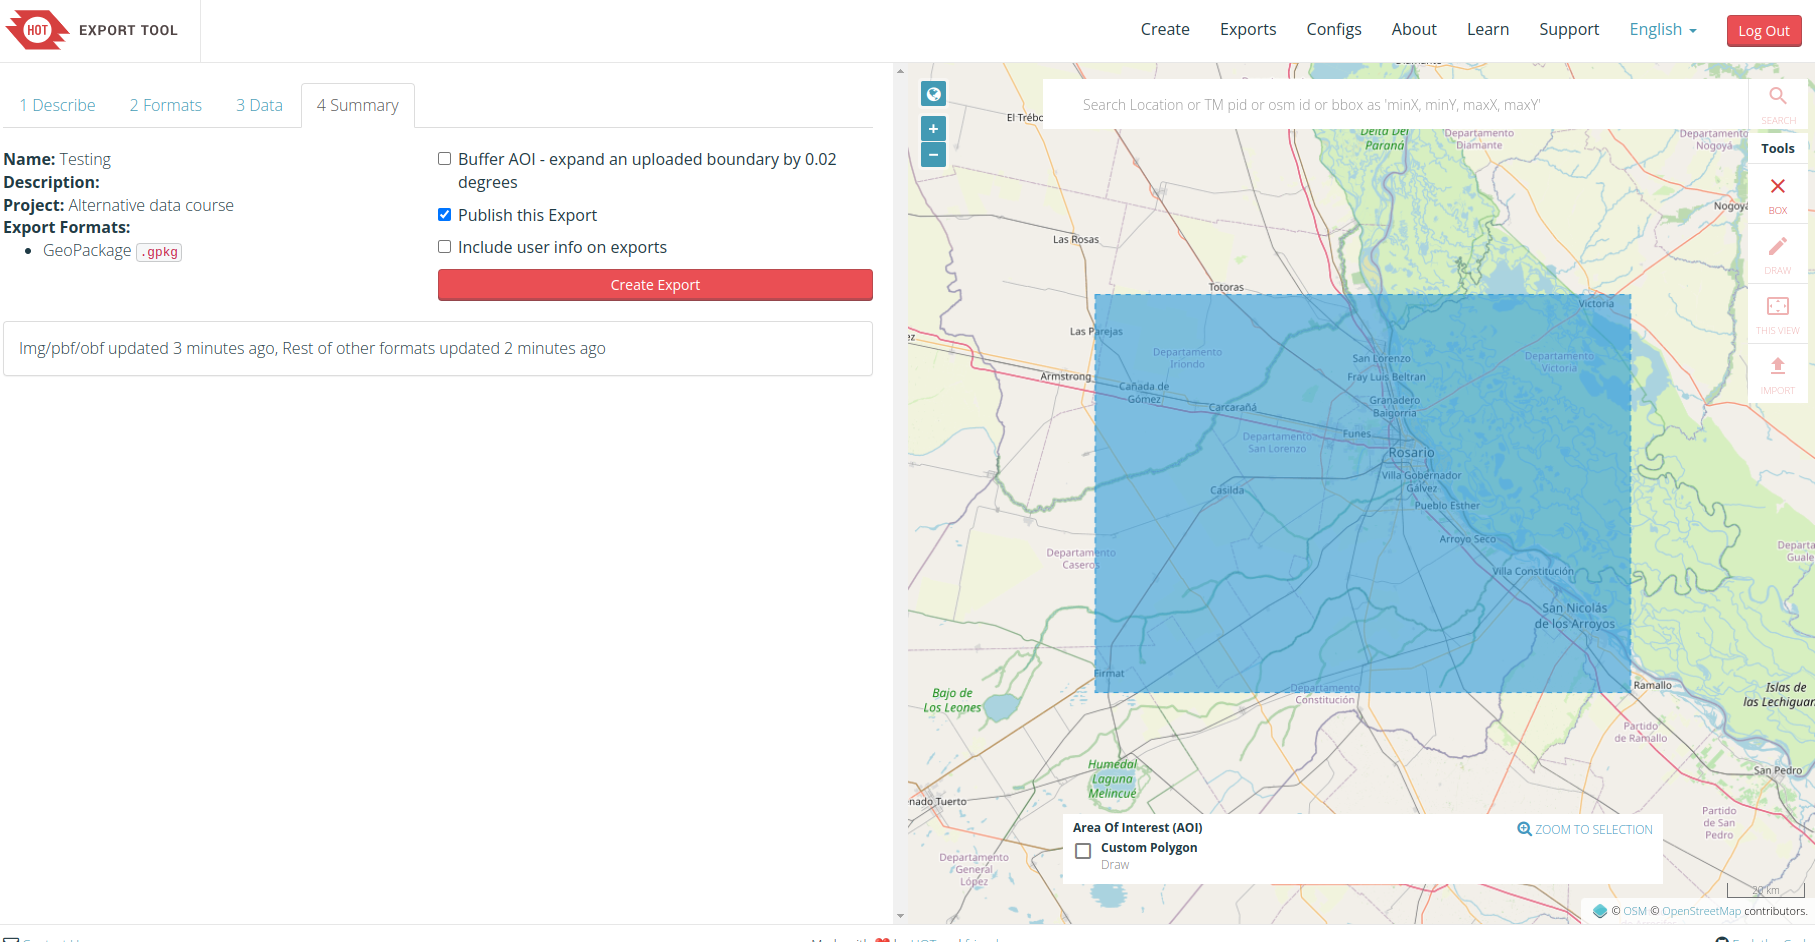
Fig. 11.4 Define your area of interest and export.#