20.5. Port Call Trends Monitor - Methodology#
This section examines how AIS-derived trade estimates have evolved in ports along the Red Sea given the conflict in the Middle East and the escalating attacks in the Red Sea.
20.5.1. Ports of interest#
The first step is to detect the ports of interest, which for this study are the ones in Egypt, Yemen, Djibouti, Jordan and Saudi Arabia.
countries = ["Egypt", "Yemen", "Djibouti", "Jordan", "Saudi Arabia"]
ports = api_call("https://services9.arcgis.com/weJ1QsnbMYJlCHdG/arcgis/rest/services/PortWatch_ports_database/FeatureServer/0/query?where=1%3D1&outFields=*&outSR=4326&f=json")
ports_oi = ports[ports['country'].isin(countries)]
ports_red_sea = create_gdf(ports_oi, 'EPSG:4326', 'lat', 'lon')
ports_red_sea.head()
| portid | portname | country | ISO3 | continent | fullname | lat | lon | vessel_count_total | vessel_count_container | vessel_count_dry_bulk | vessel_count_general_cargo | vessel_count_RoRo | vessel_count_tanker | industry_top1 | industry_top2 | industry_top3 | share_country_maritime_import | share_country_maritime_export | LOCODE | pageid | countrynoaccents | ObjectId | geometry | |
|---|---|---|---|---|---|---|---|---|---|---|---|---|---|---|---|---|---|---|---|---|---|---|---|---|
| 14 | port23 | Alexandria | Egypt | EGY | Africa | Alexandria, Egypt | 31.155365 | 29.837591 | 2942 | 835 | 447 | 1147 | 141 | 369 | Mineral Products | Vegetable Products | Metals | 21.61 | 8.24 | None | a068e6e45ebc45ecb3aeda0a5ea19a38 | Egypt | 15 | POINT (29.83759 31.15537) |
| 19 | port71 | As Suways | Egypt | EGY | Africa | As Suways, Egypt | 29.951008 | 32.530639 | 221 | 1 | 6 | 87 | 3 | 123 | Mineral Products | Chemical & Allied Industries | Stone & Glass | 0.15 | 0.46 | None | 985a636a613c43919bfb65a922bd6e6b | Egypt | 20 | POINT (32.53064 29.95101) |
| 33 | port191 | Safaga | Egypt | EGY | Africa | Safaga, Egypt | 26.725556 | 33.942231 | 213 | 0 | 81 | 127 | 0 | 2 | Vegetable Products | Mineral Products | Prepared Foodstuffs & Beverages | 1.92 | 2.57 | EG SGA | 11463b58a3054345a897c7484b631d20 | Egypt | 34 | POINT (33.94223 26.72556) |
| 41 | port192 | Port Said | Egypt | EGY | Africa | Port Said, Egypt | 31.249586 | 32.307719 | 796 | 499 | 33 | 158 | 10 | 94 | Mineral Products | Vegetable Products | Chemical & Allied Industries | 3.38 | 3.94 | None | 87392bda133f4d98ac6a7d3ed8d4a6b5 | Egypt | 42 | POINT (32.30772 31.24959) |
| 47 | port274 | Damietta | Egypt | EGY | Africa | Damietta, Egypt | 31.462137 | 31.759472 | 2104 | 692 | 603 | 679 | 2 | 126 | Mineral Products | Chemical & Allied Industries | Vegetable Products | 19.27 | 19.42 | None | 1b9285ff906f45c0aa30f0a6f15199d4 | Egypt | 48 | POINT (31.75947 31.46214) |
ports_red_sea[
    [
        "geometry",
        "portname",
        "country",
        "vessel_count_total",
        "vessel_count_container",
        "vessel_count_dry_bulk",
        "vessel_count_general_cargo",
        "vessel_count_RoRo",
        "vessel_count_tanker",
        "industry_top1",
        "industry_top2",
        "industry_top3",
        "share_country_maritime_import",
        "share_country_maritime_export",
    ]
].explore(
    column="country",
    cmap="Dark2",
    marker_kwds={"radius": 7},
    tiles="Esri.WorldGrayCanvas",
    legend_kwds={"loc": "upper right", "caption": "Ports"},
    # attribution = 'chec'
)
20.5.2. Retrieve the data#
This example processes daily estimated trade (imports and exports) since 2019 from the IMF’s PortWatch platform. The process is similar to what was done for chokepoints. First, the URL for the API call needs to be build. After that, successive calls that return 1000 registers need to be done to download the complete dataset.
Sample URL to download portid 23 and 31:
def get_port_data(ports, url_base):
    for port in ports:
        if port == ports[-1]:
            url_base += (
                f"portid%3D%27{port}%27&outFields=*&outSR=4326&f=json&resultOffset=0"
            )
        else:
            url_base += f"portid%3D%27{port}%27+OR+"
    res = requests.get(url_base)
    df = pd.DataFrame([d["attributes"] for d in res.json()["features"]])
    offset = 1000
    while len(df) % 1000 == 0:
        res = requests.get(url_base.replace("resultOffset=0", f"resultOffset={offset}"))
        df2 = pd.DataFrame([d["attributes"] for d in res.json()["features"]])
        df = pd.concat([df, df2])
        offset += 1000
    df.reset_index(inplace=True, drop=True)
    df["date"] = df.date.apply(lambda x: datetime.fromtimestamp(x / 1000))
    df.sort_values(["portid", "date"], inplace=True)
    return df
url_base = "https://services9.arcgis.com/weJ1QsnbMYJlCHdG/arcgis/rest/services/Daily_Trade_Data/FeatureServer/0/query?where="
ports = list(ports_red_sea.portid)
df_ports = get_port_data(ports, url_base)
df_ports.to_csv('ports_call.csv') # Save the call locally to avoid repeating it
# Reload the save data.
df = pd.read_csv('ports_call.csv')
df.date = pd.to_datetime(df.date)
df = df.loc[df.date >= "2019-01-01"].copy()
20.5.3. Resample to Weekly#
Since the data is daily and there are multiple days with no trade, first data was weekly resampled.
df_week = df.groupby(["portname", "portid"])[
        [
            "portcalls_cargo",
            "portcalls_tanker",
            "portcalls",
            "import_cargo",
            "export_cargo",
            "import_tanker",
            "export_tanker",
            "import",
            "export",
            "date",
        ]
    ].resample("W-Mon", on="date").sum().reset_index()

df_week.loc[:, "ymd"] = df_week.date.dt.strftime("%Y-%m-%d")
df_week.loc[:, "w"] = df_week.date.dt.strftime("%W") # Week number of the year
df_week.head()
| portname | portid | date | portcalls_cargo | portcalls_tanker | portcalls | import_cargo | export_cargo | import_tanker | export_tanker | import | export | ymd | w | |
|---|---|---|---|---|---|---|---|---|---|---|---|---|---|---|
| 0 | Aden | port9 | 2019-01-07 | 9 | 1 | 10 | 67364.559011 | 6774.851456 | 0.000000 | 0.000000 | 67364.559011 | 6774.851456 | 2019-01-07 | 01 |
| 1 | Aden | port9 | 2019-01-14 | 9 | 0 | 9 | 57414.729623 | 0.000000 | 0.000000 | 0.000000 | 57414.729623 | 0.000000 | 2019-01-14 | 02 |
| 2 | Aden | port9 | 2019-01-21 | 9 | 3 | 12 | 62216.623451 | 494.407228 | 23018.373940 | 3160.095388 | 85234.997391 | 3654.502616 | 2019-01-21 | 03 |
| 3 | Aden | port9 | 2019-01-28 | 5 | 2 | 7 | 32504.098000 | 0.000000 | 2391.884286 | 0.000000 | 34895.982286 | 0.000000 | 2019-01-28 | 04 |
| 4 | Aden | port9 | 2019-02-04 | 11 | 2 | 13 | 69051.590774 | 13218.182961 | 36085.859781 | 3160.095388 | 105137.450555 | 16378.278349 | 2019-02-04 | 05 |
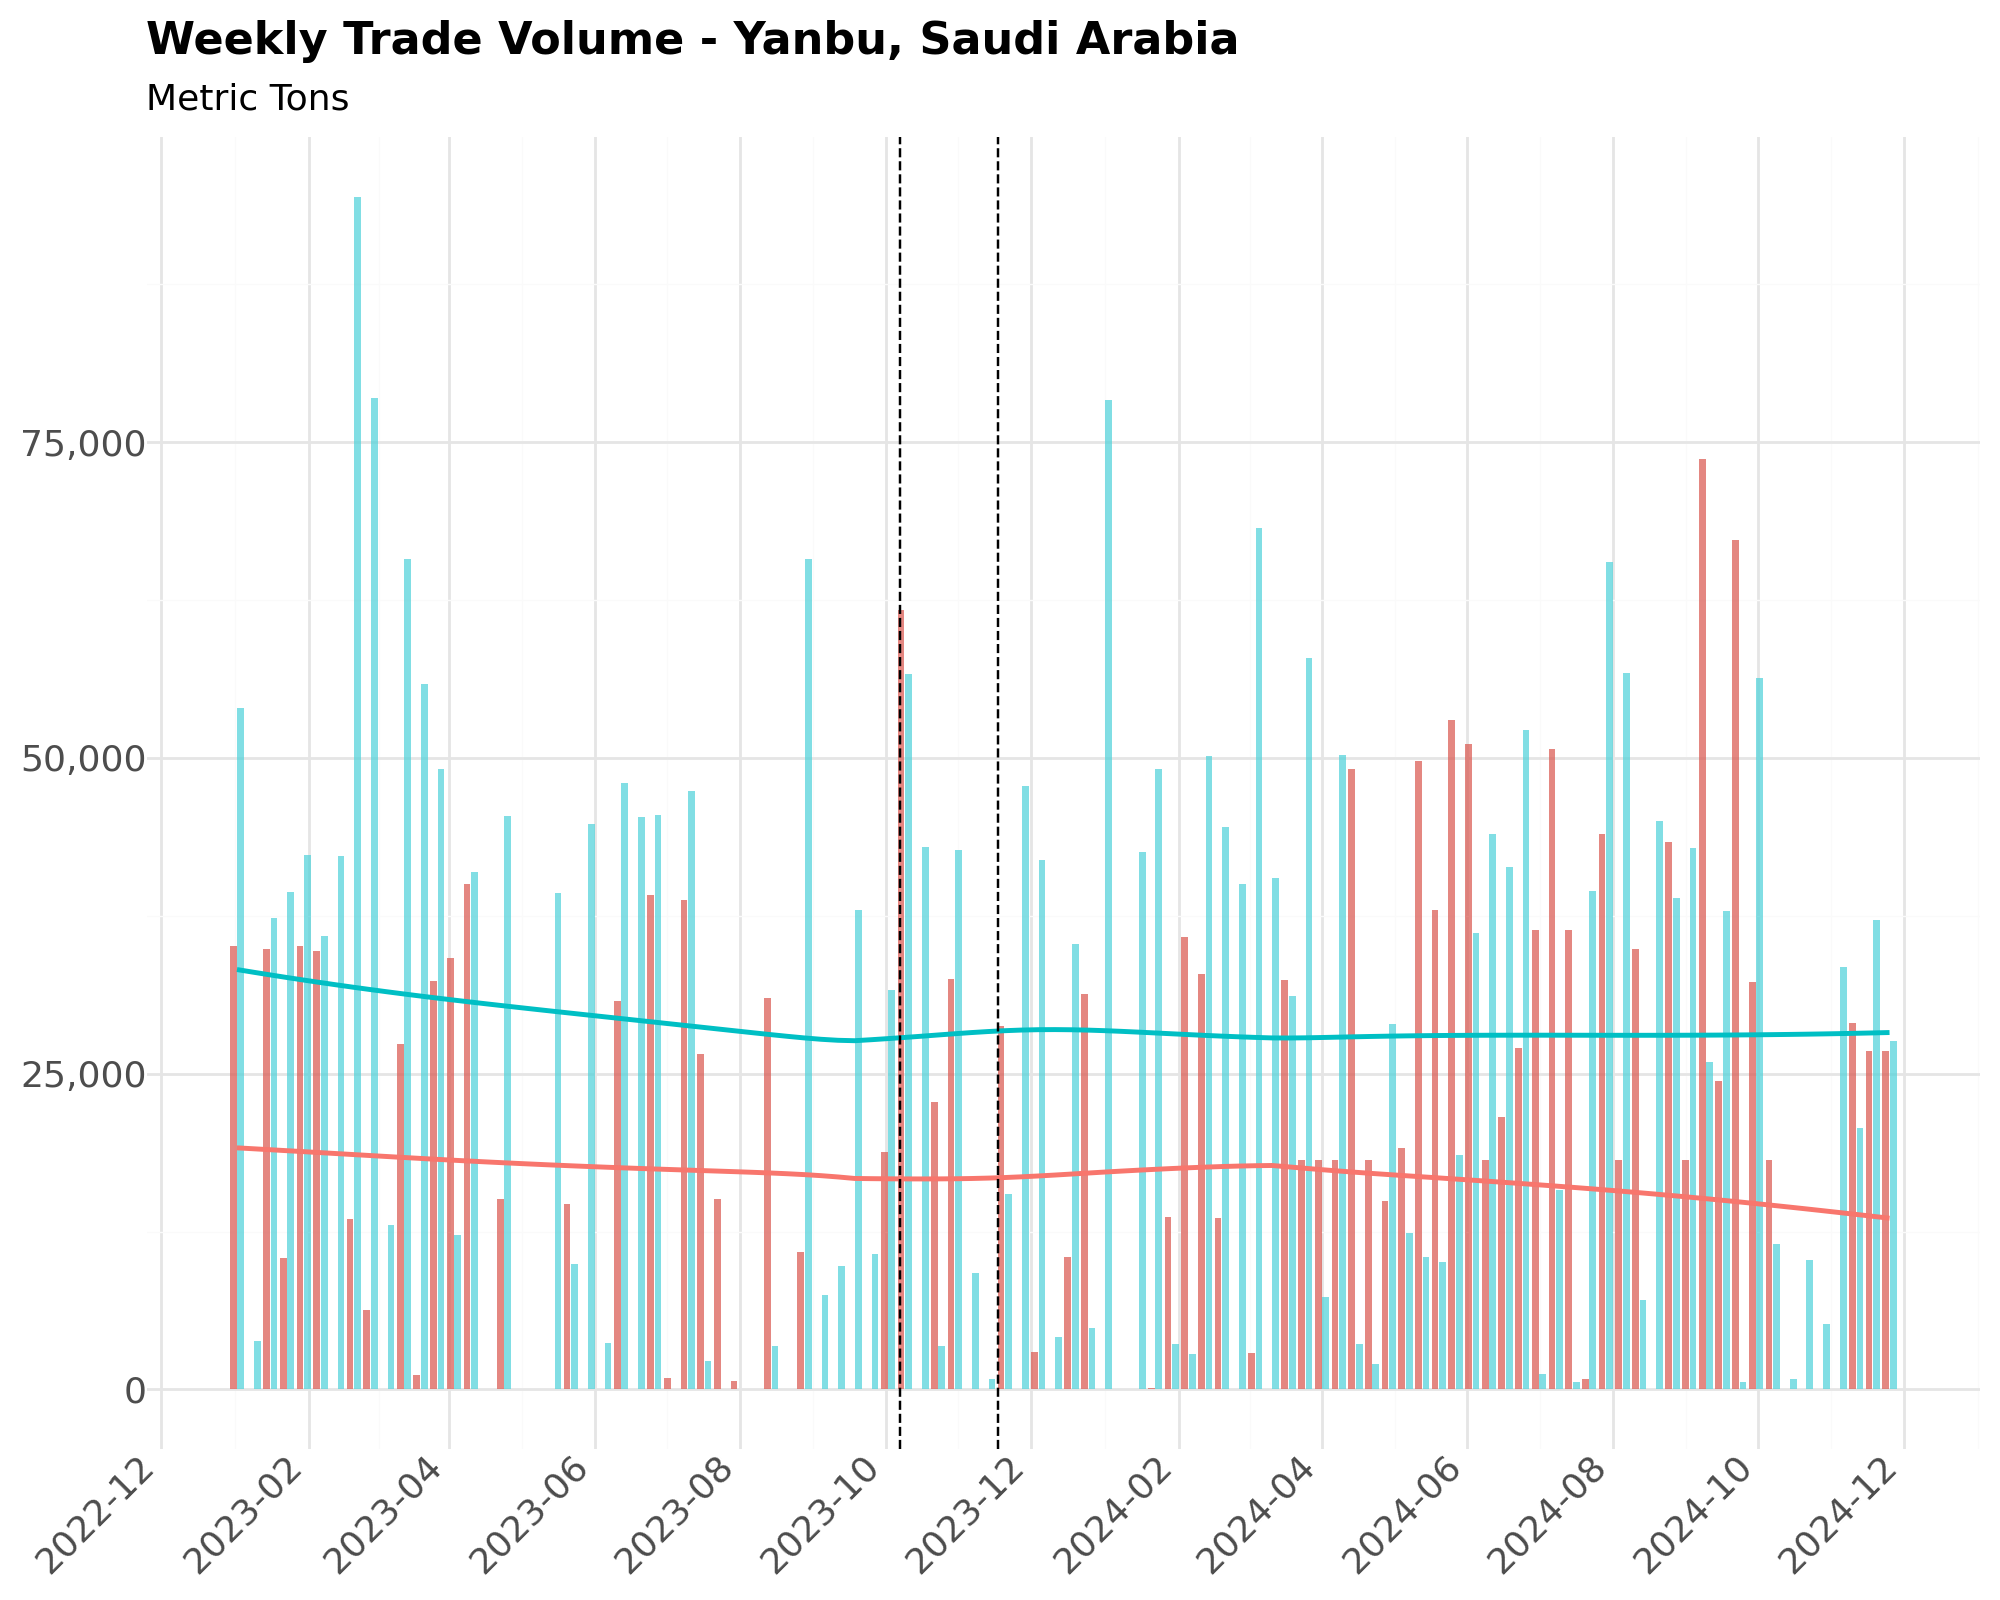
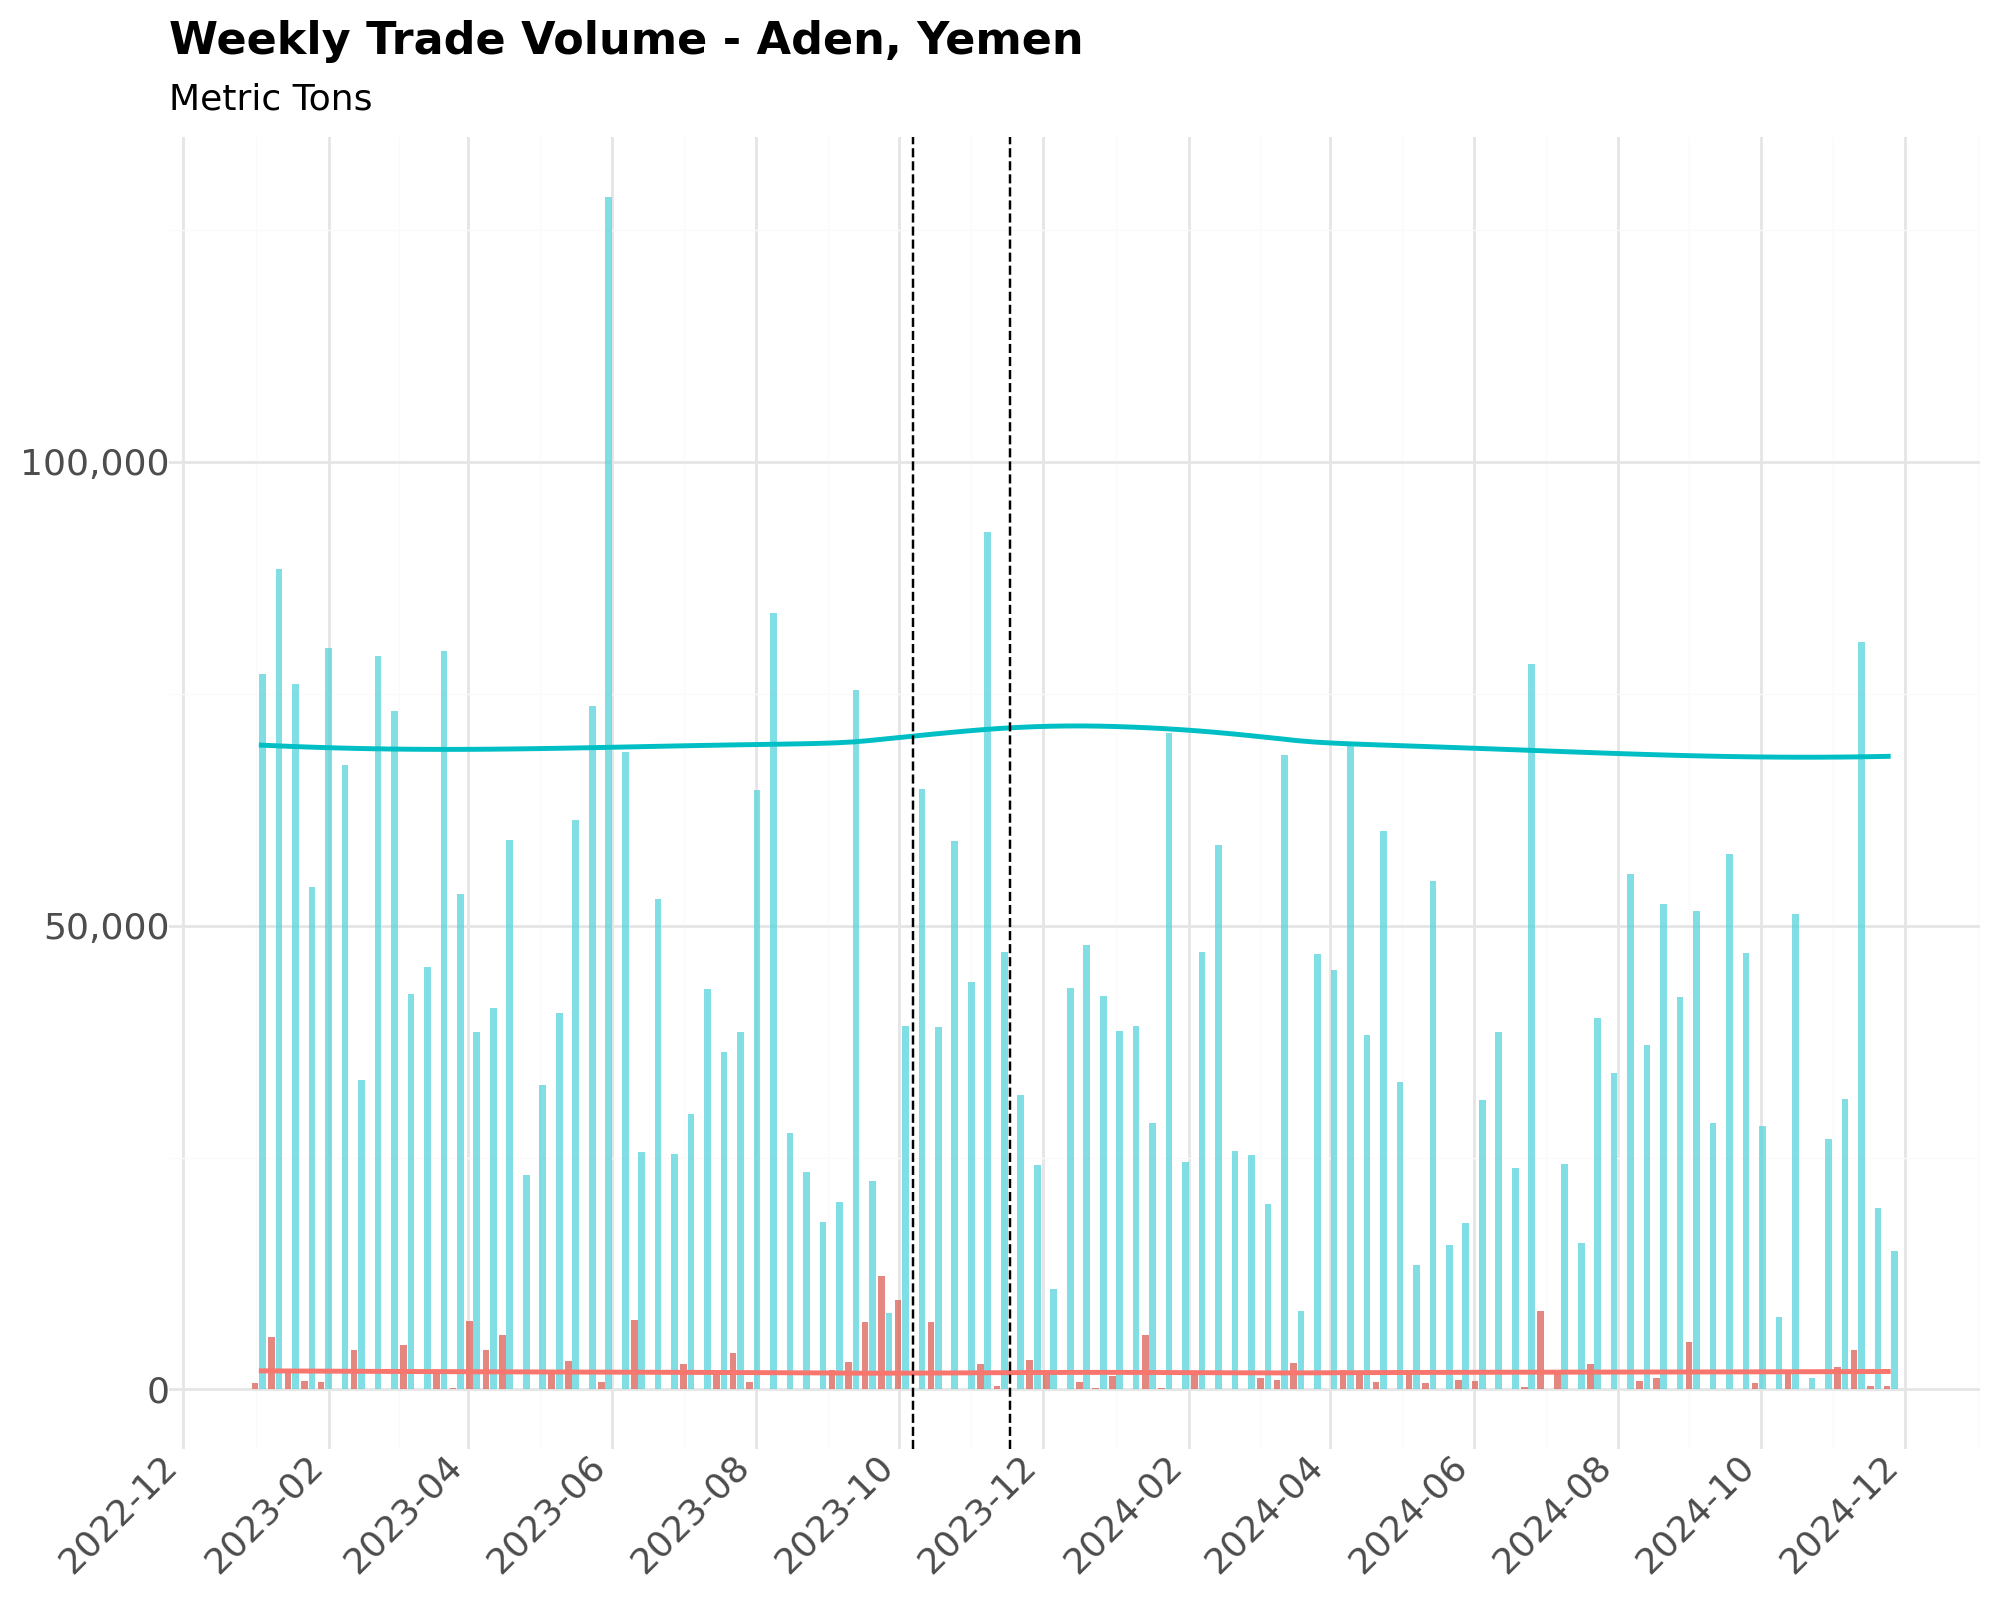
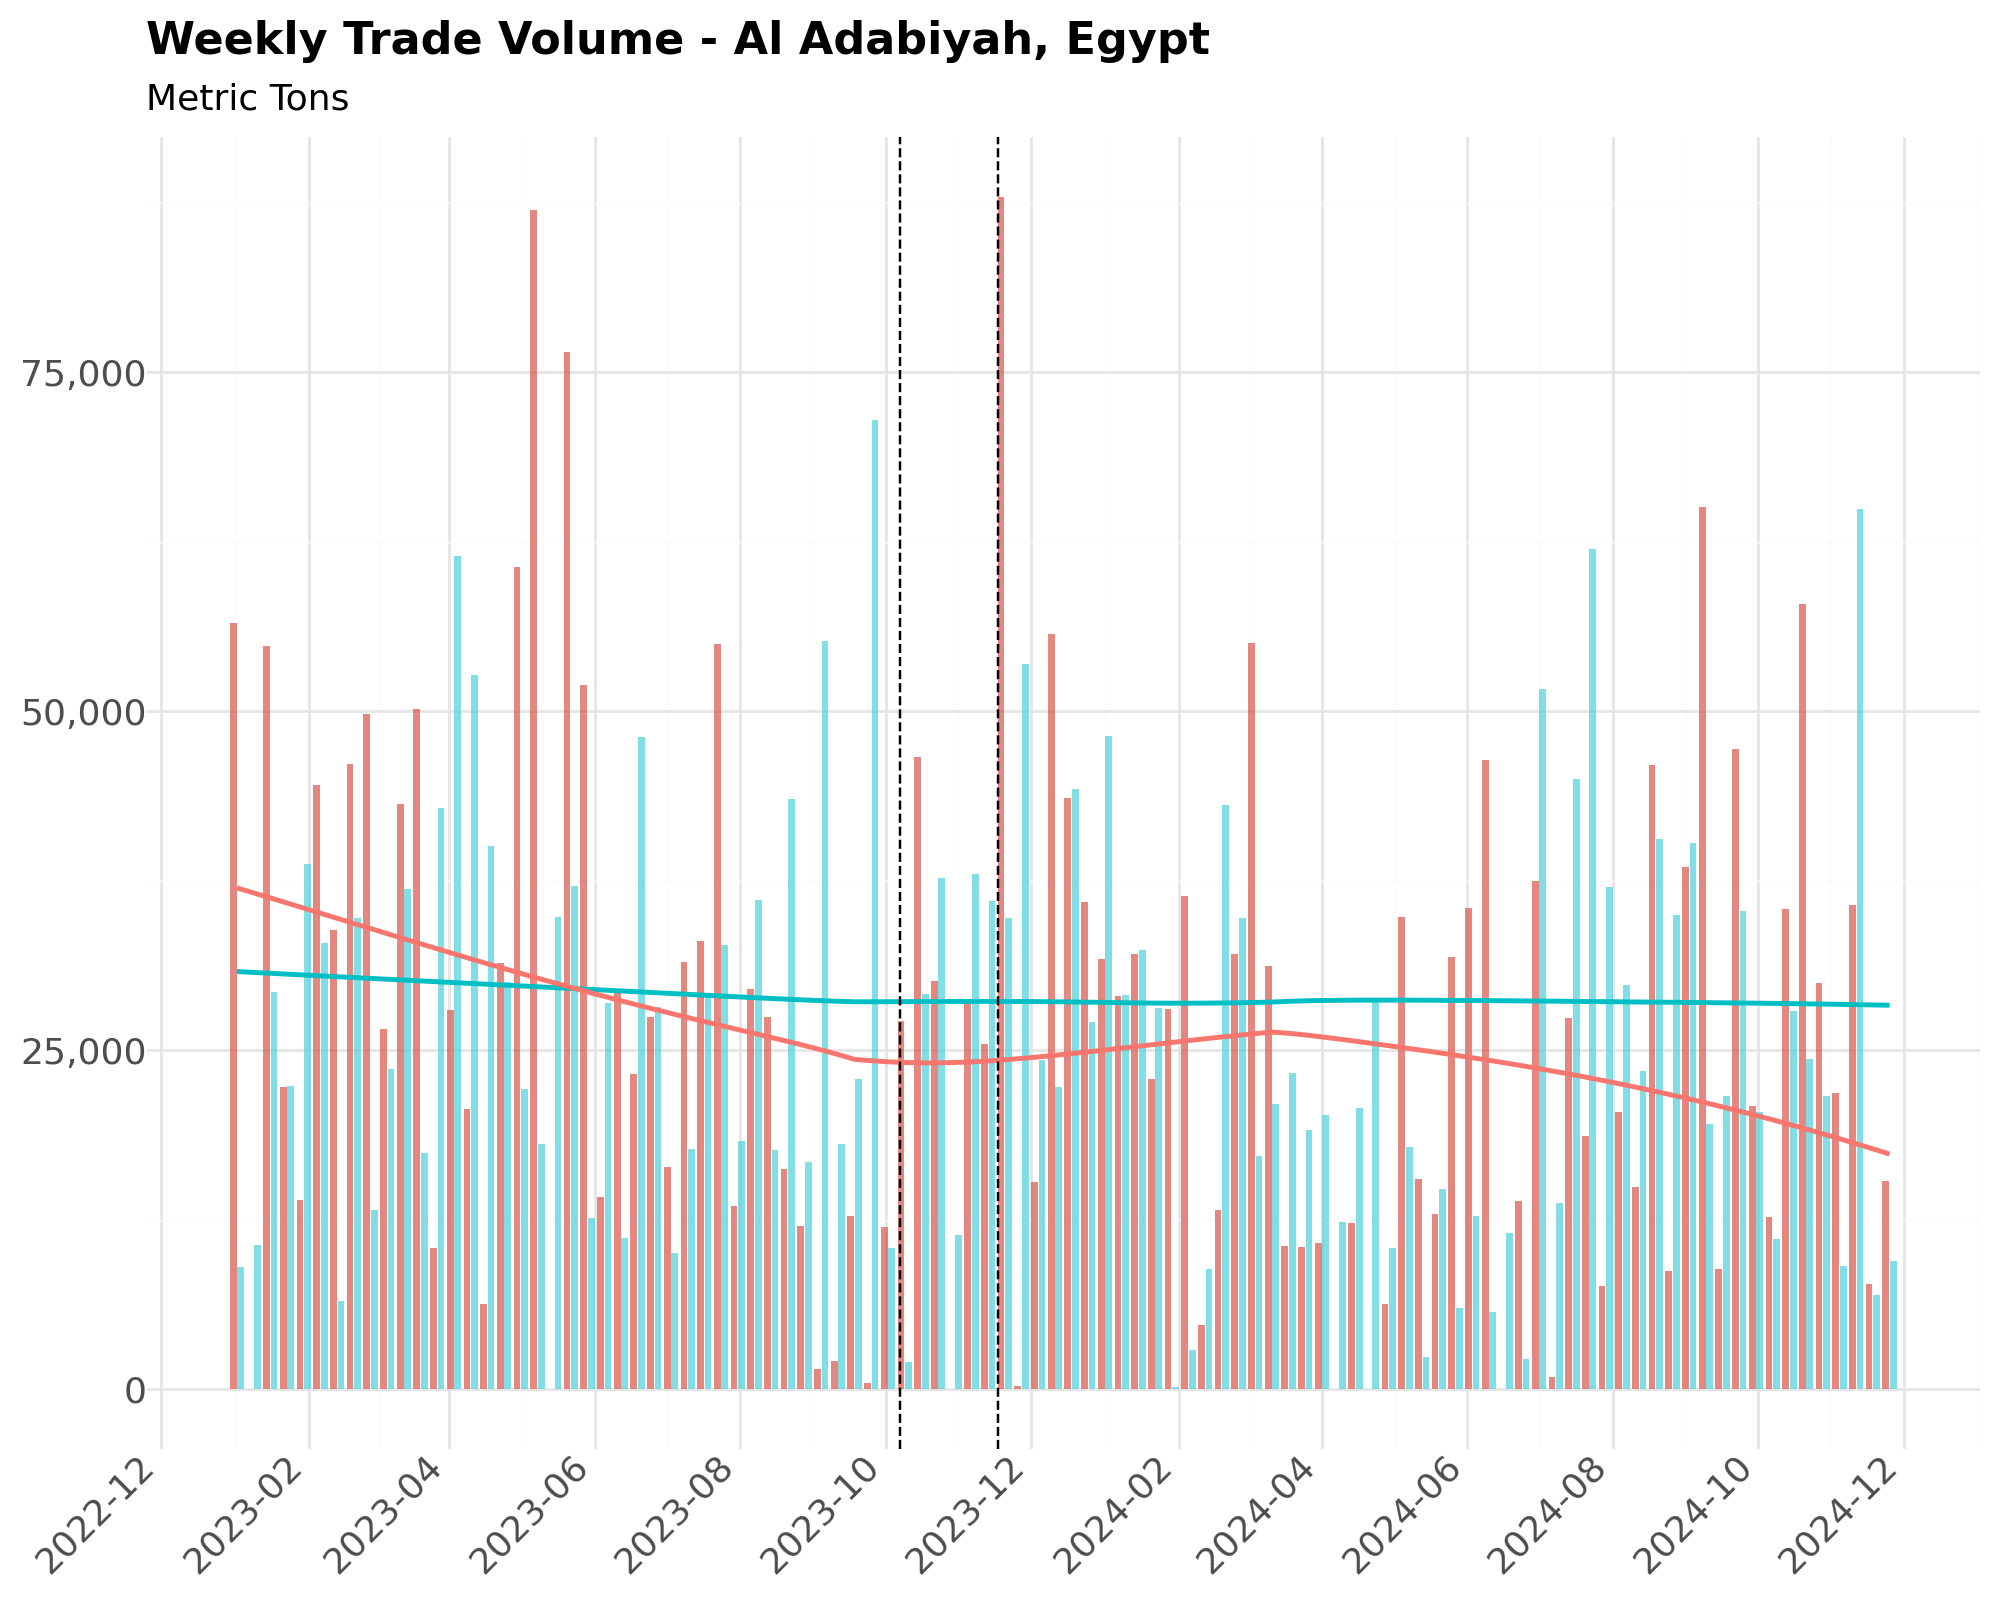
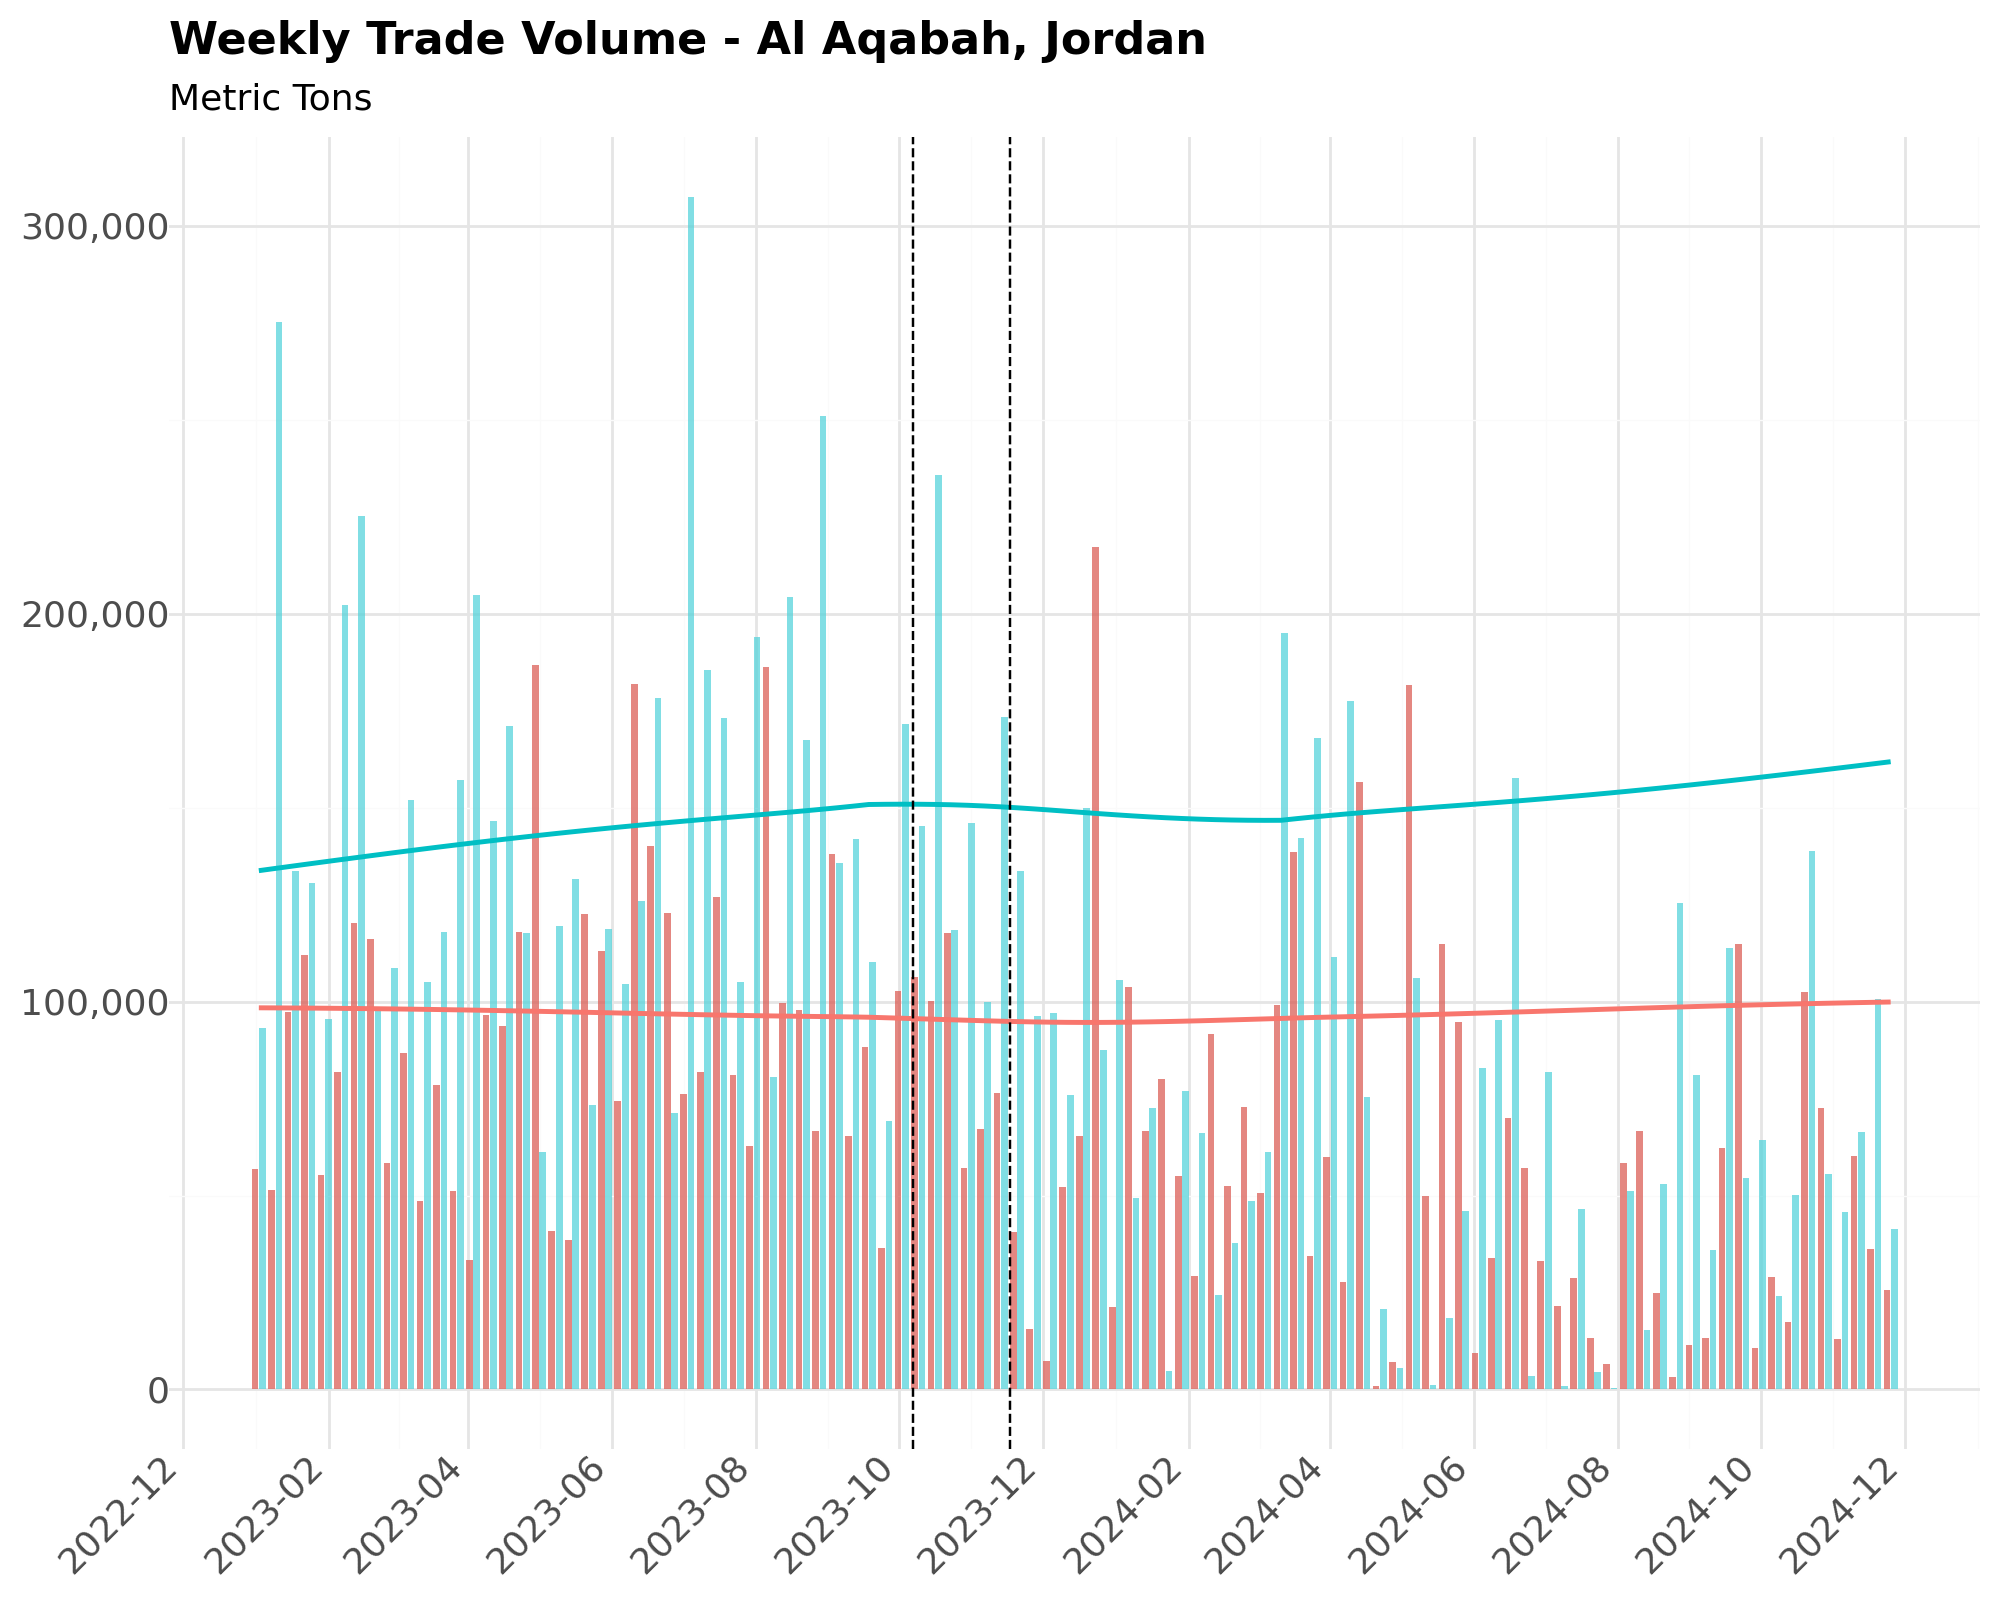
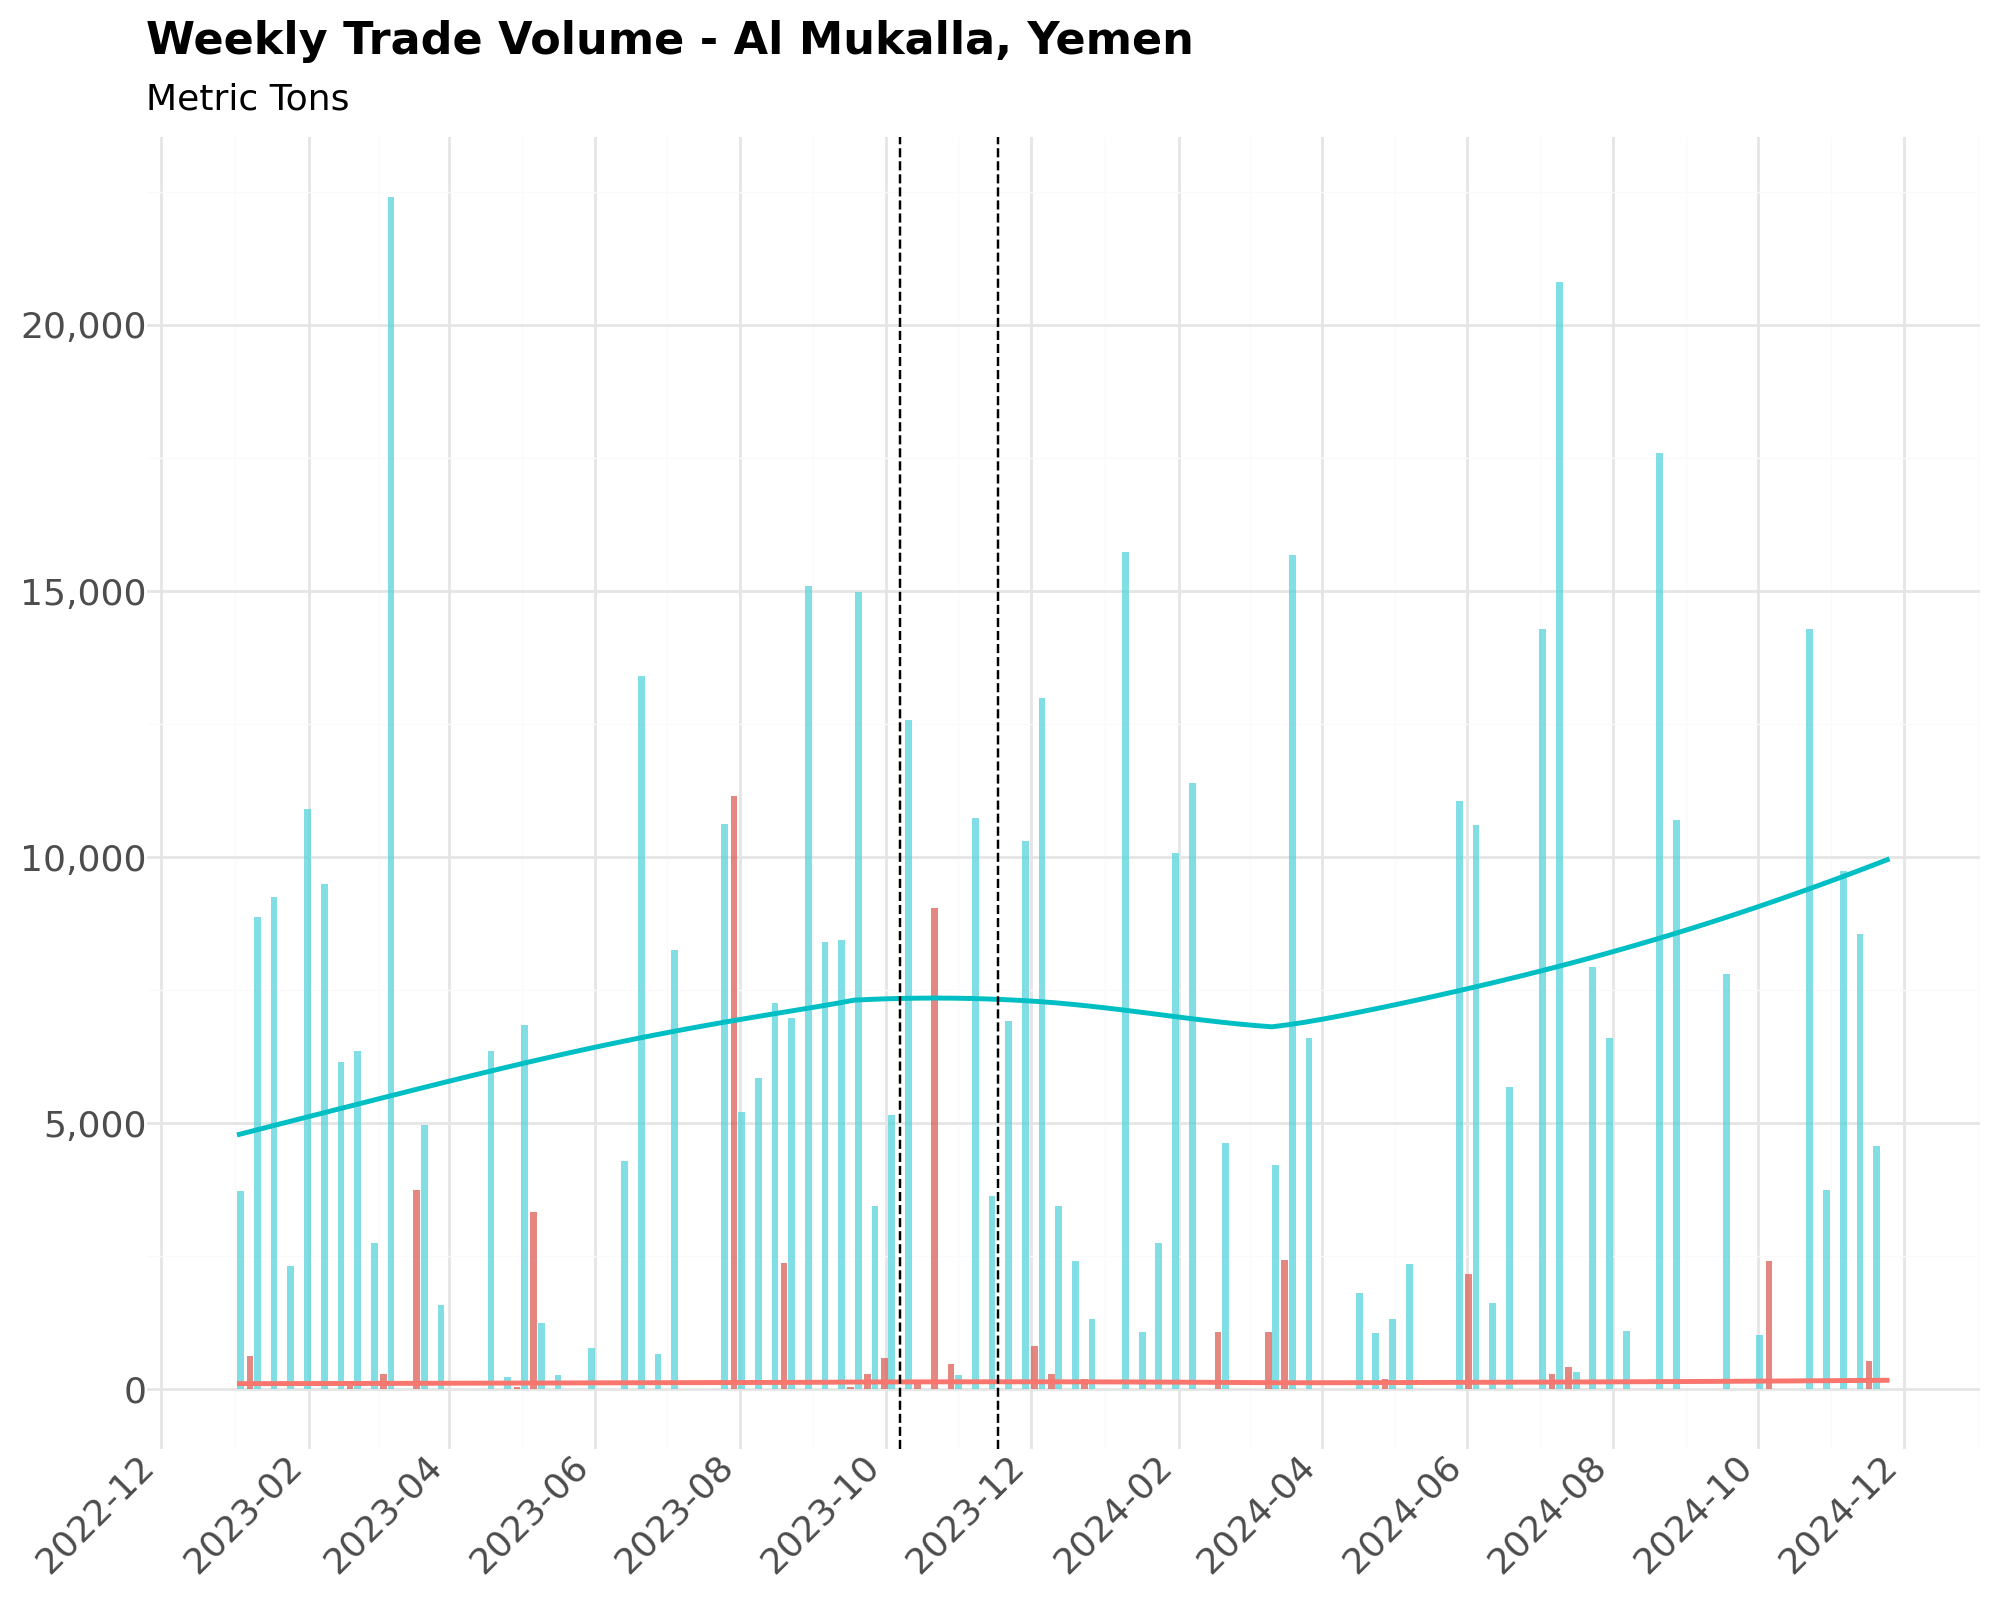
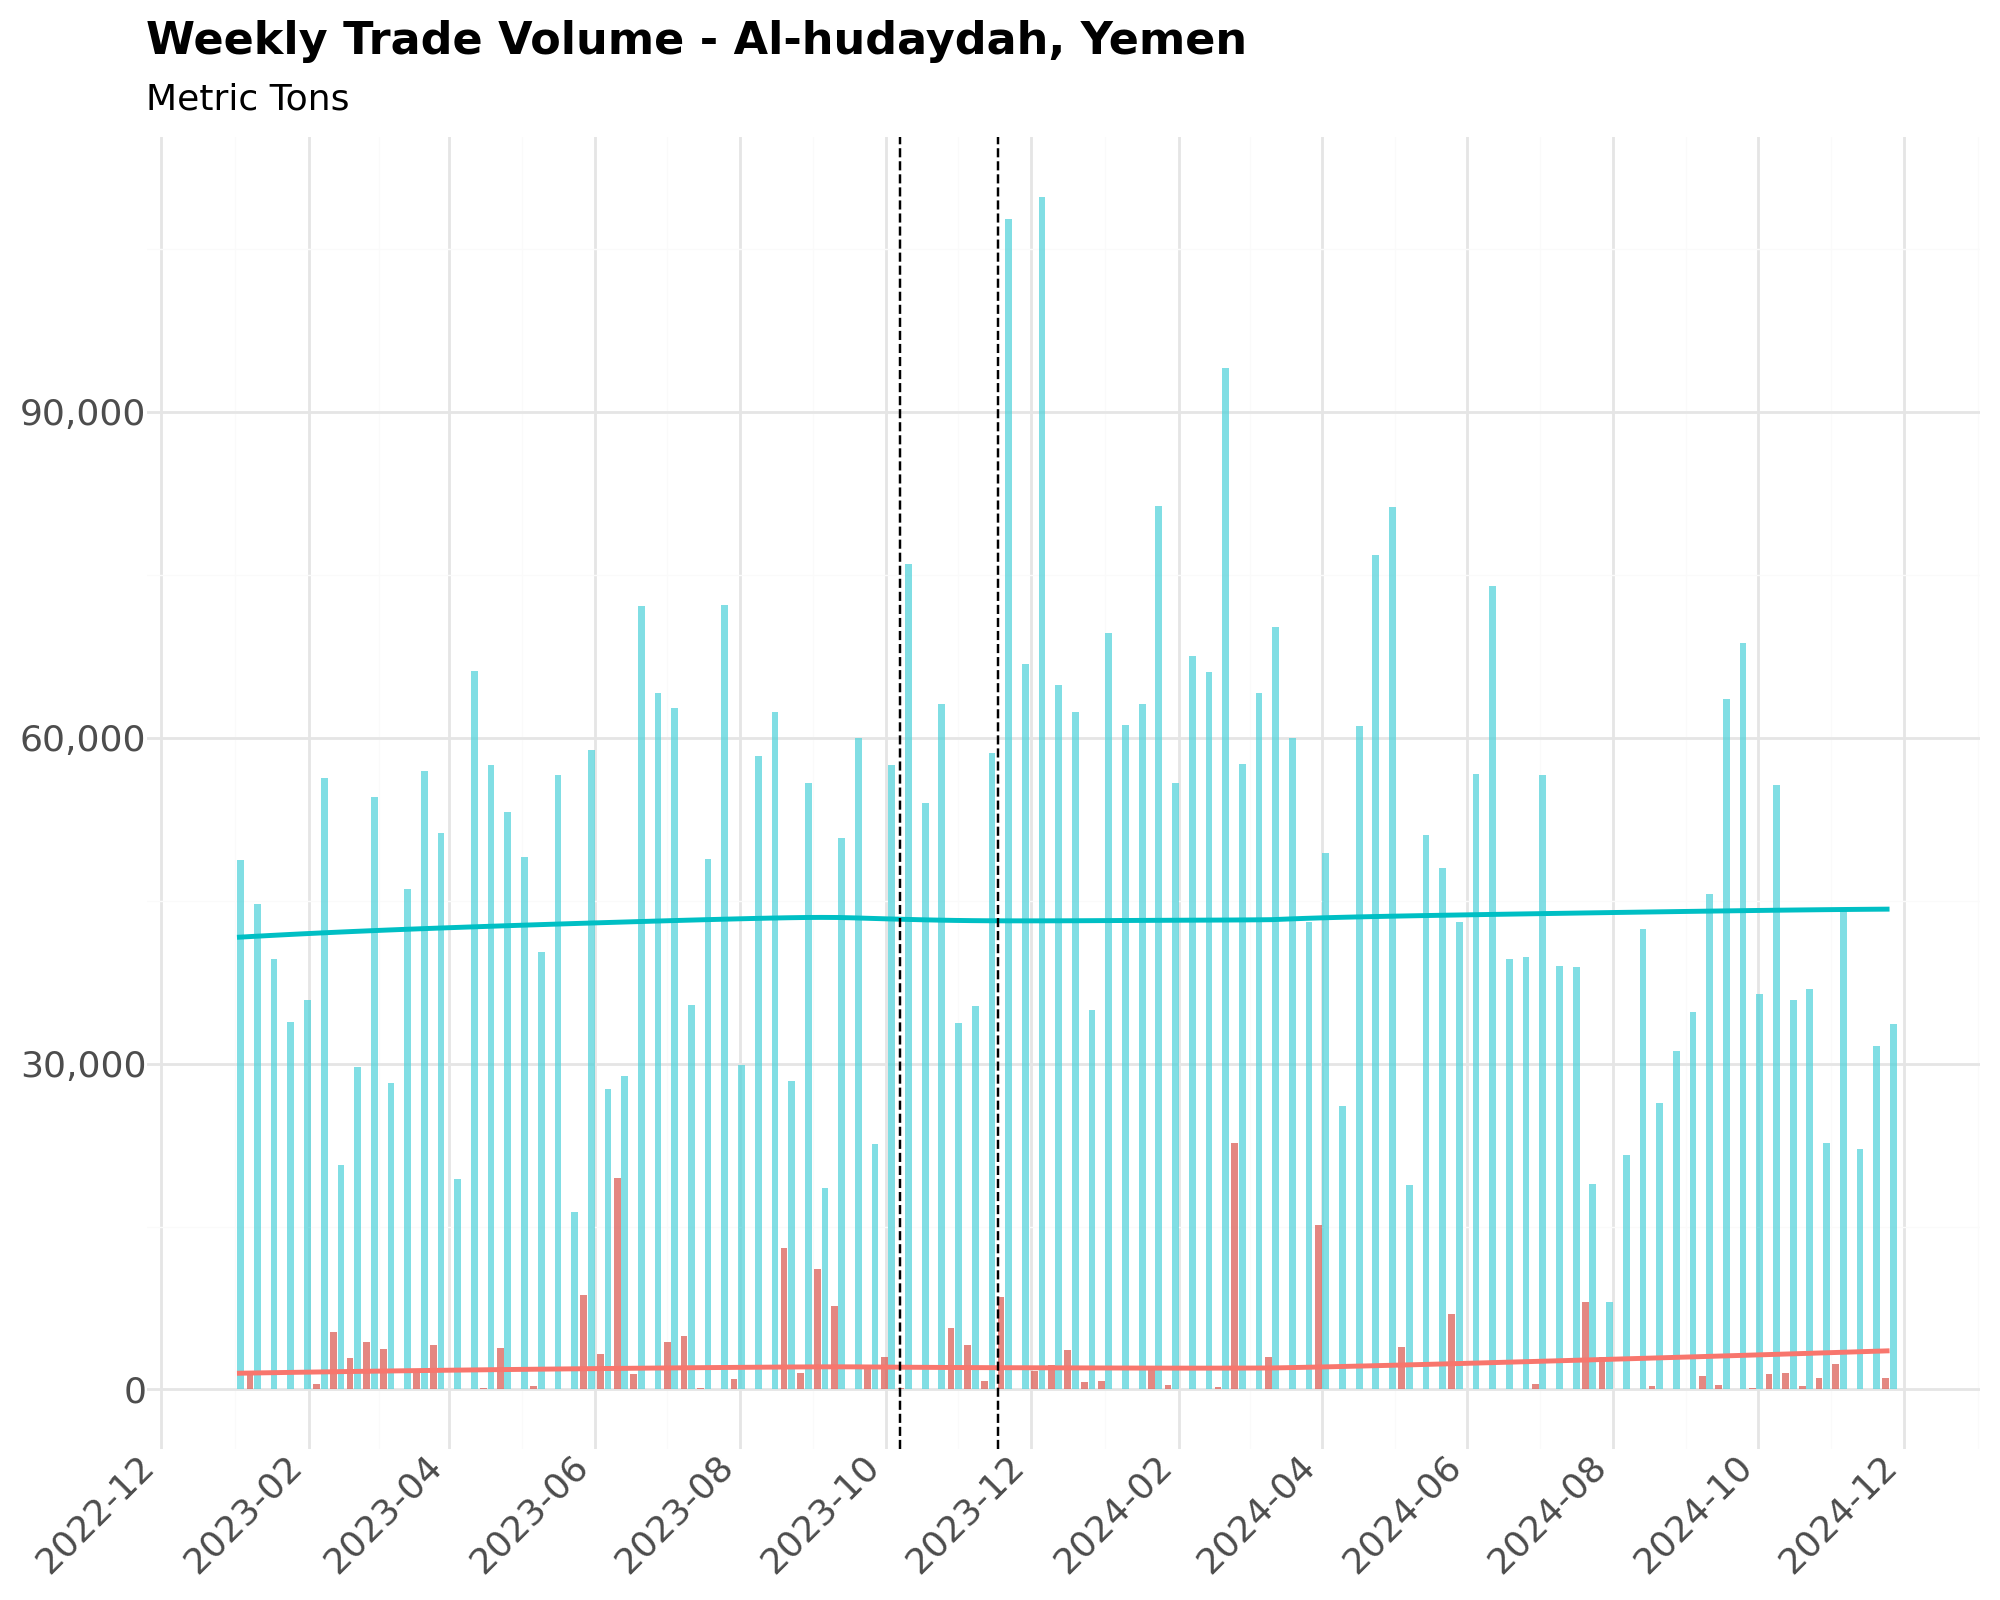
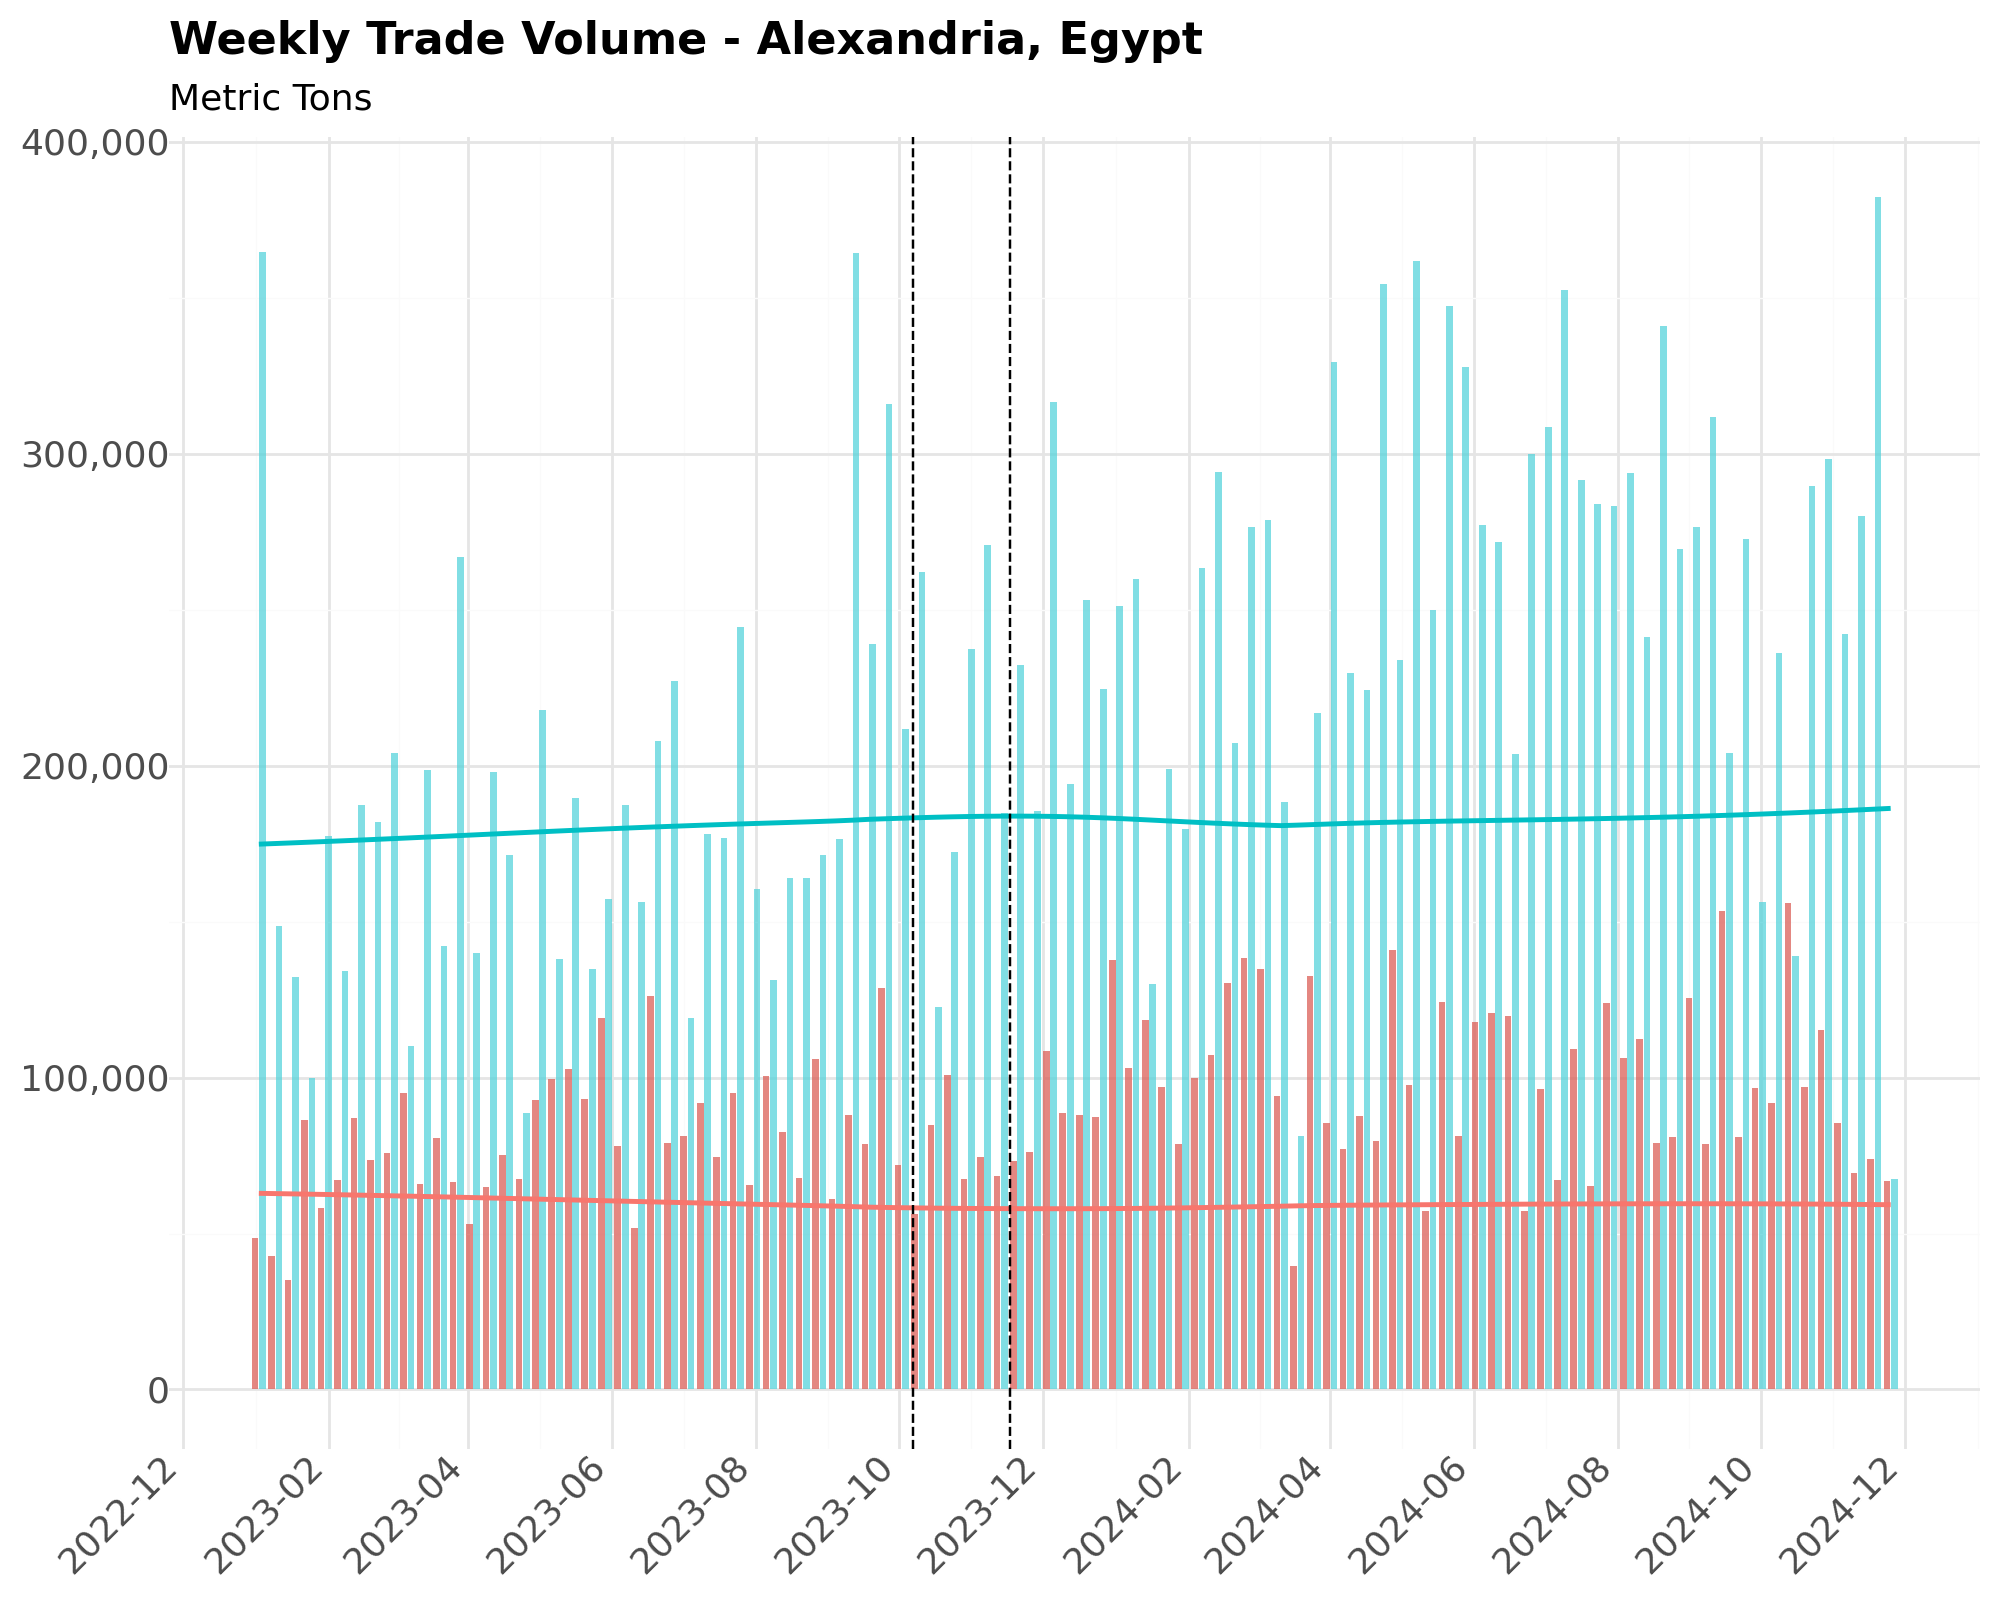
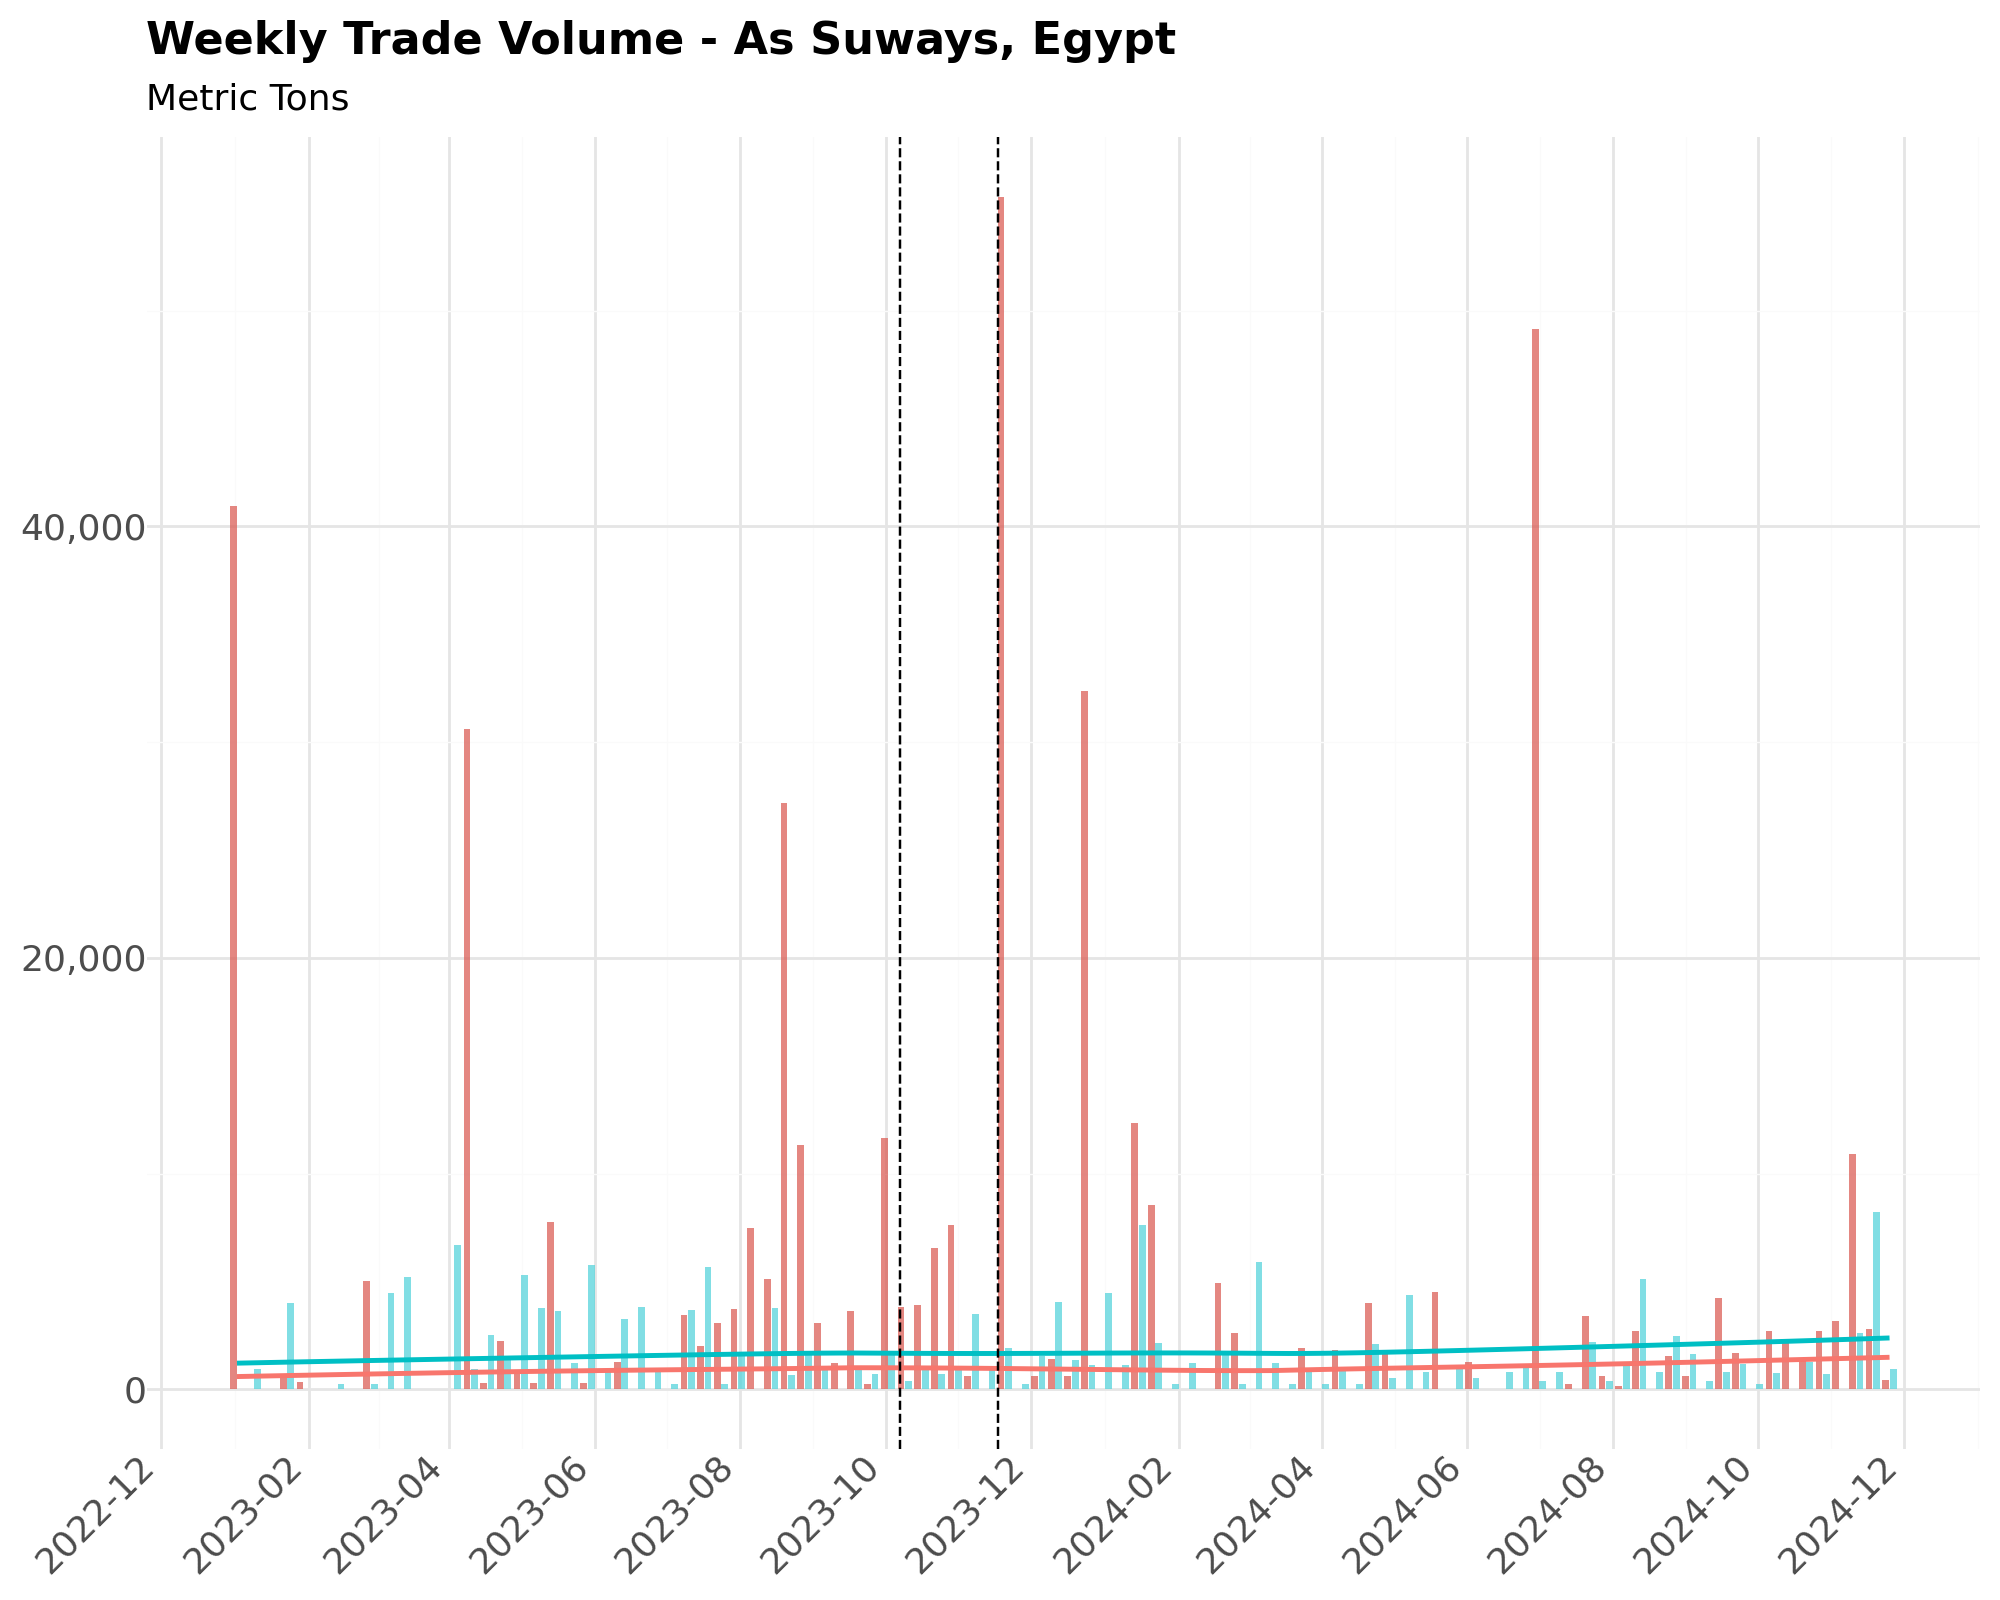
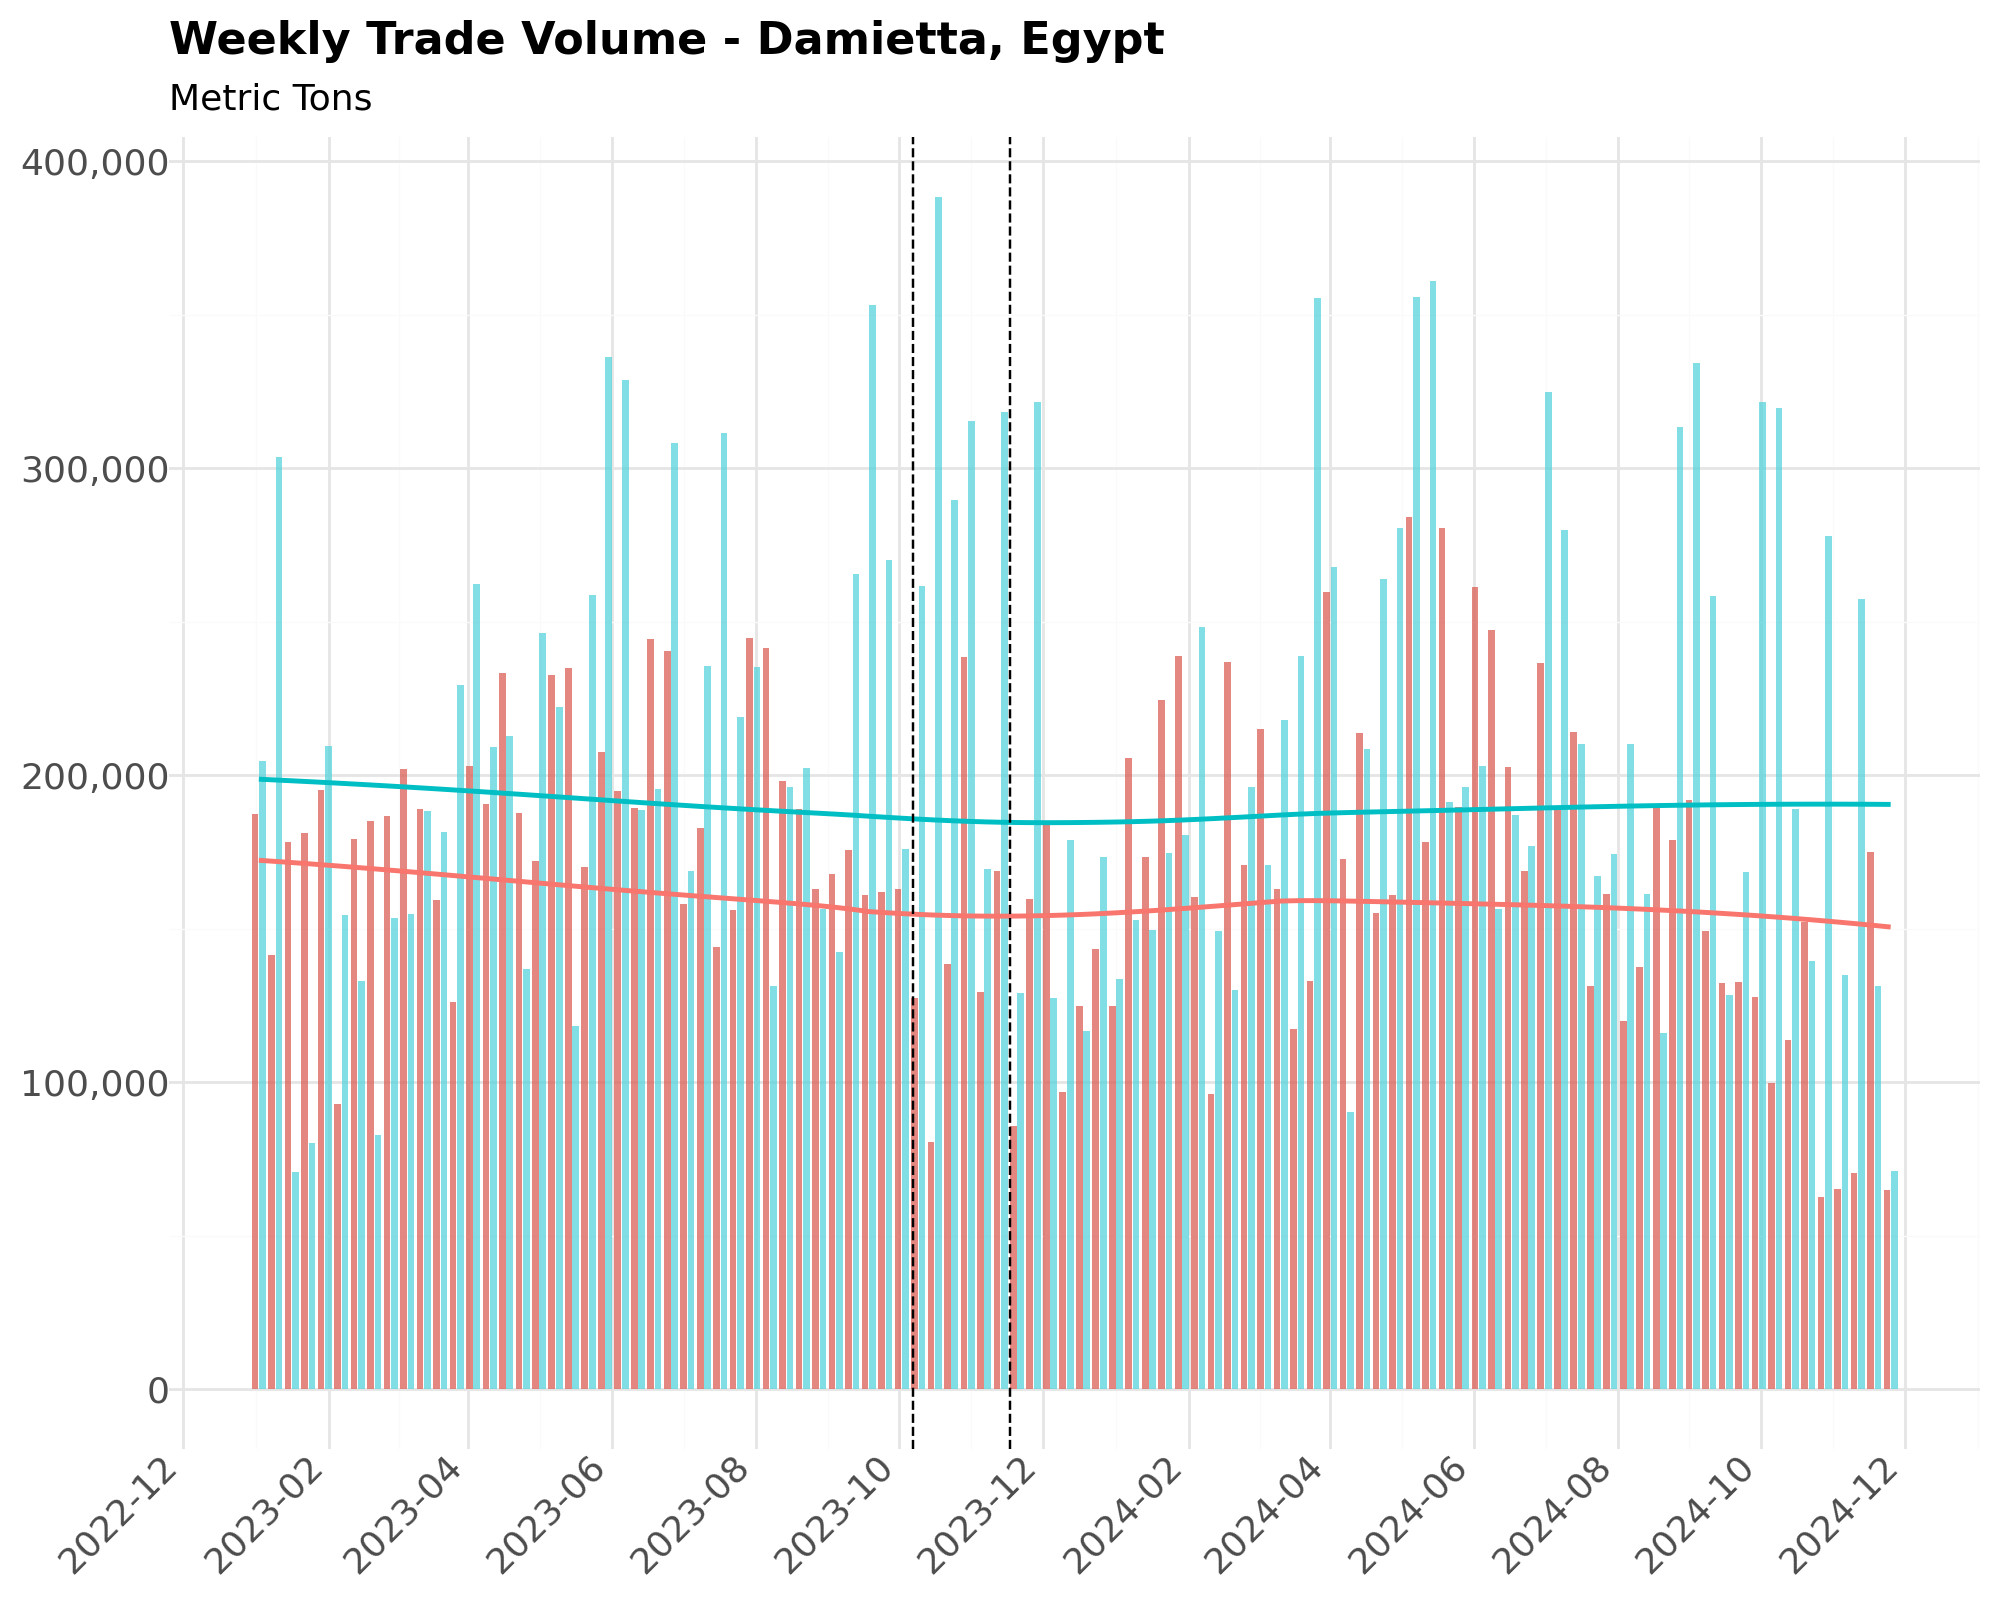
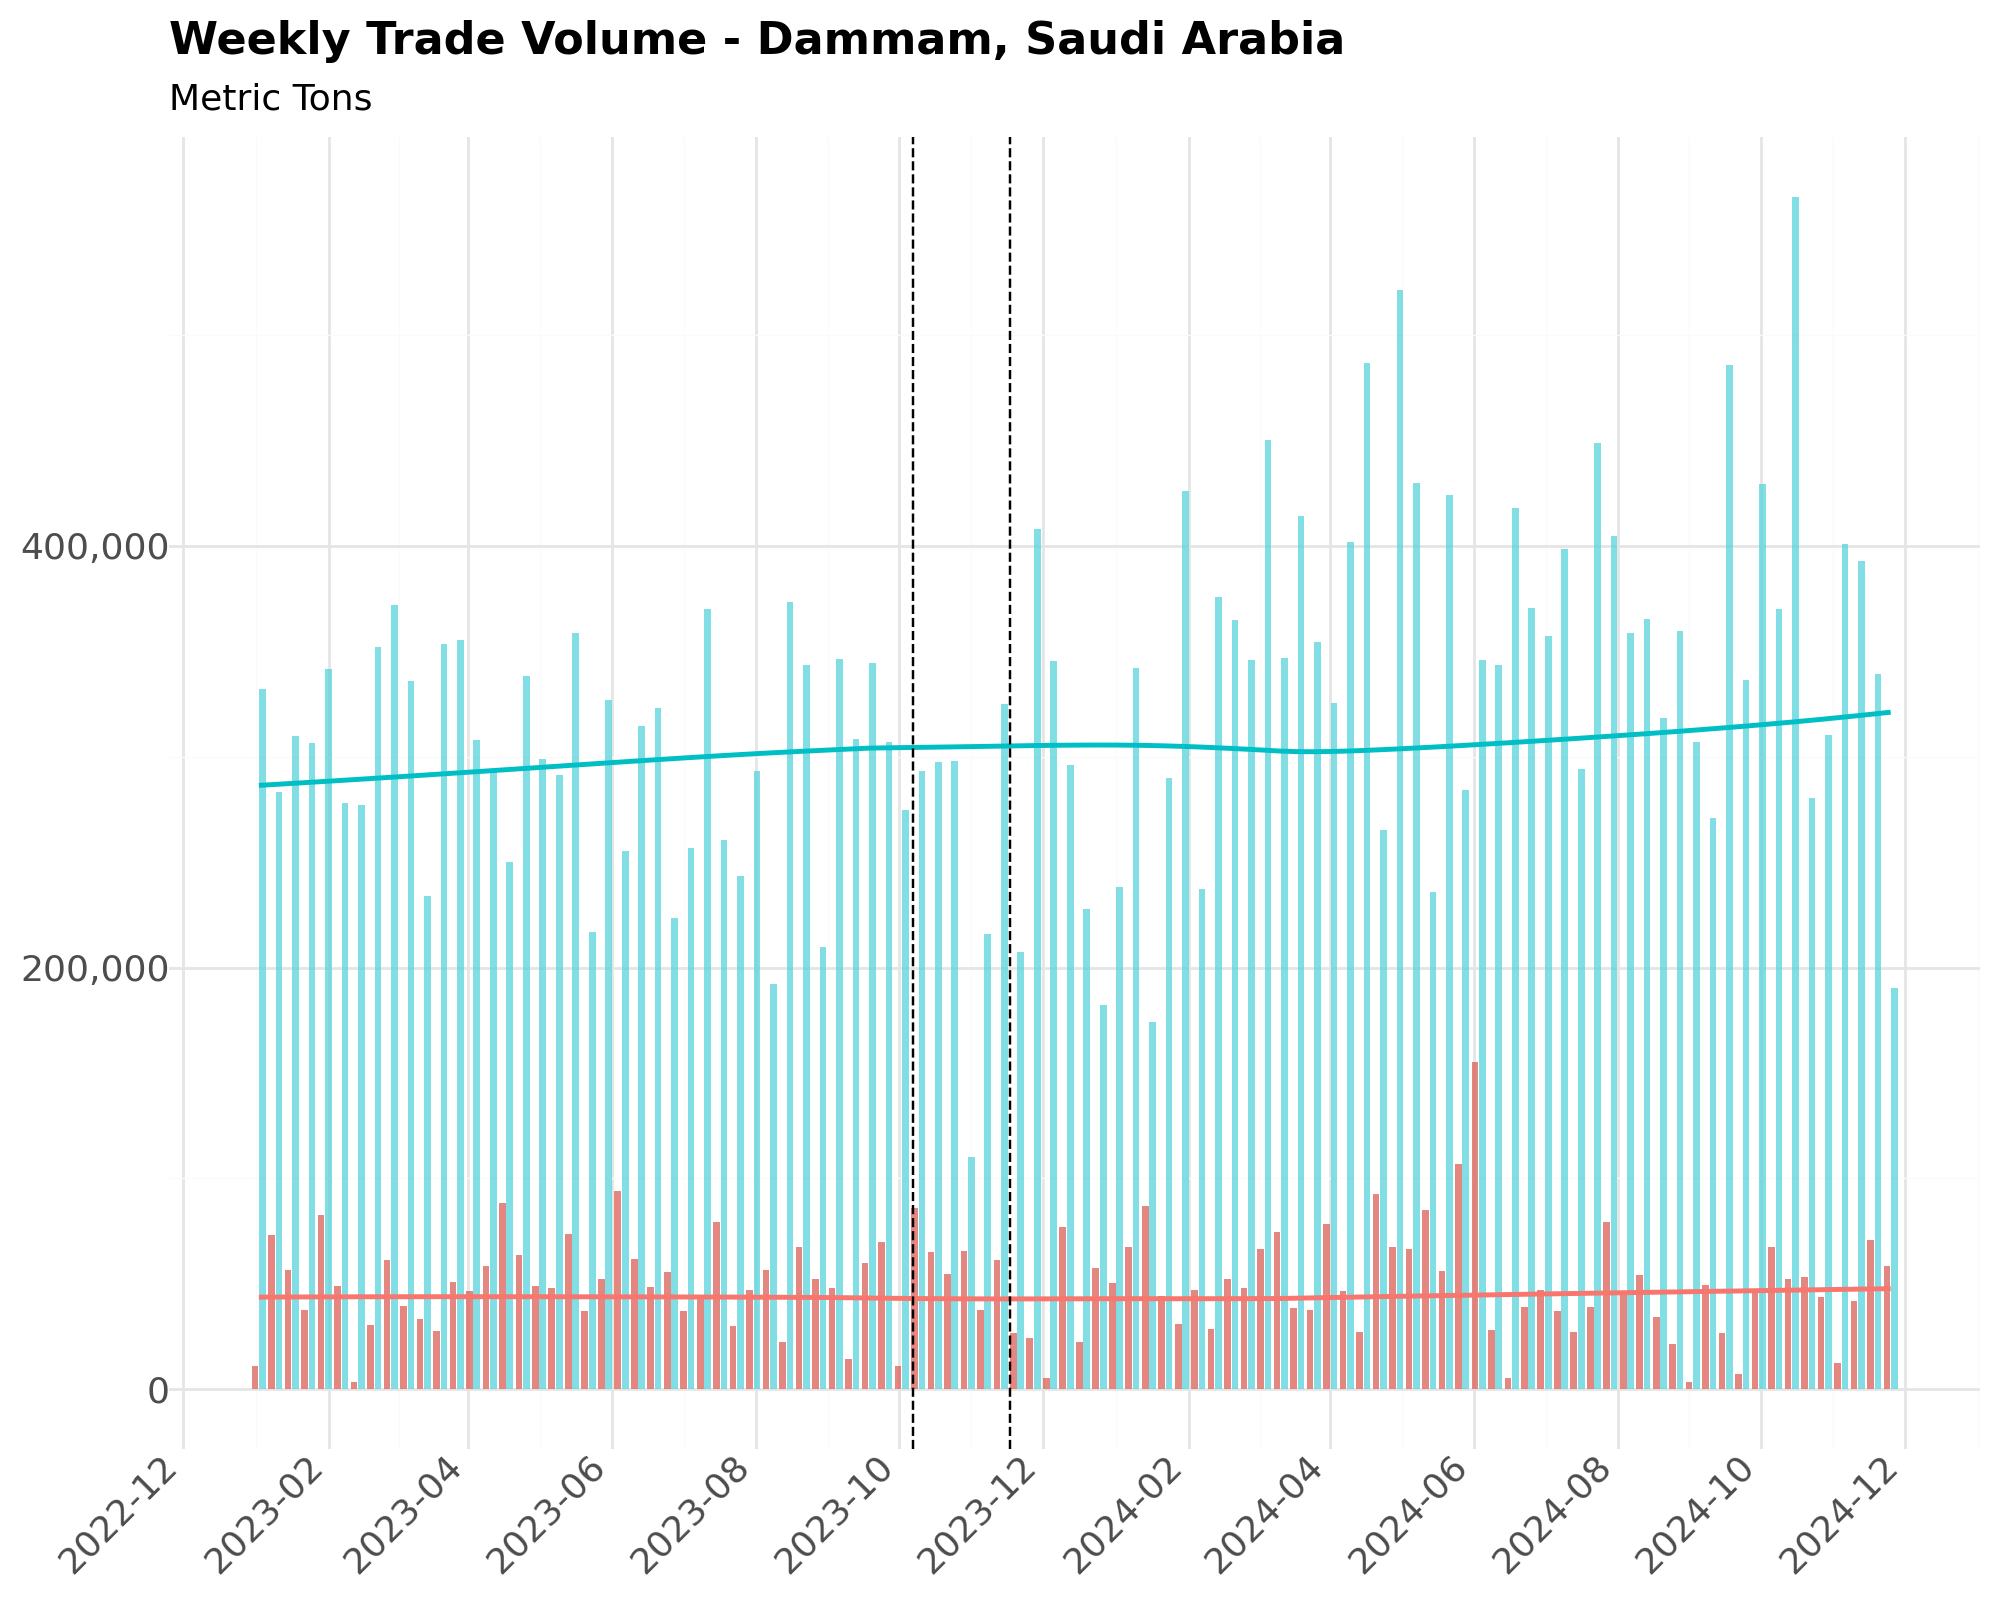
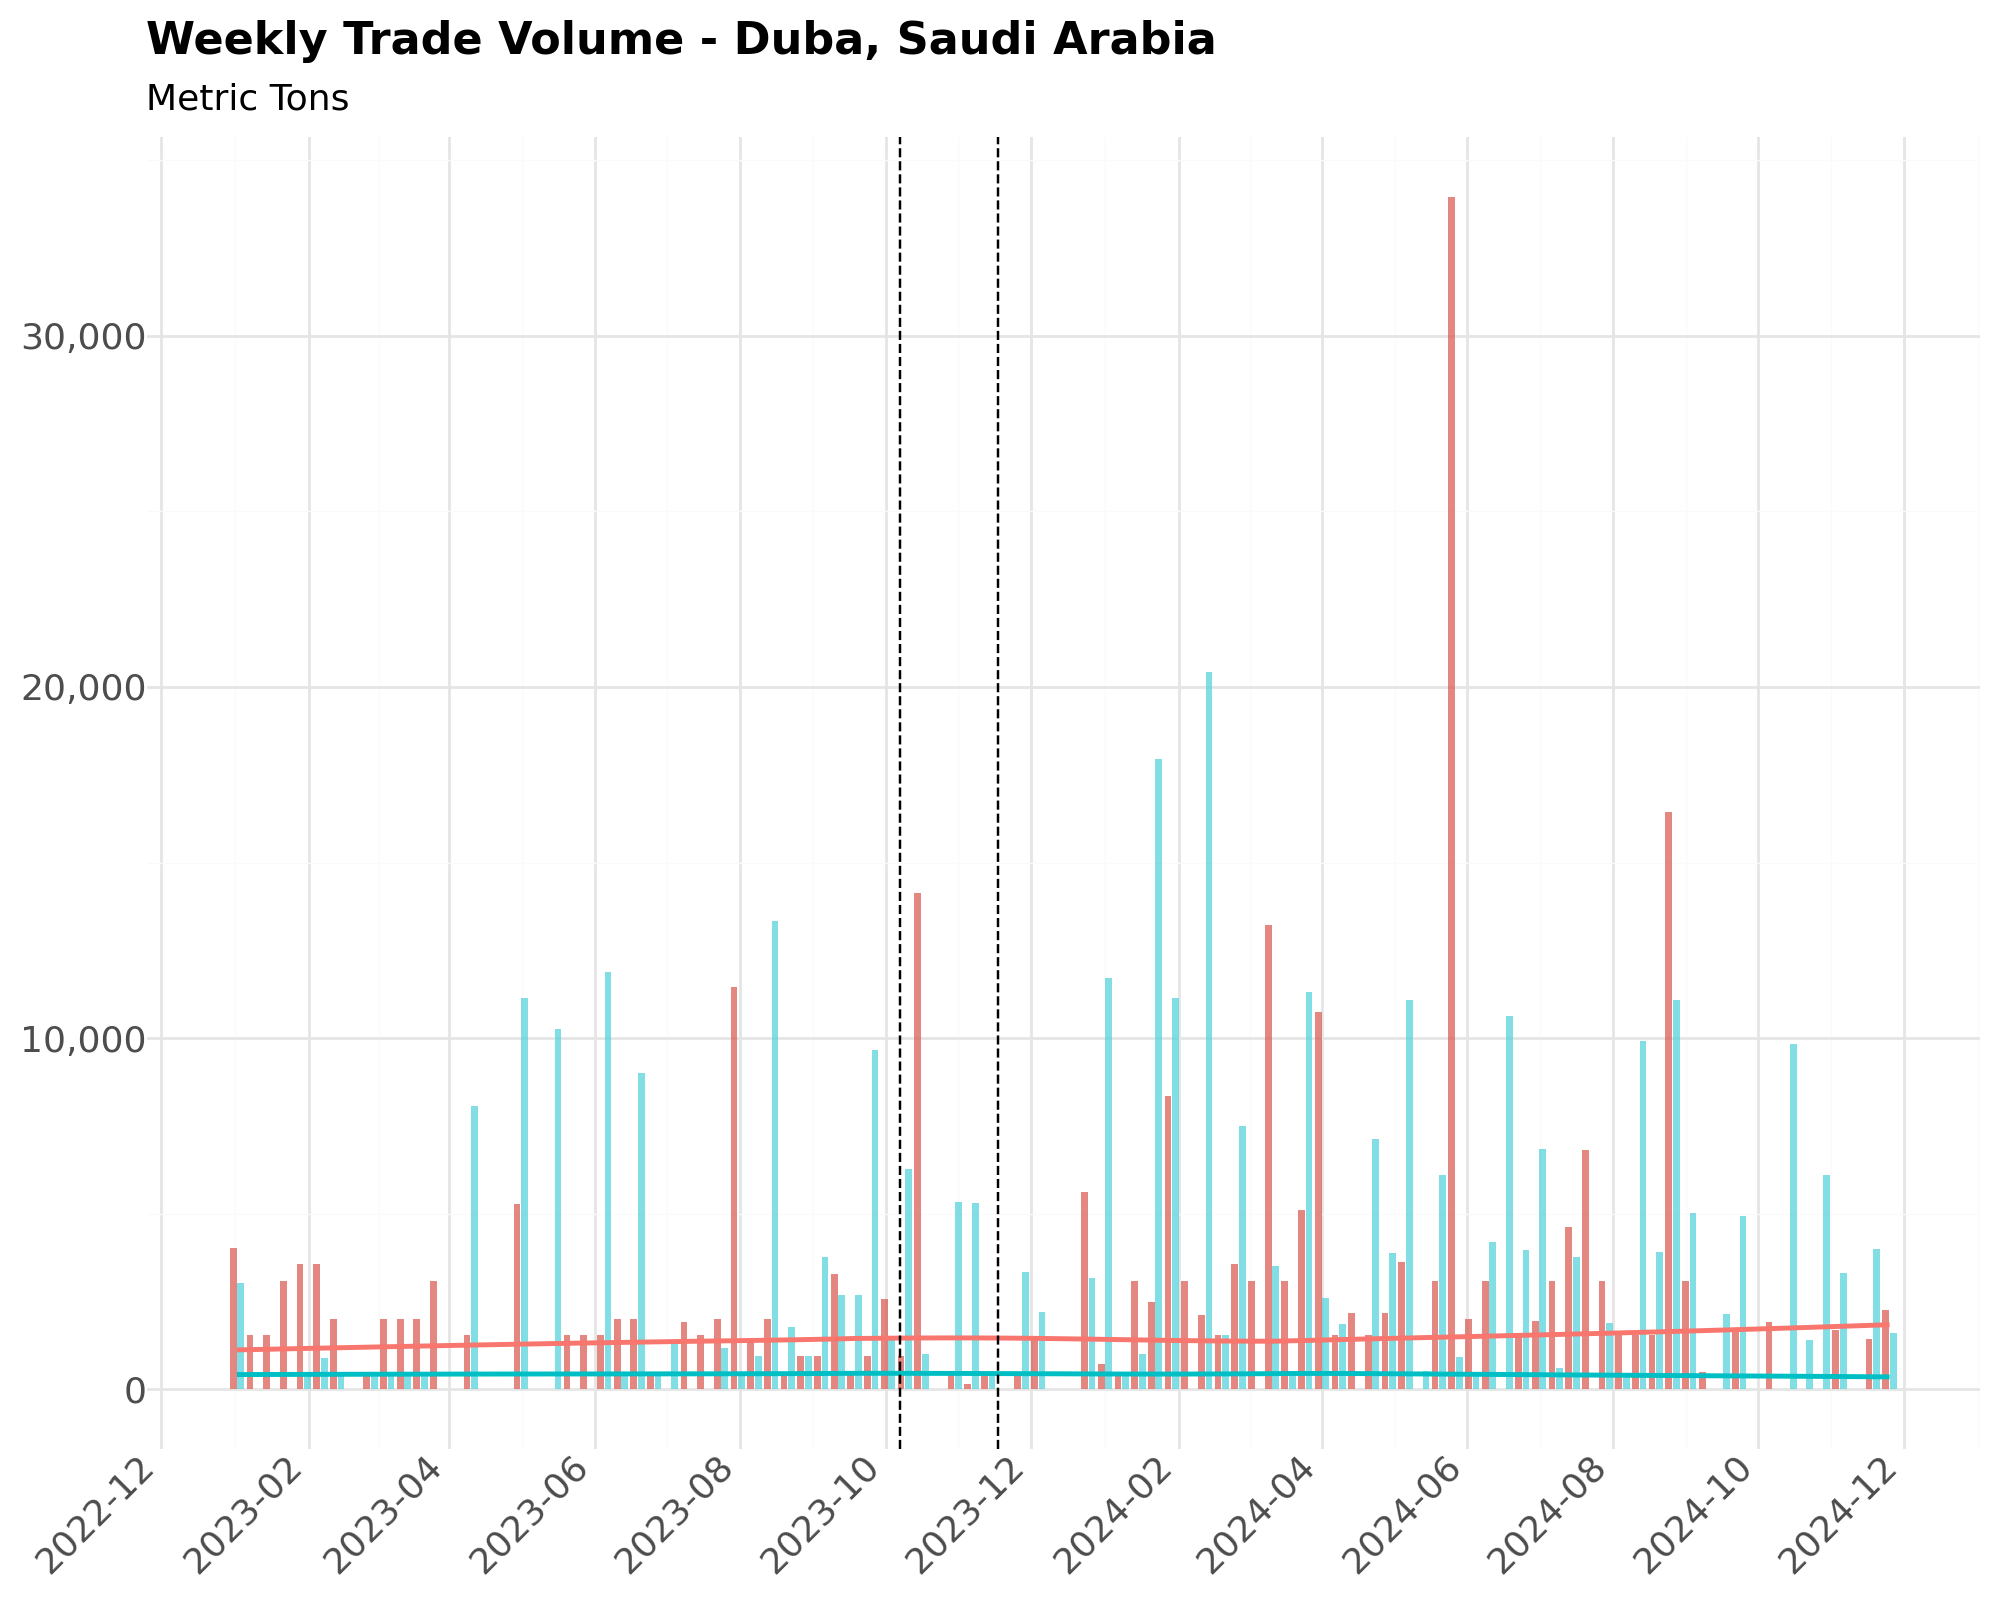
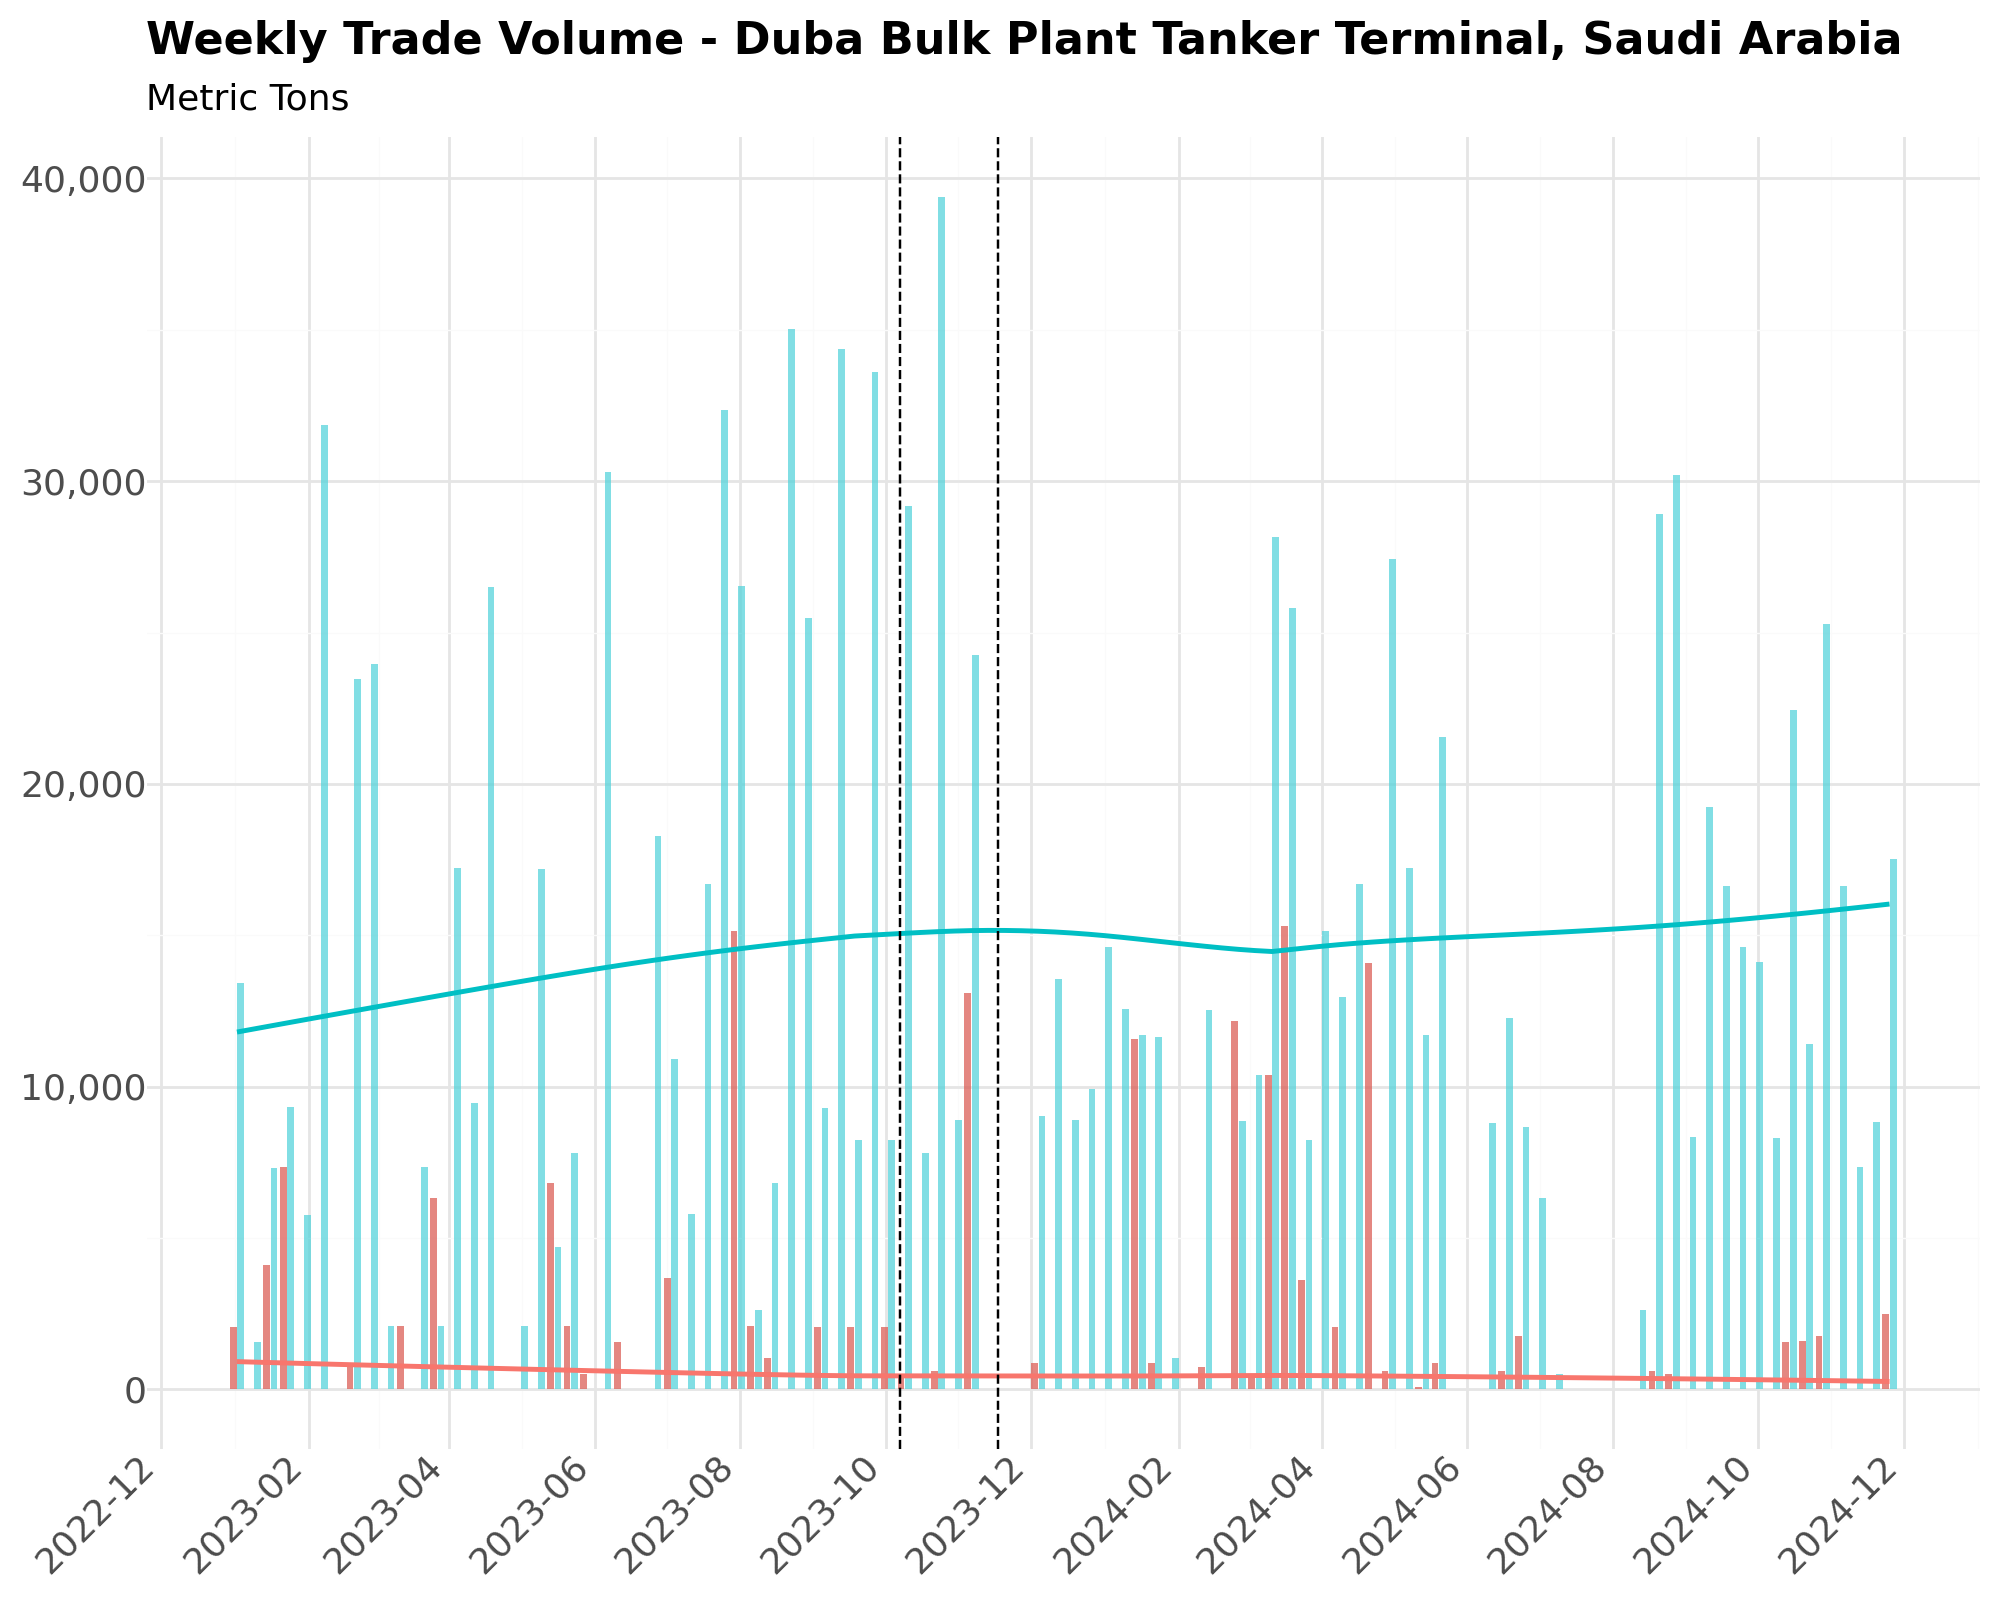
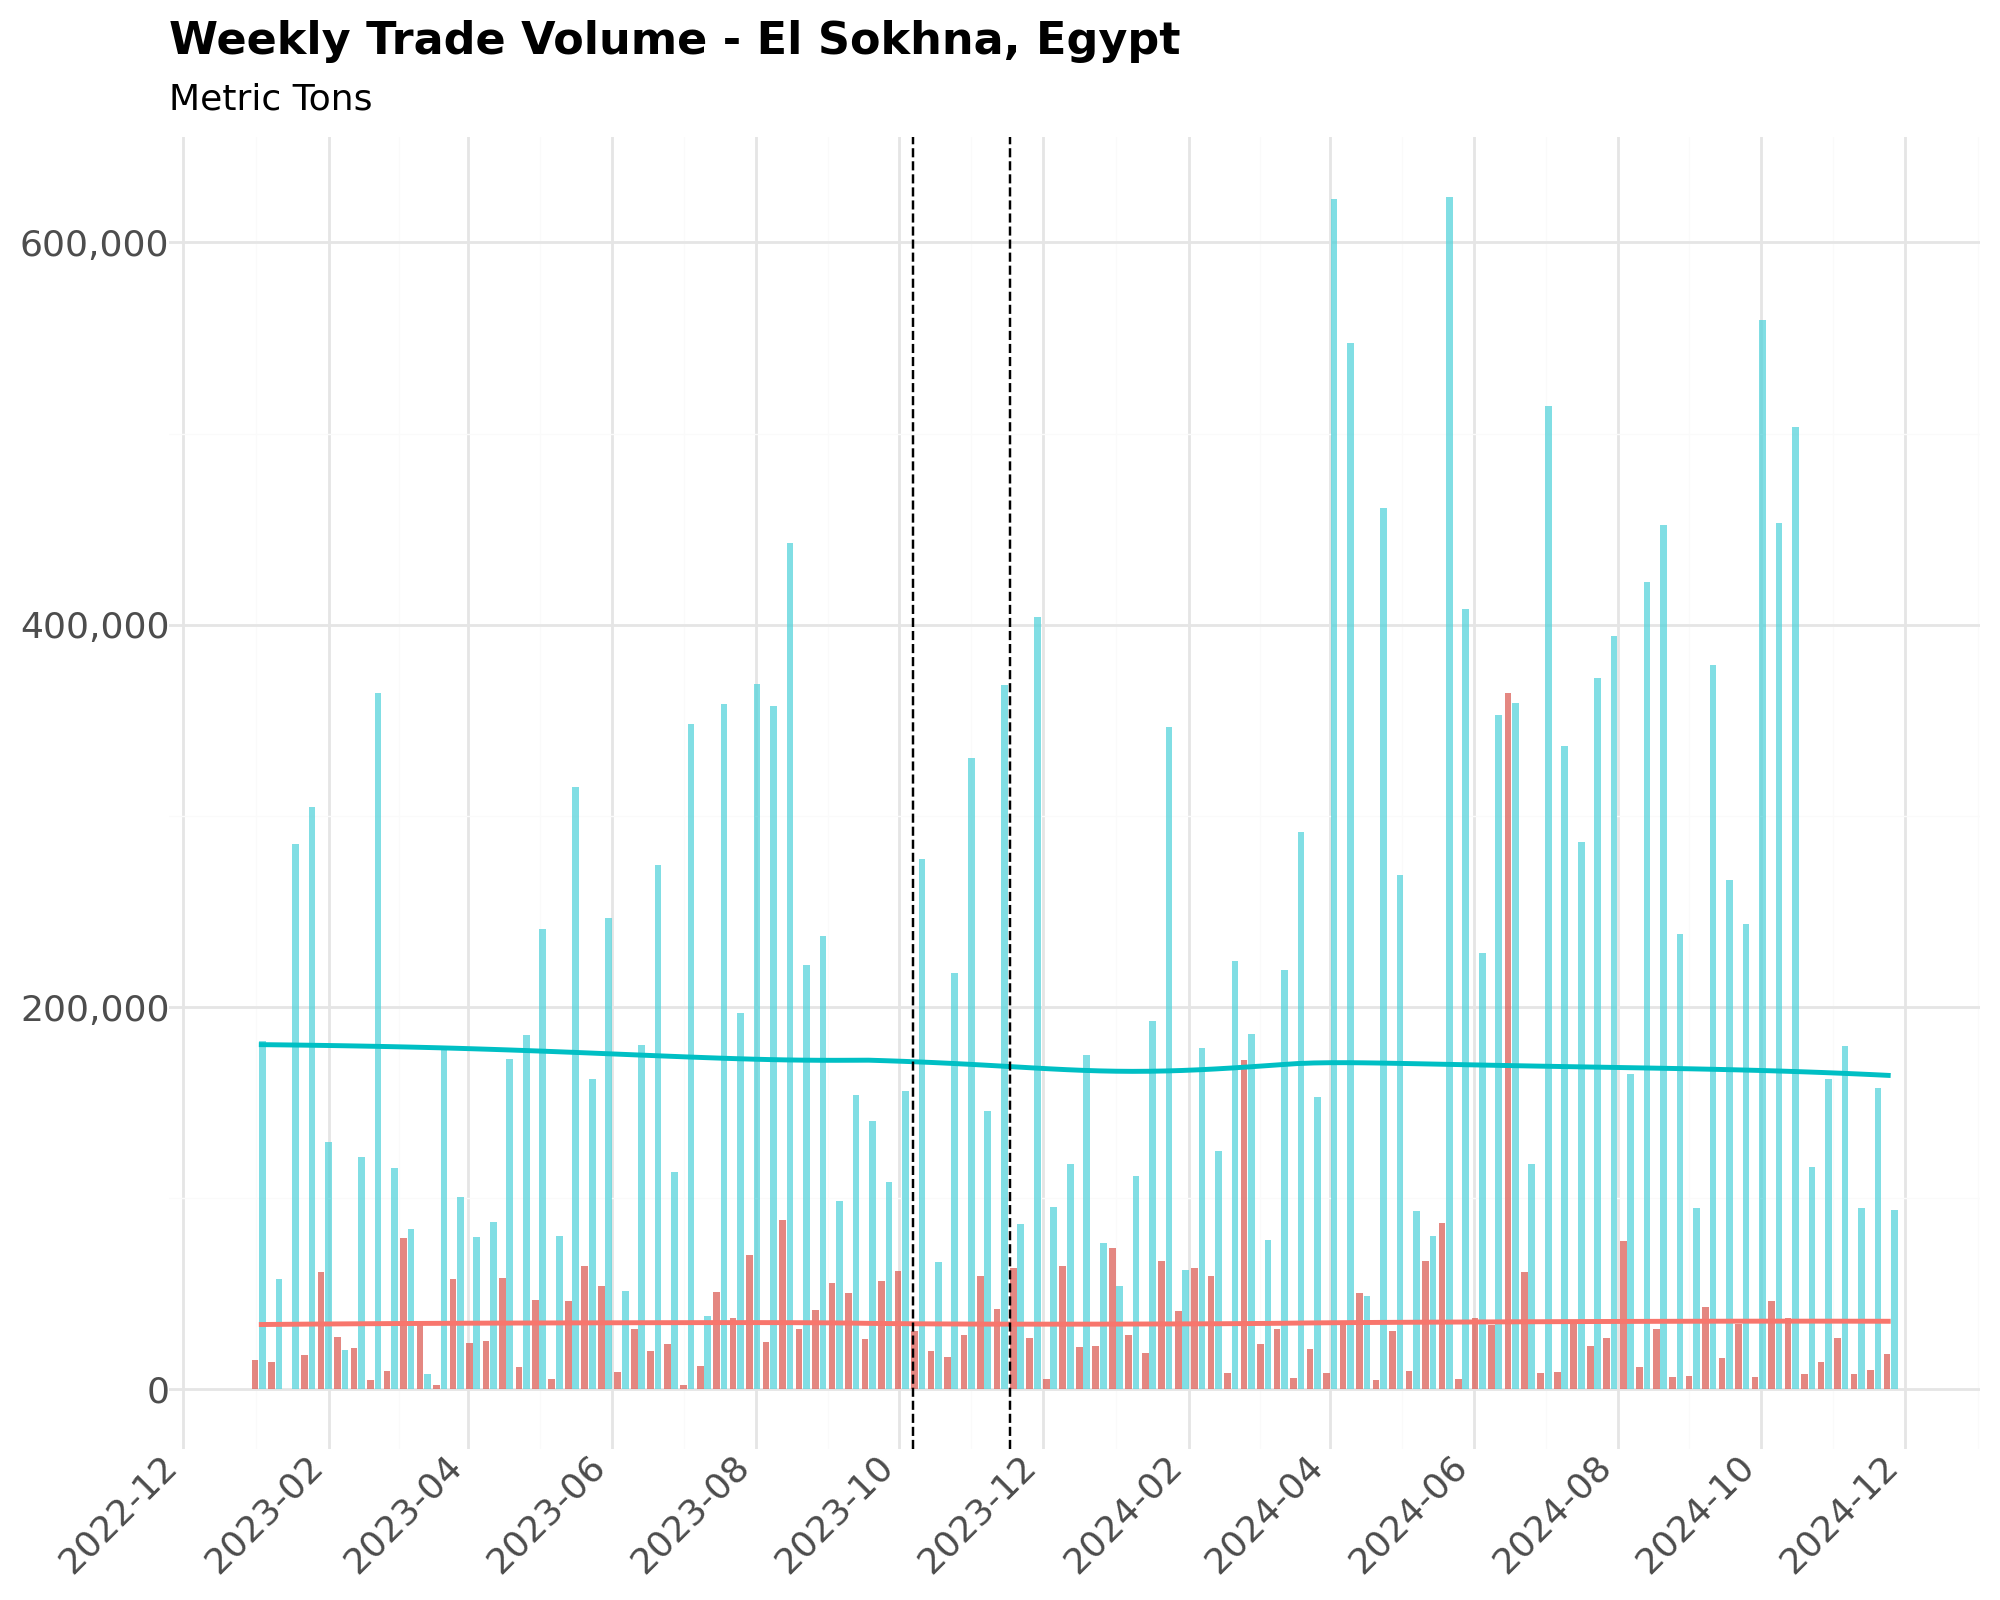
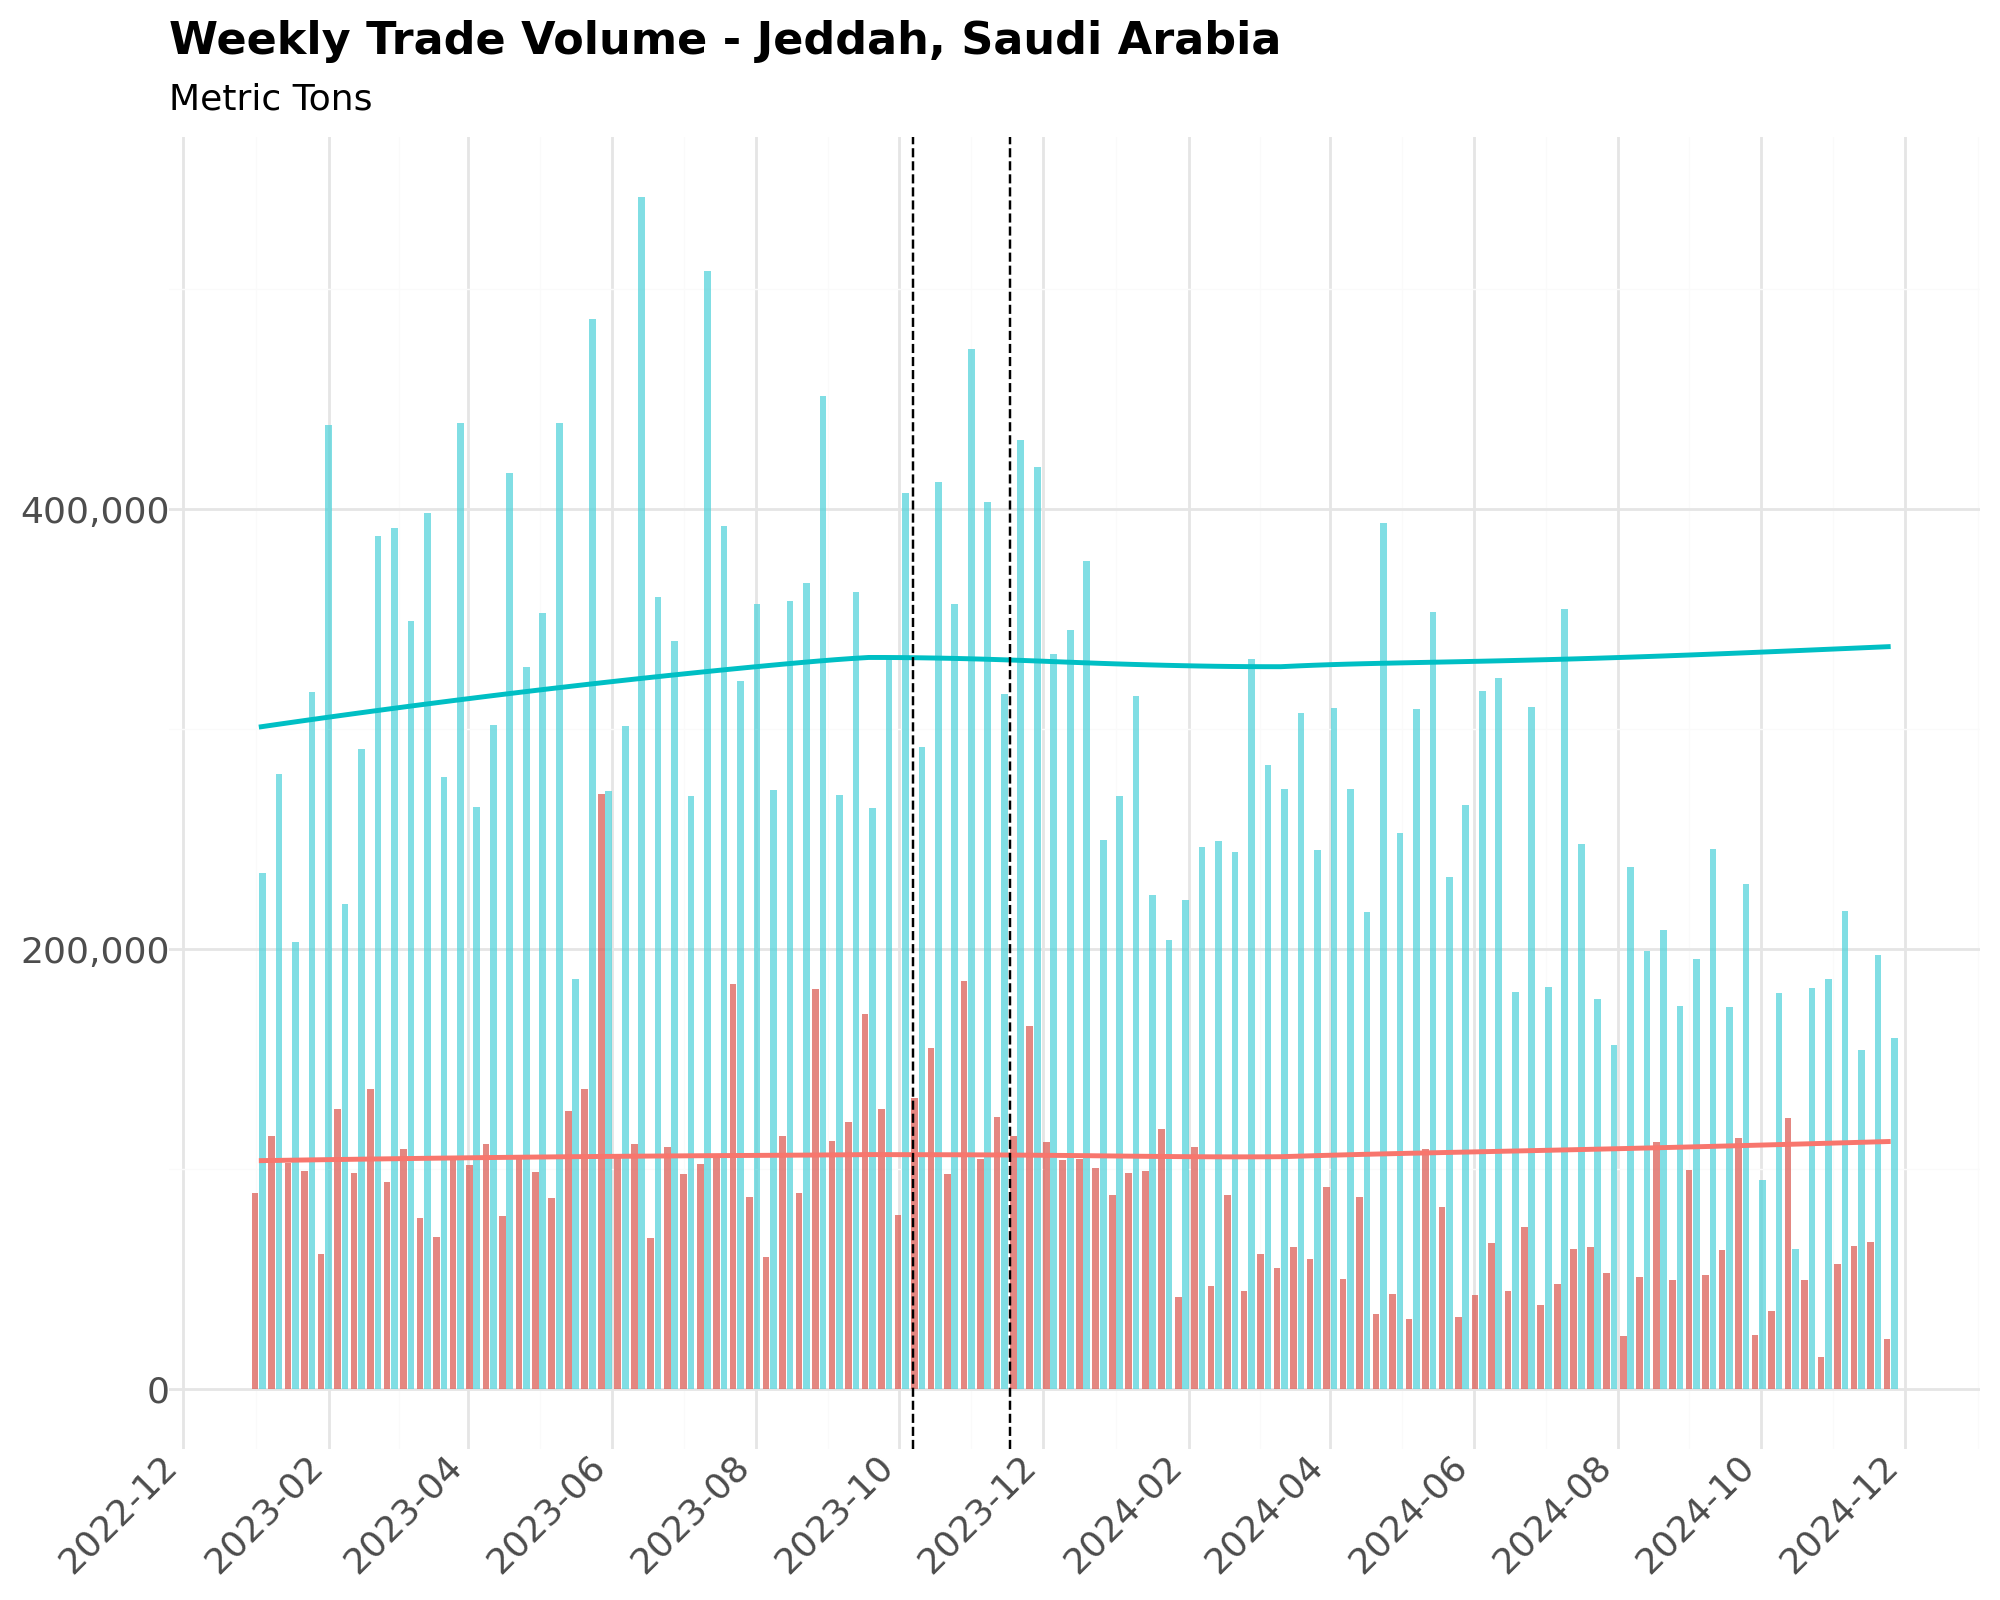
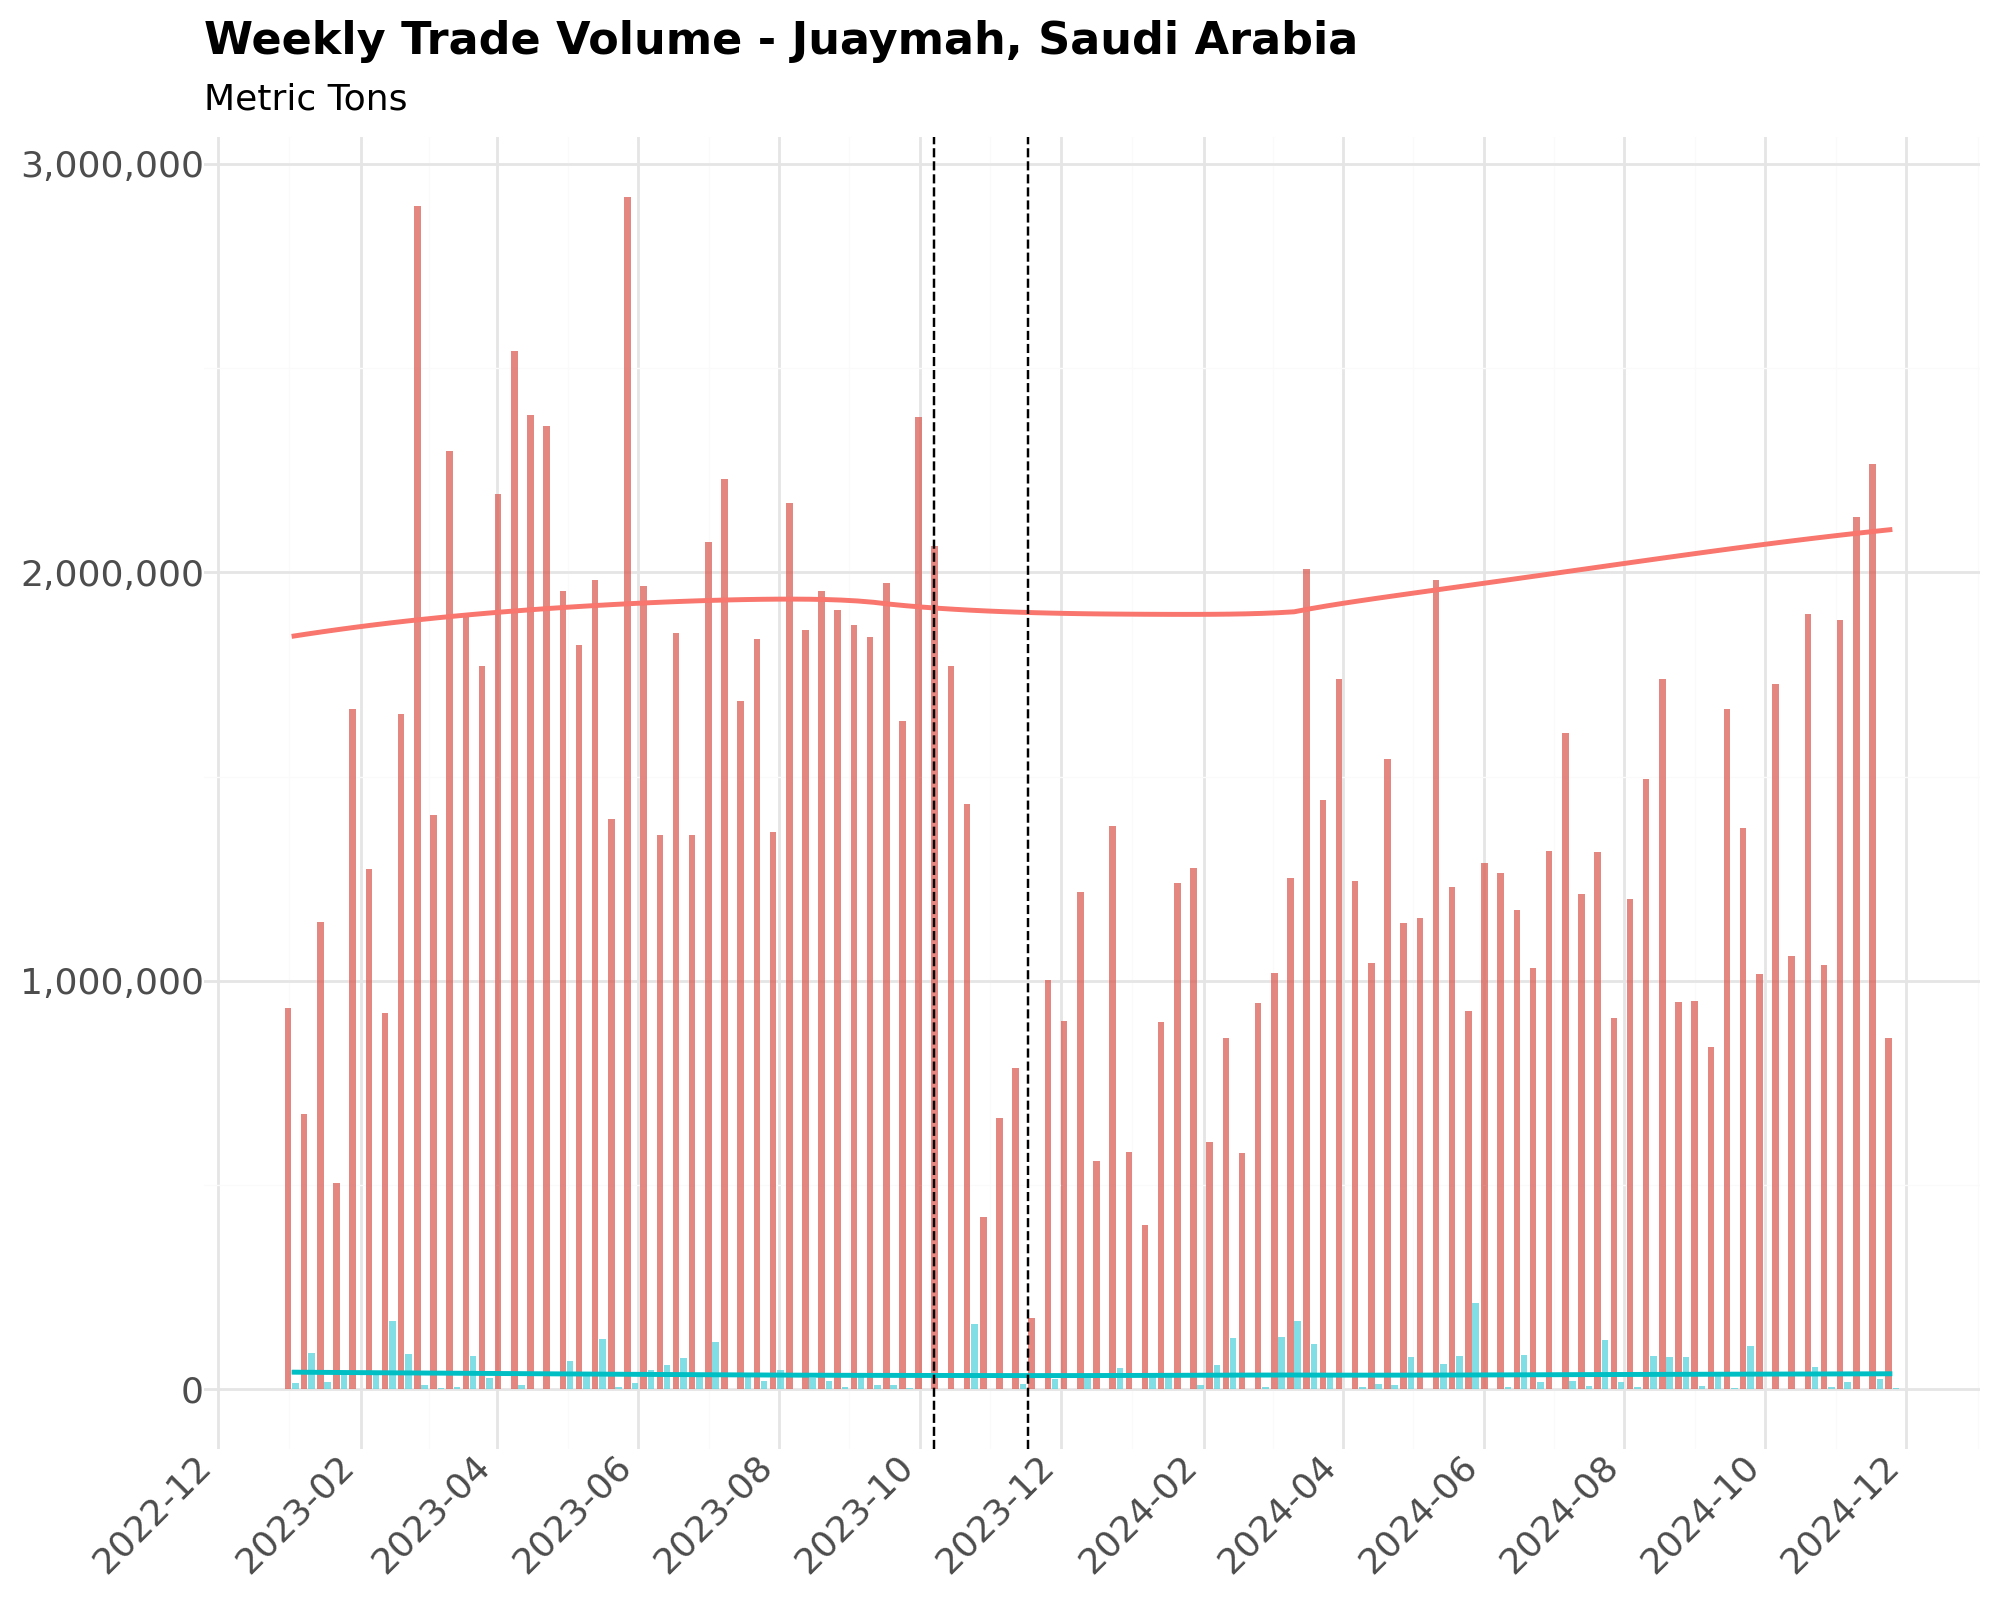
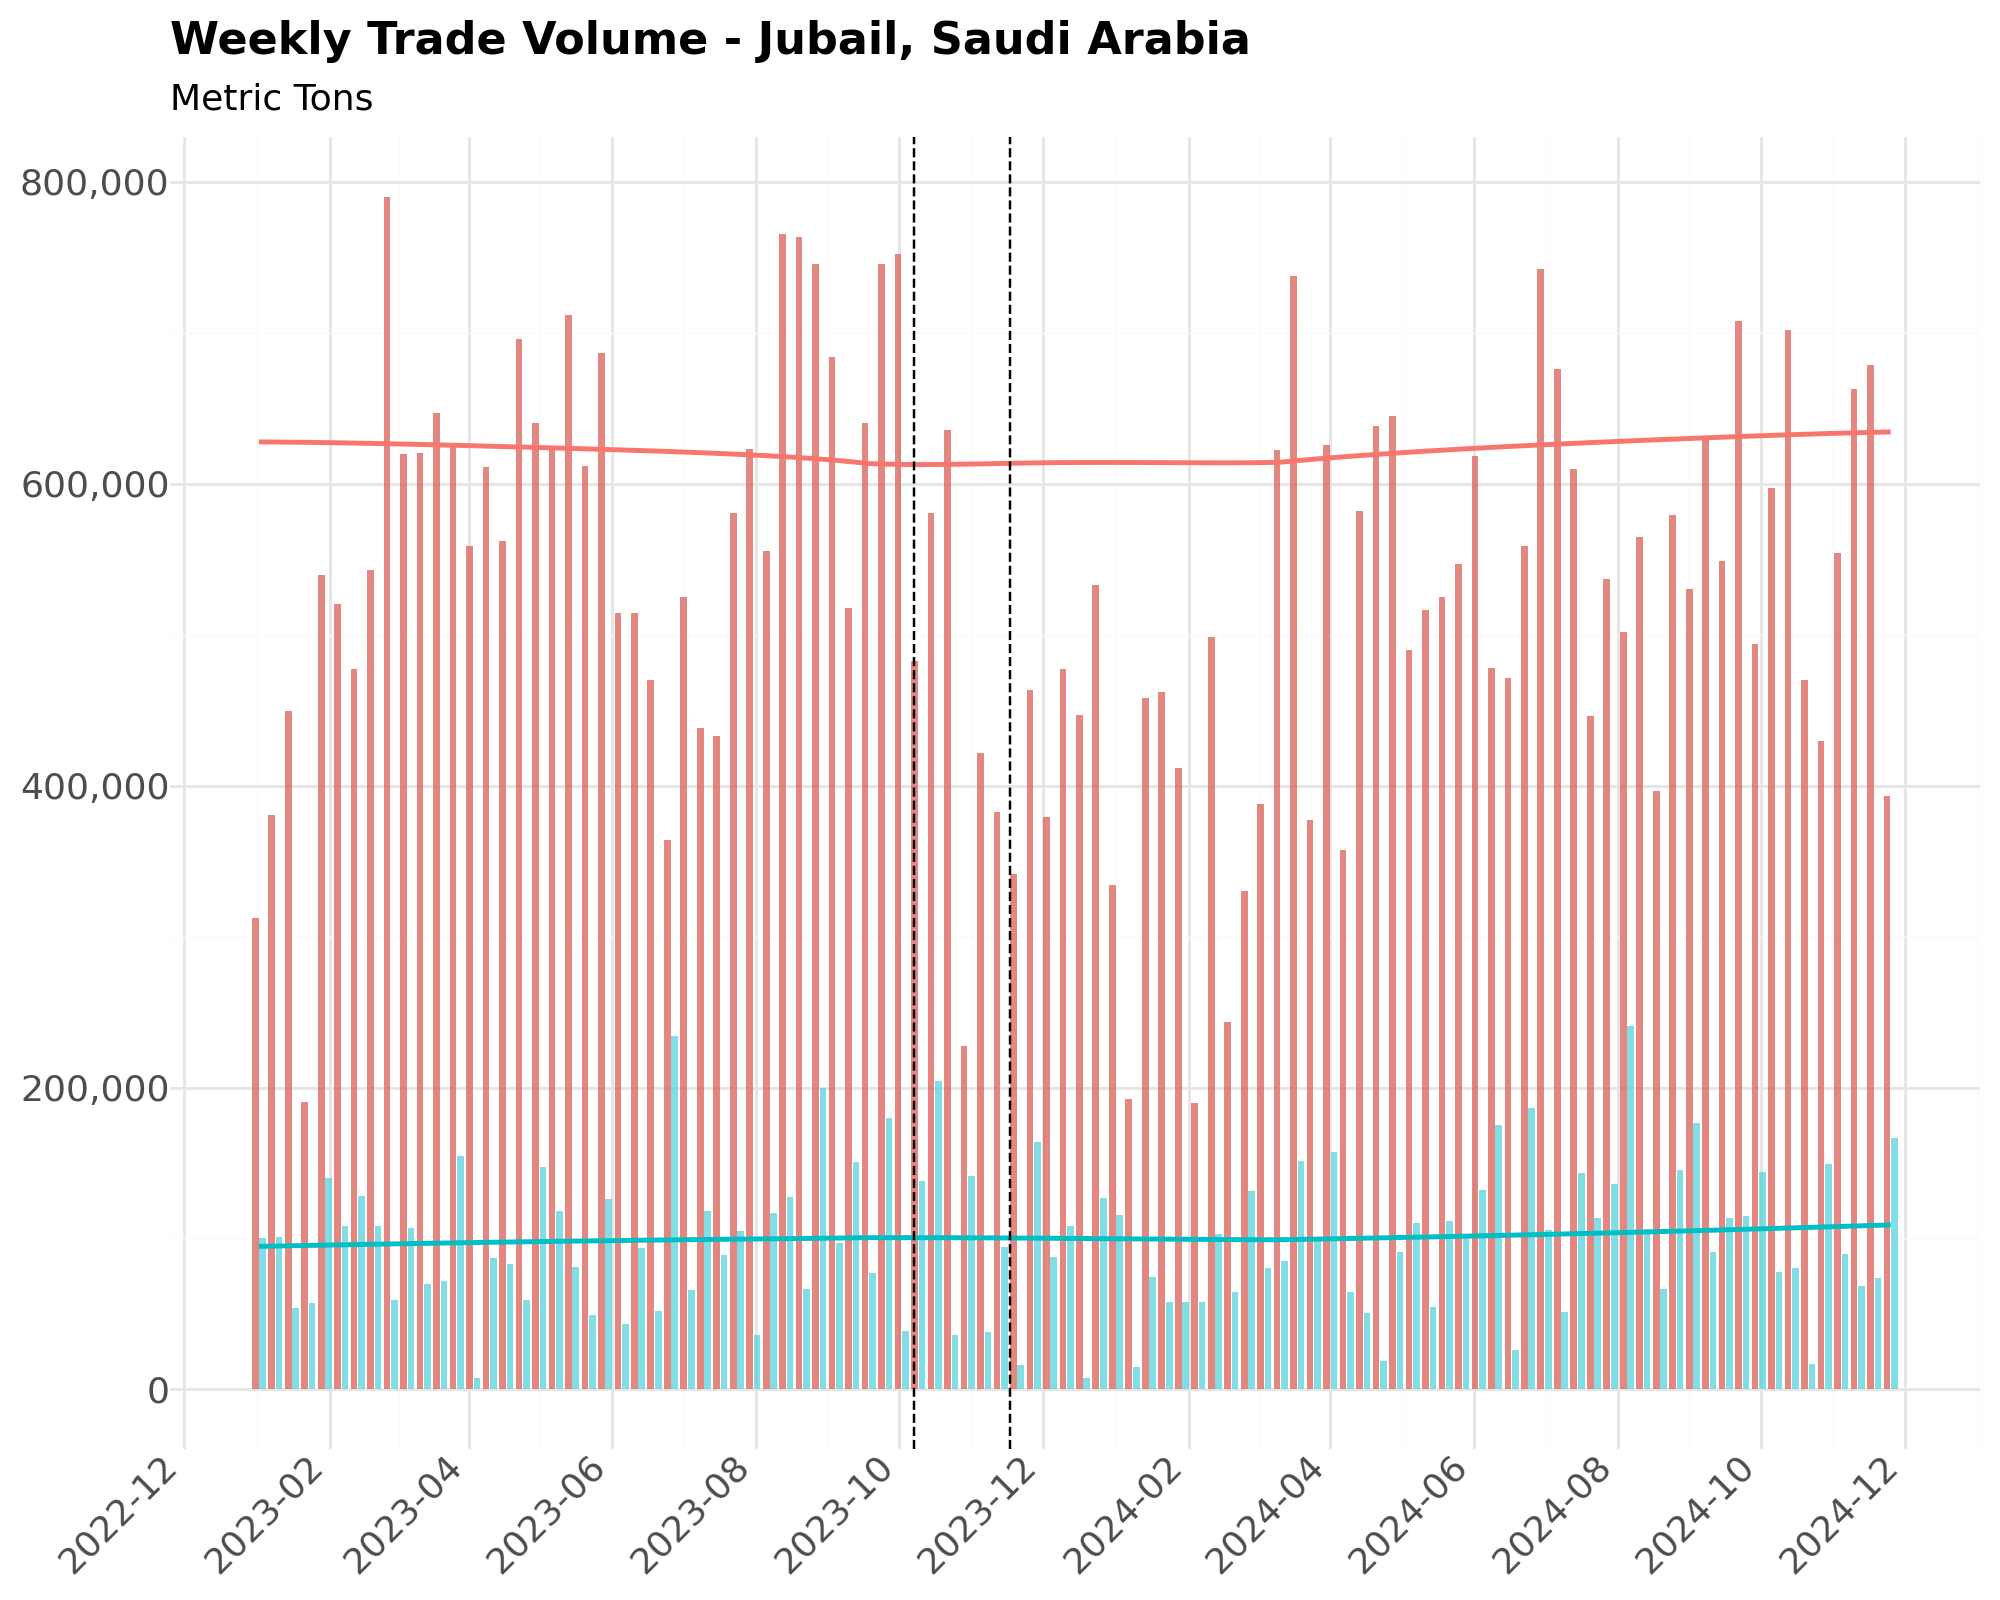
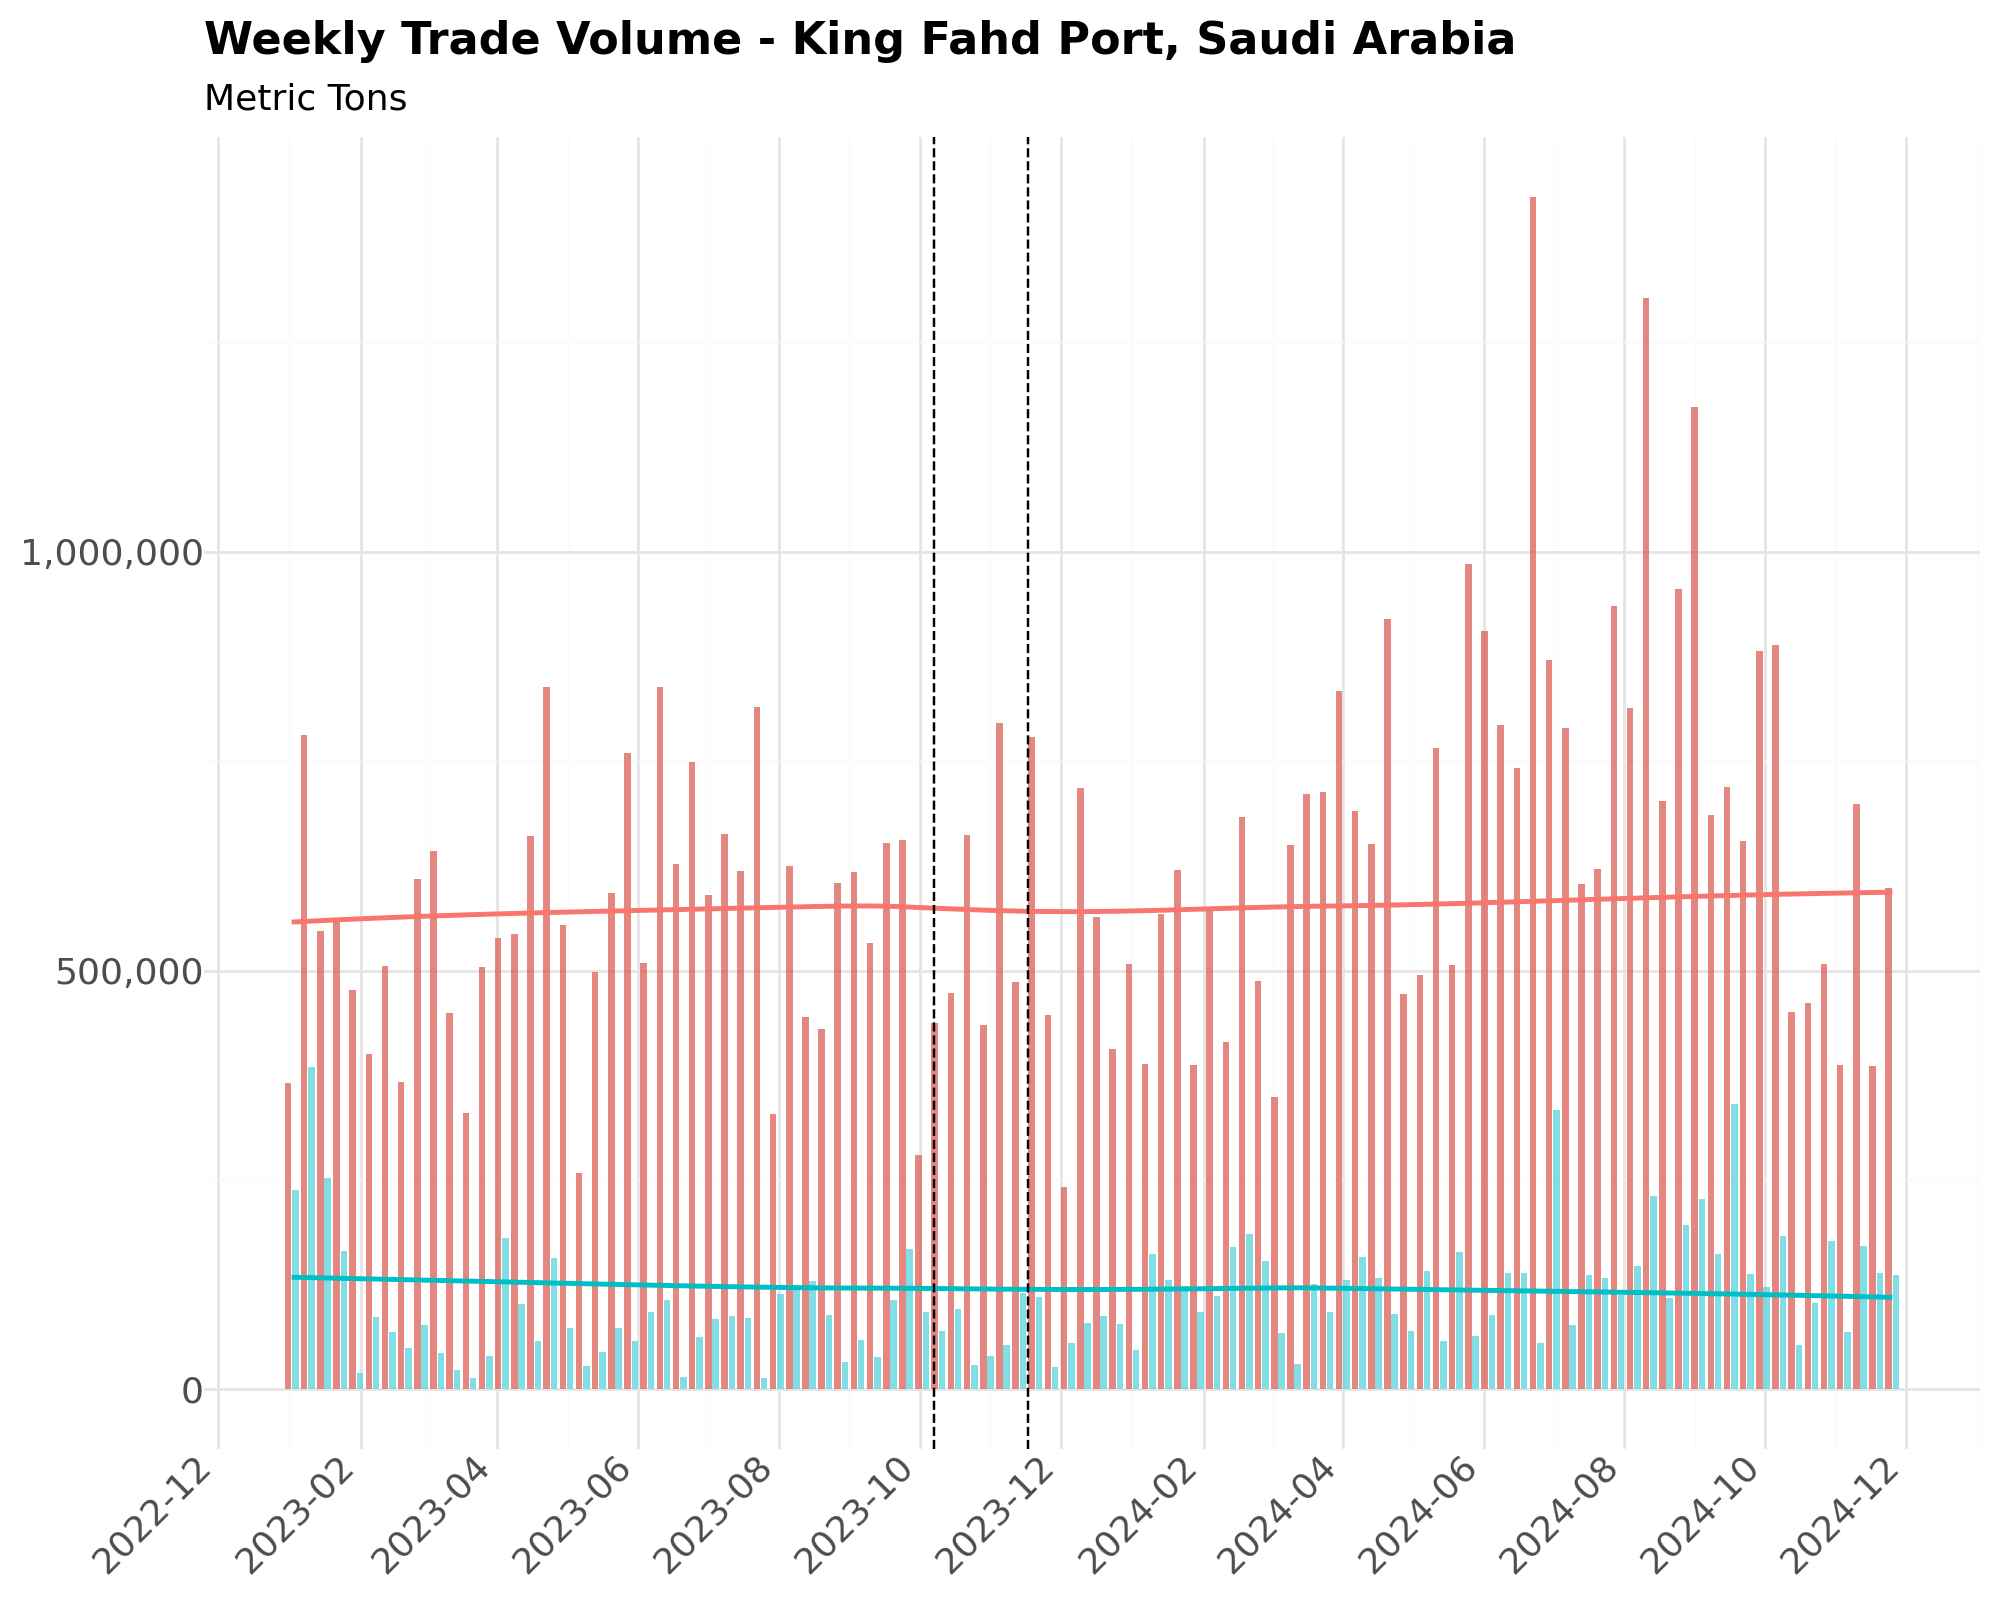
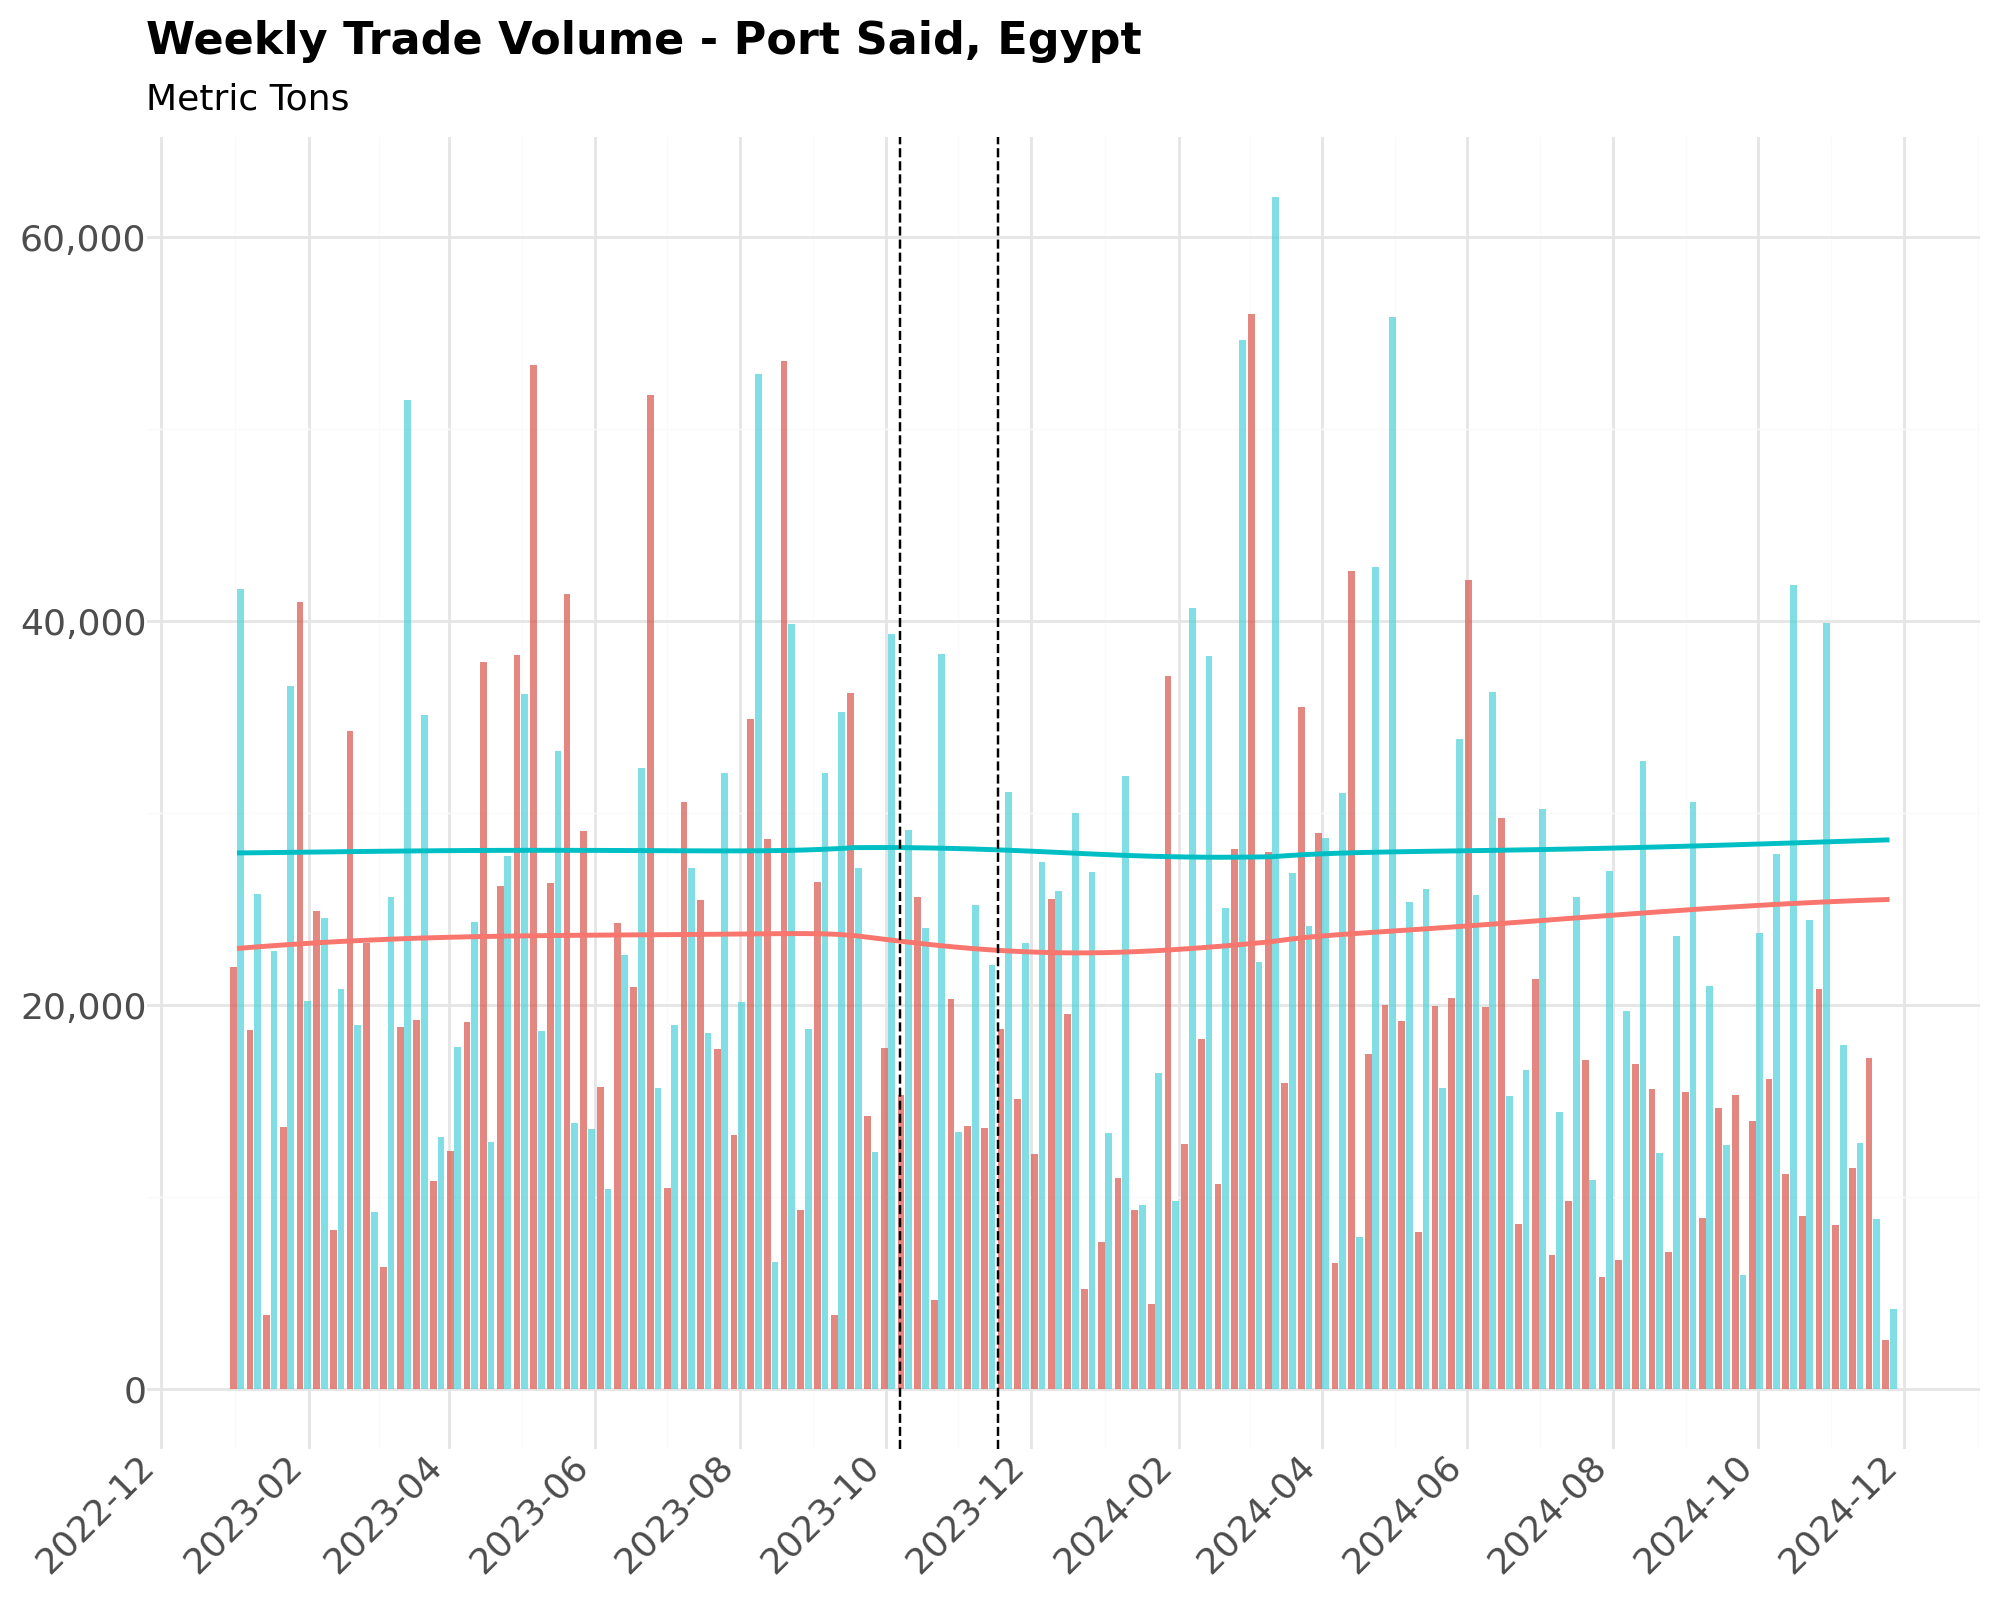
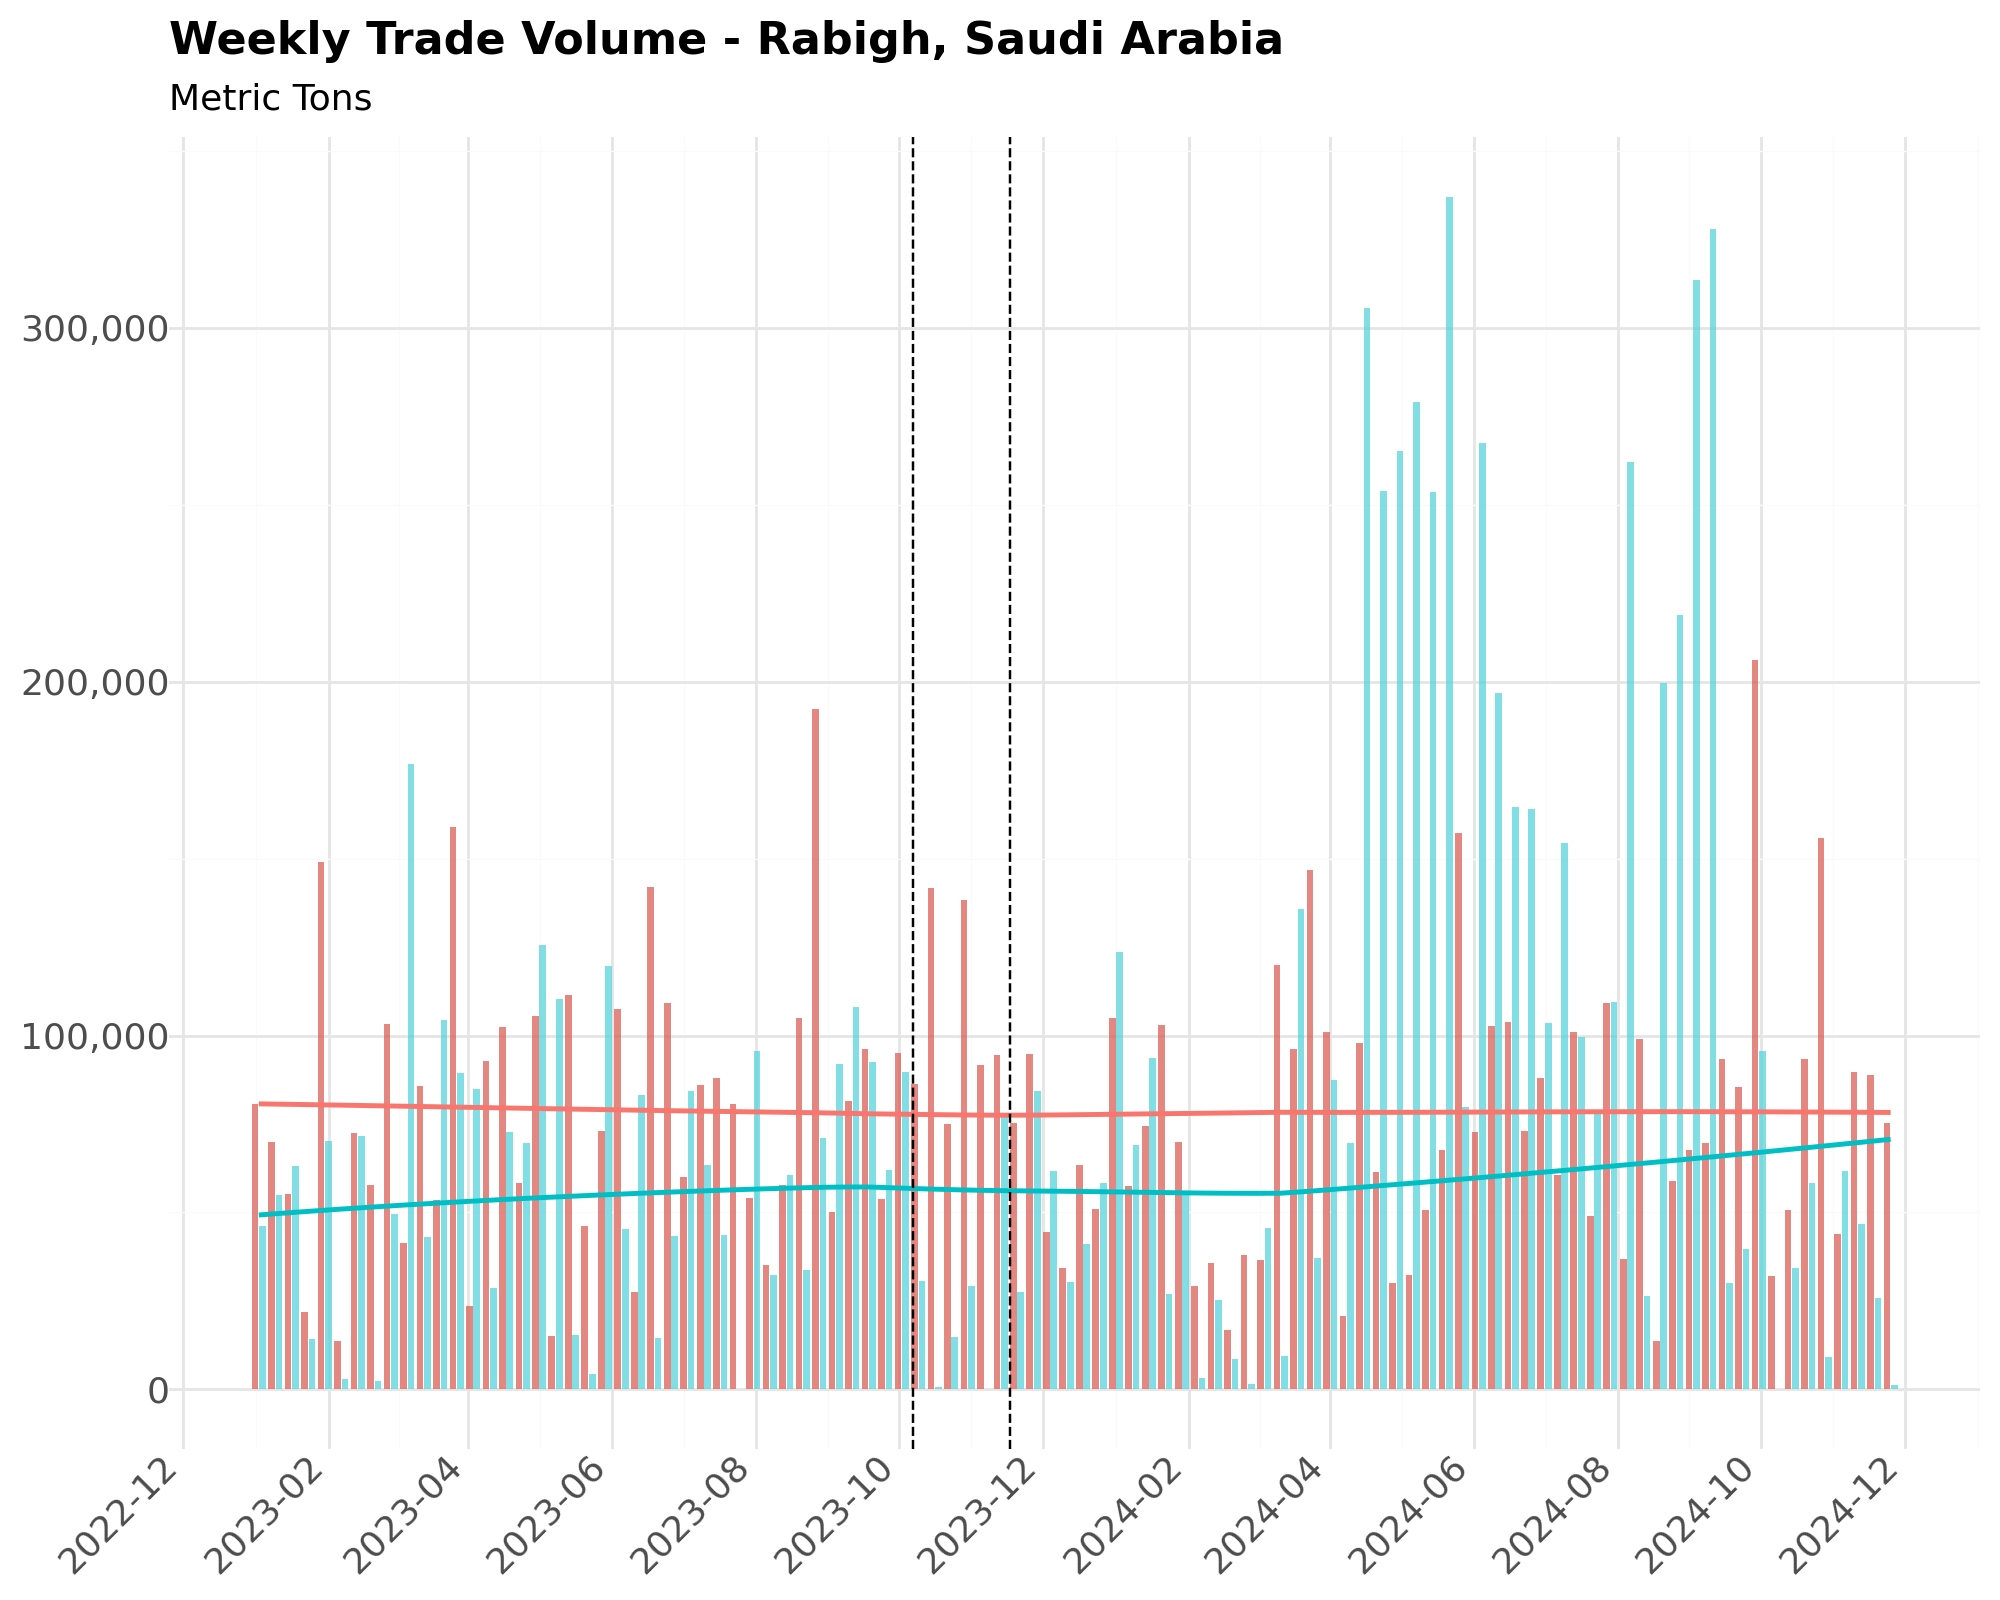
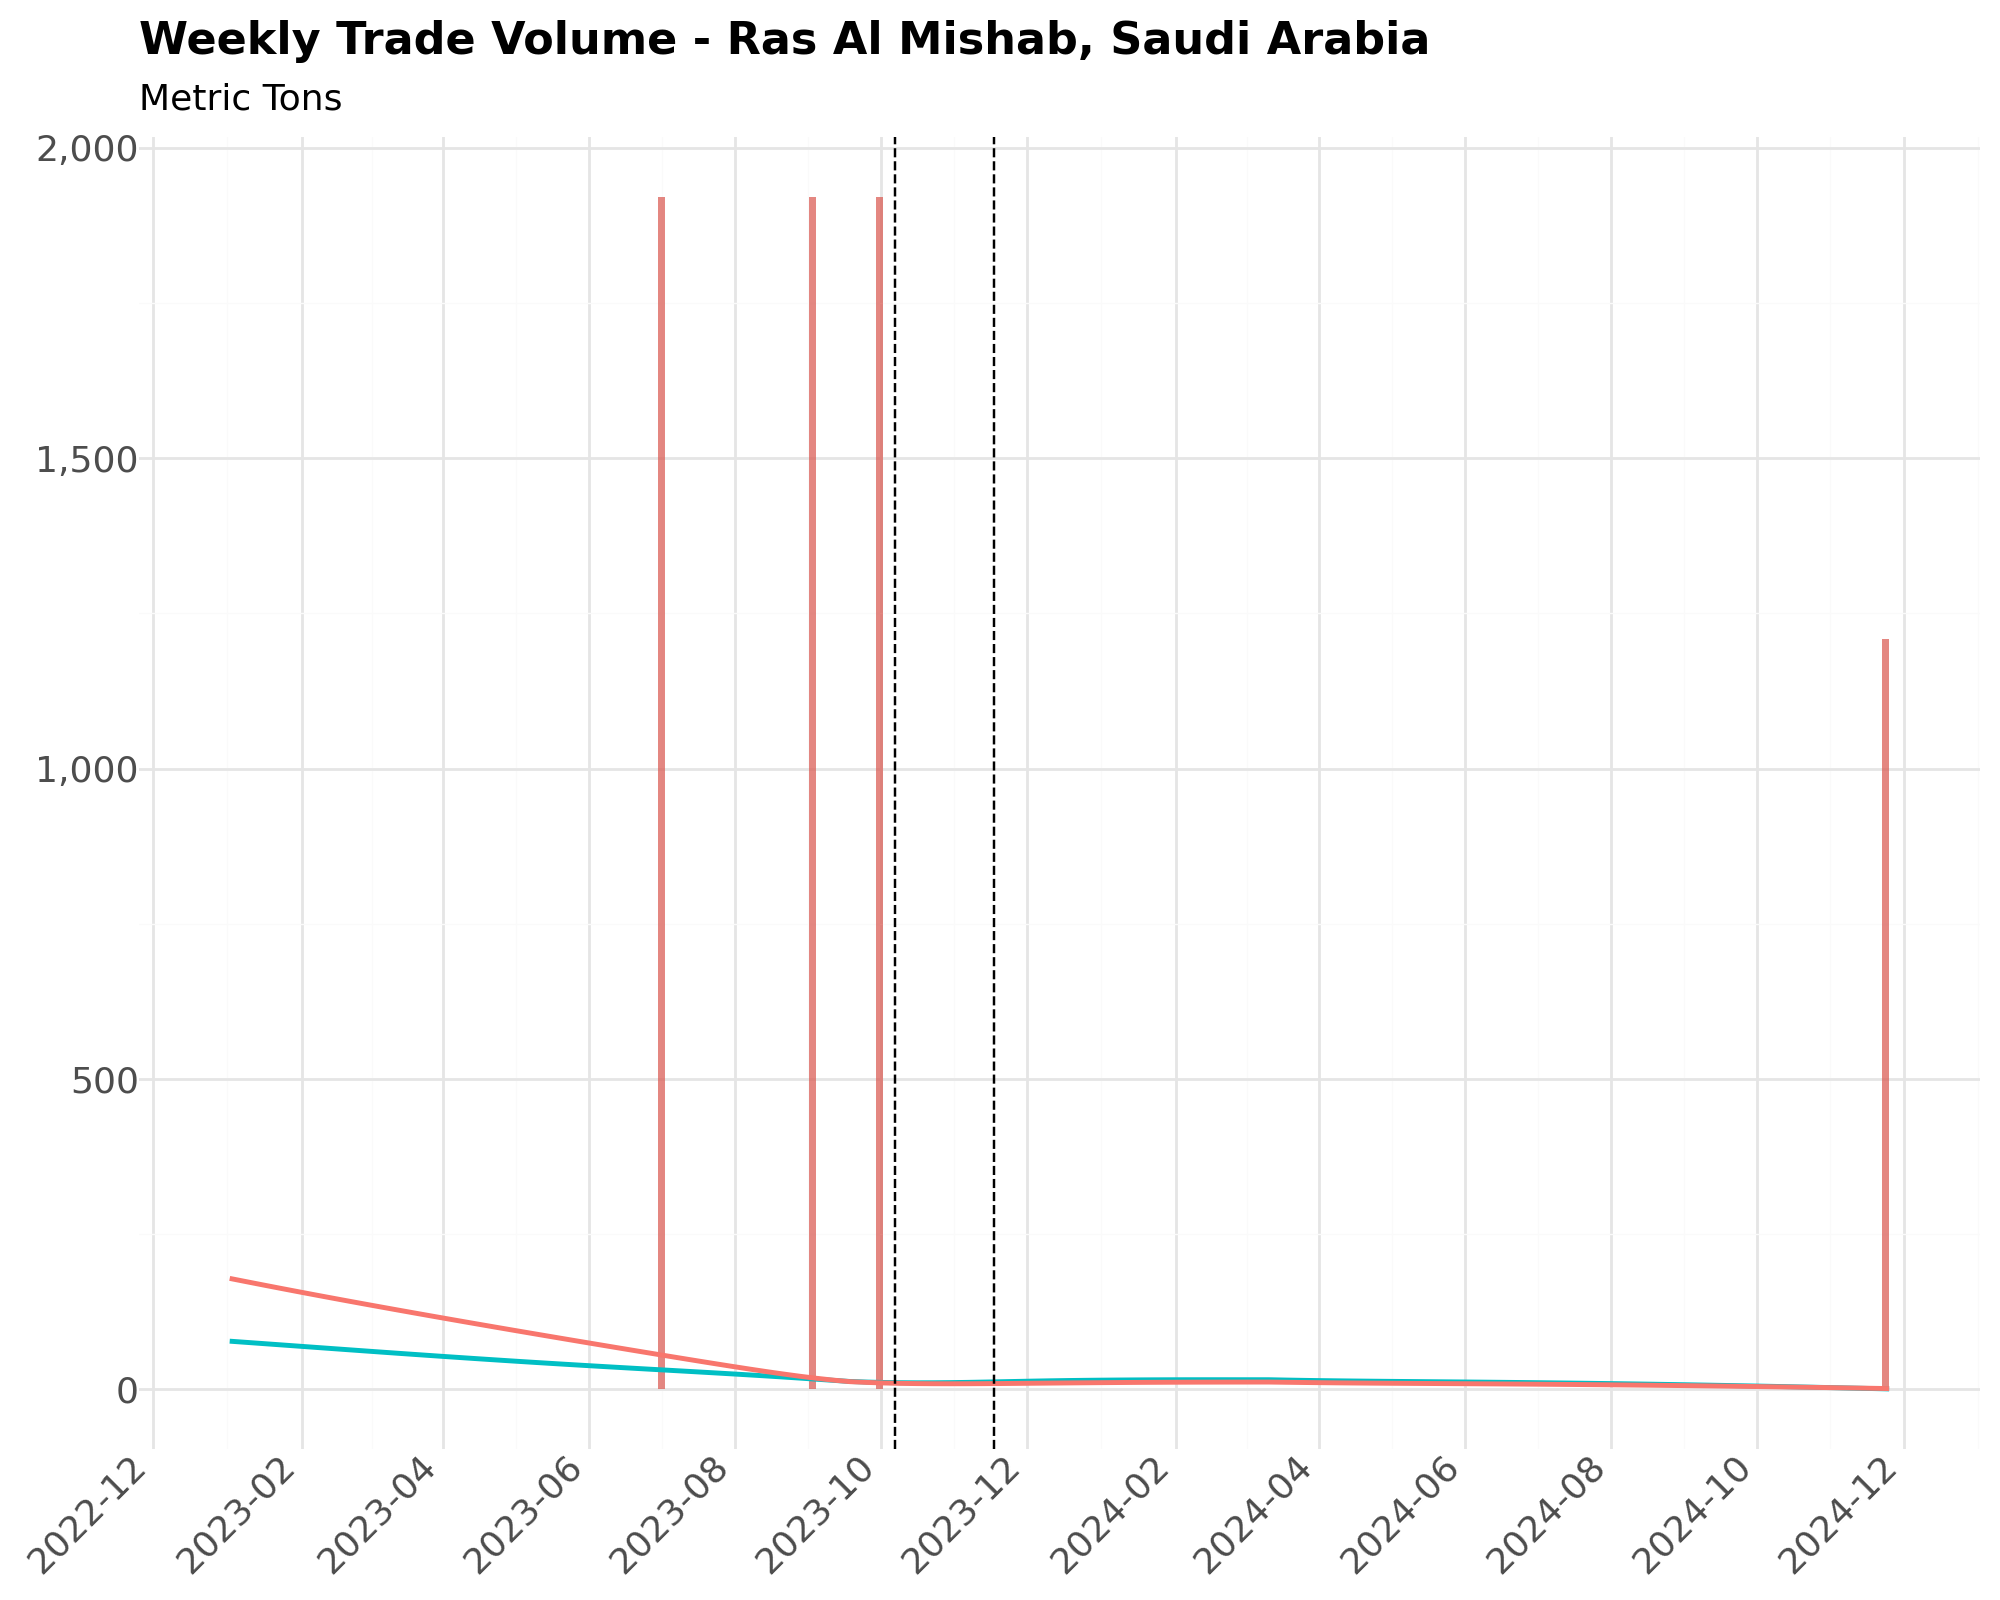
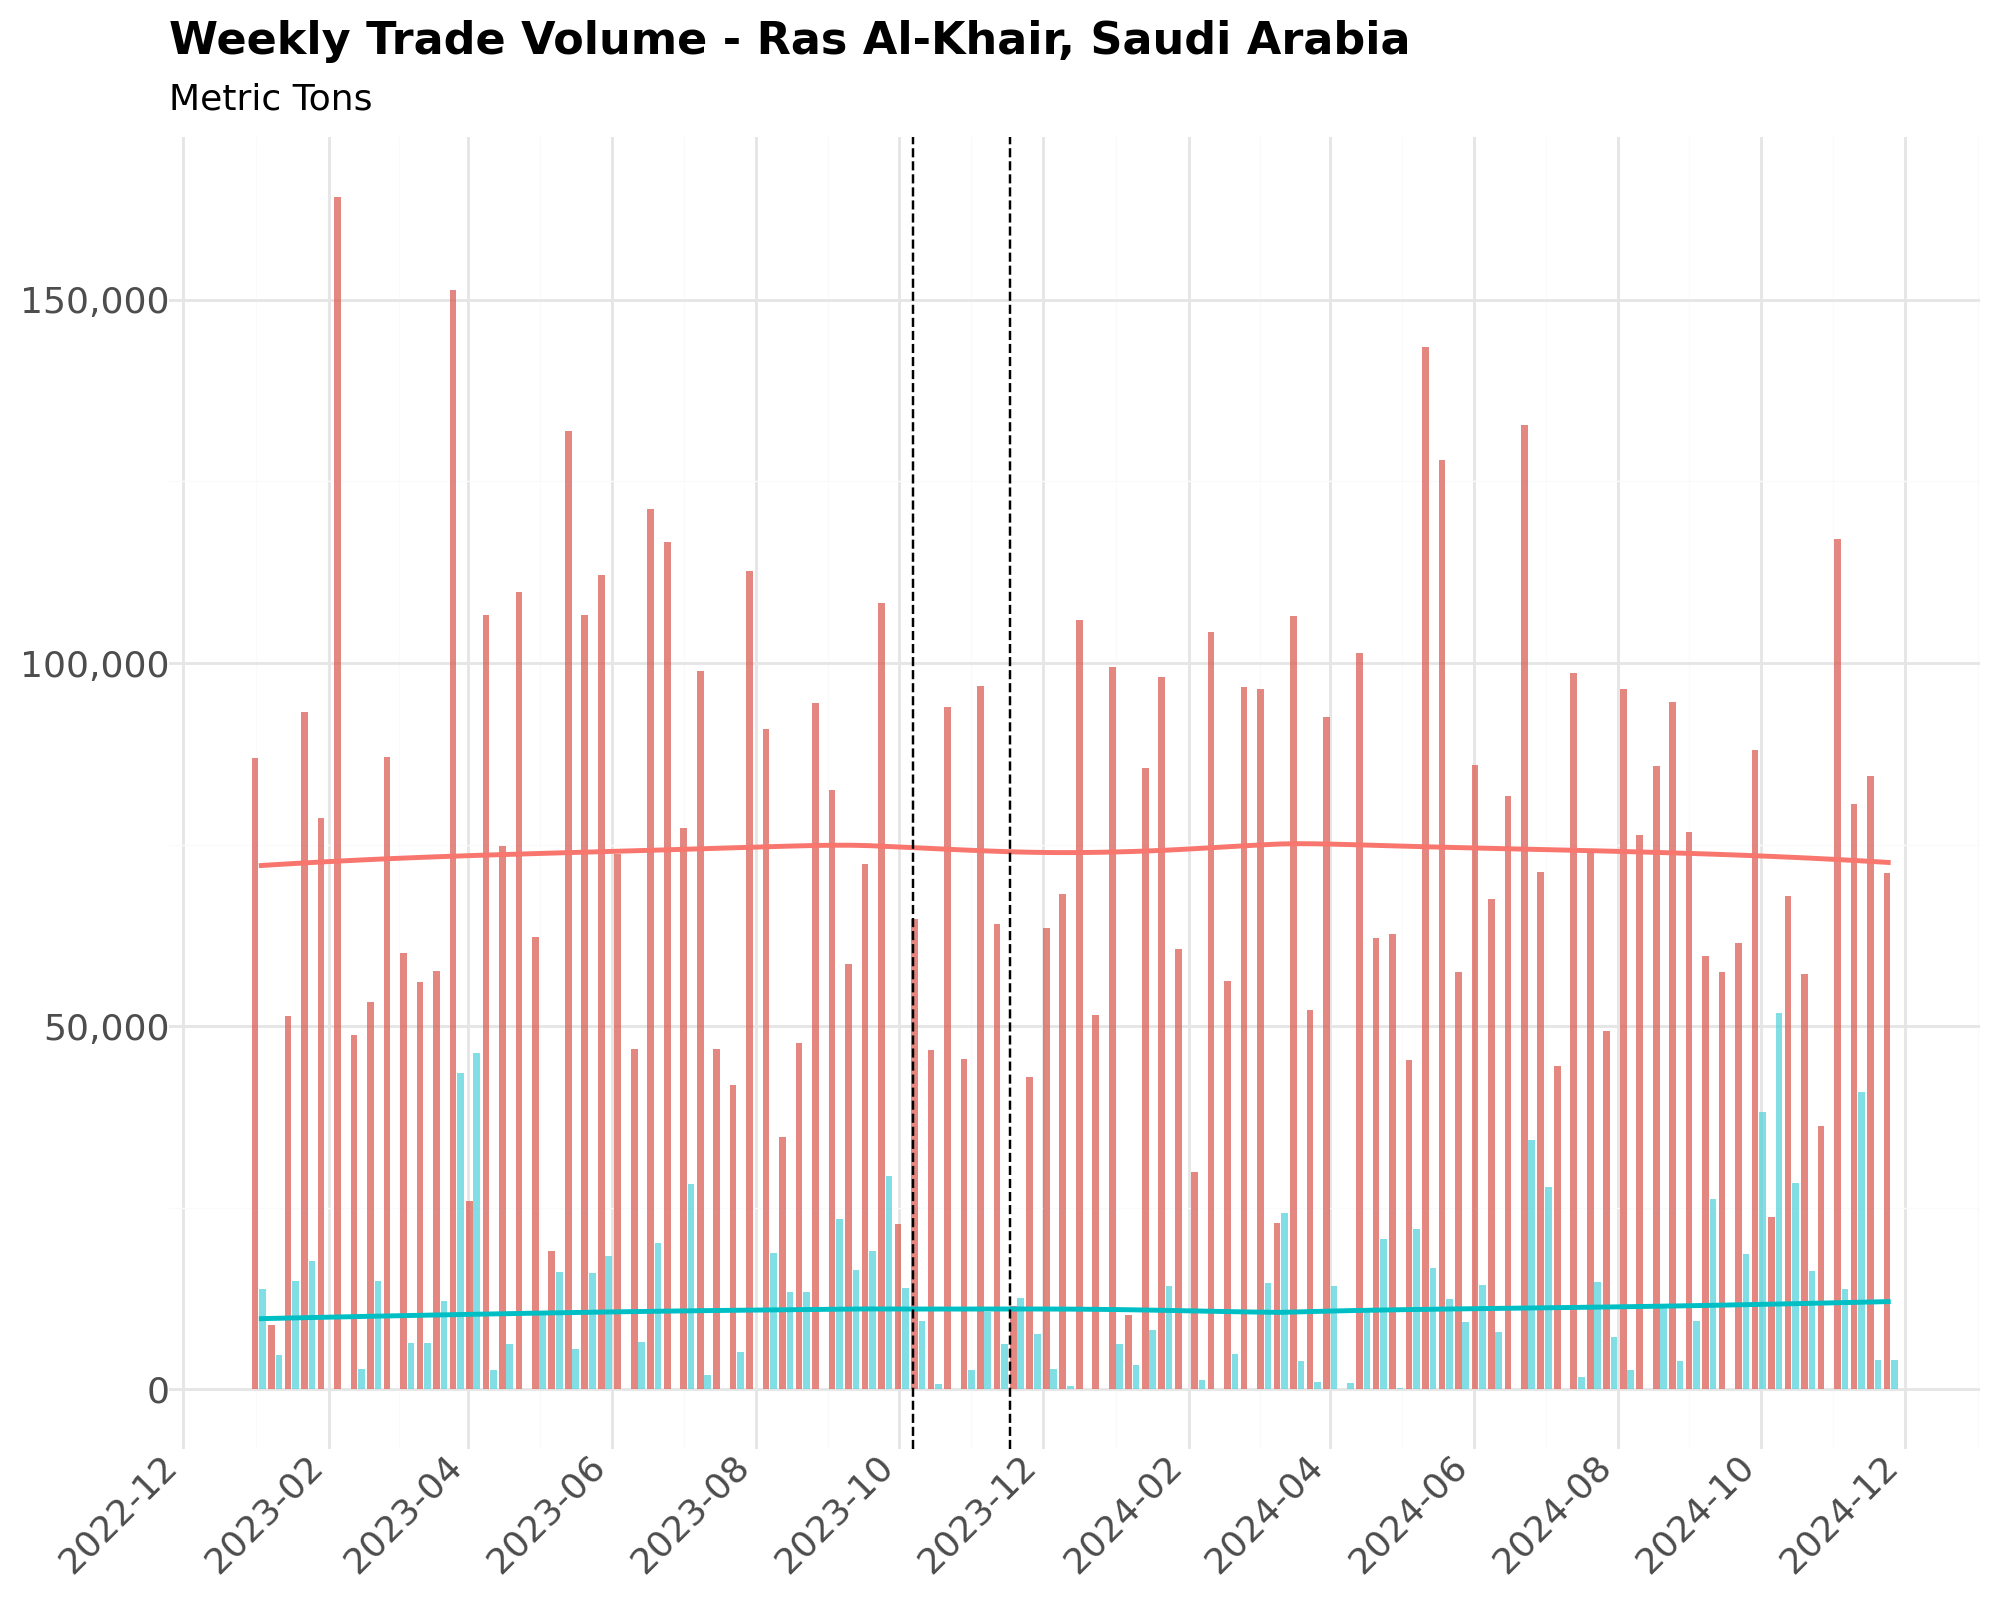
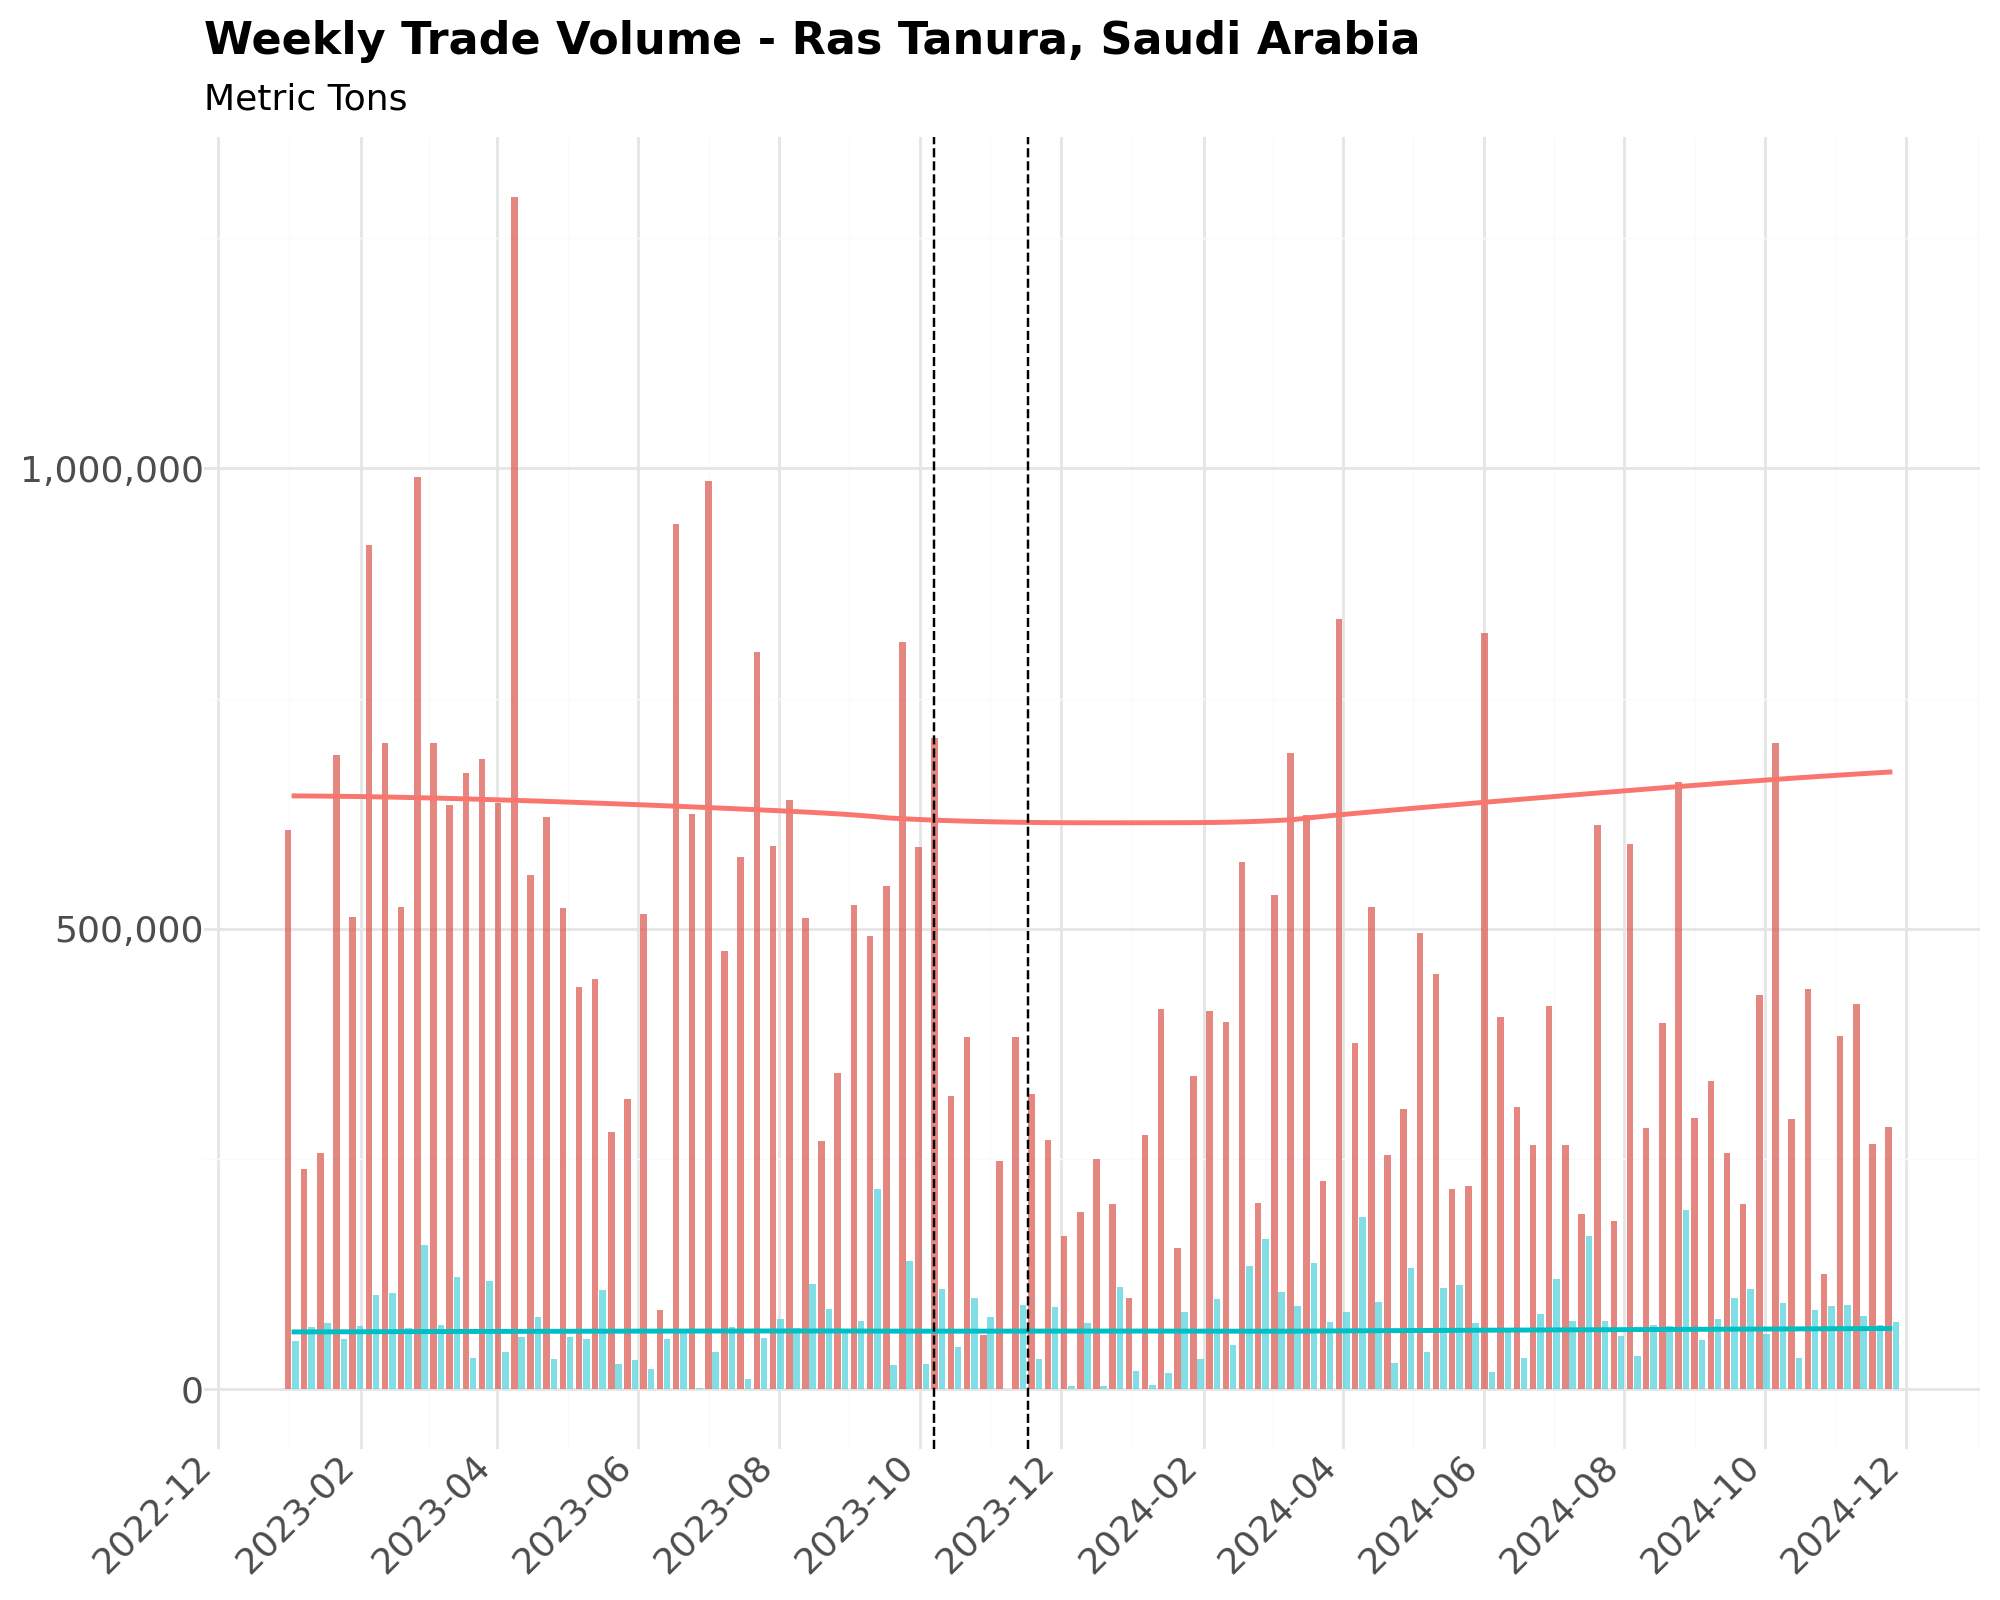
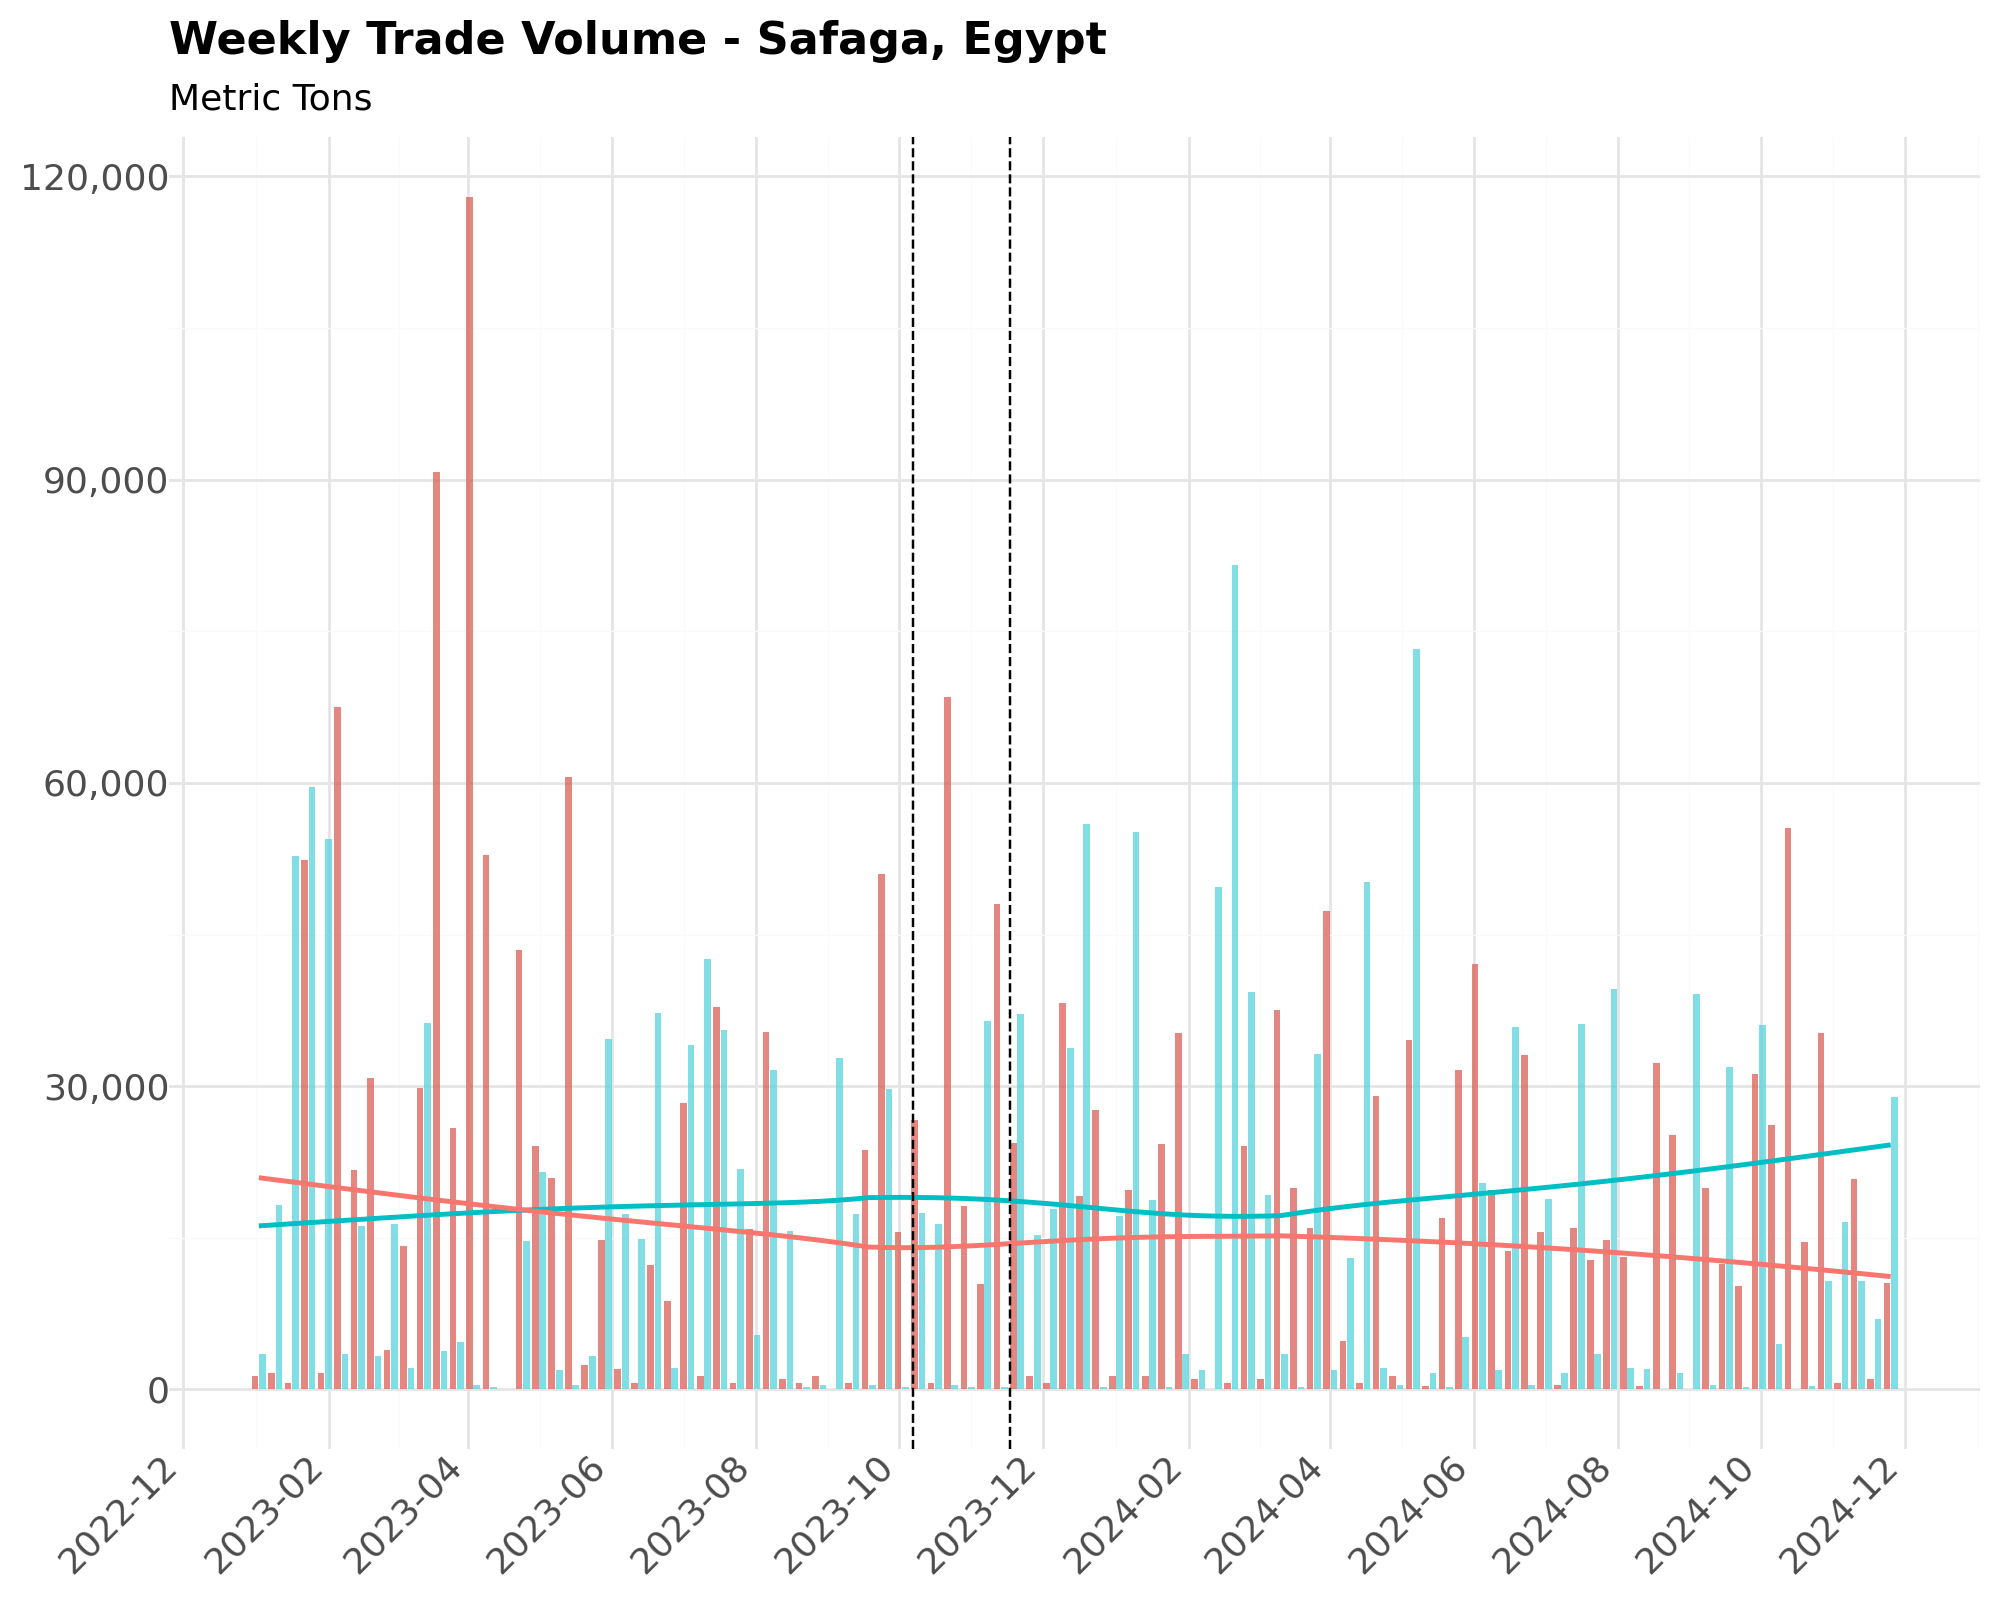
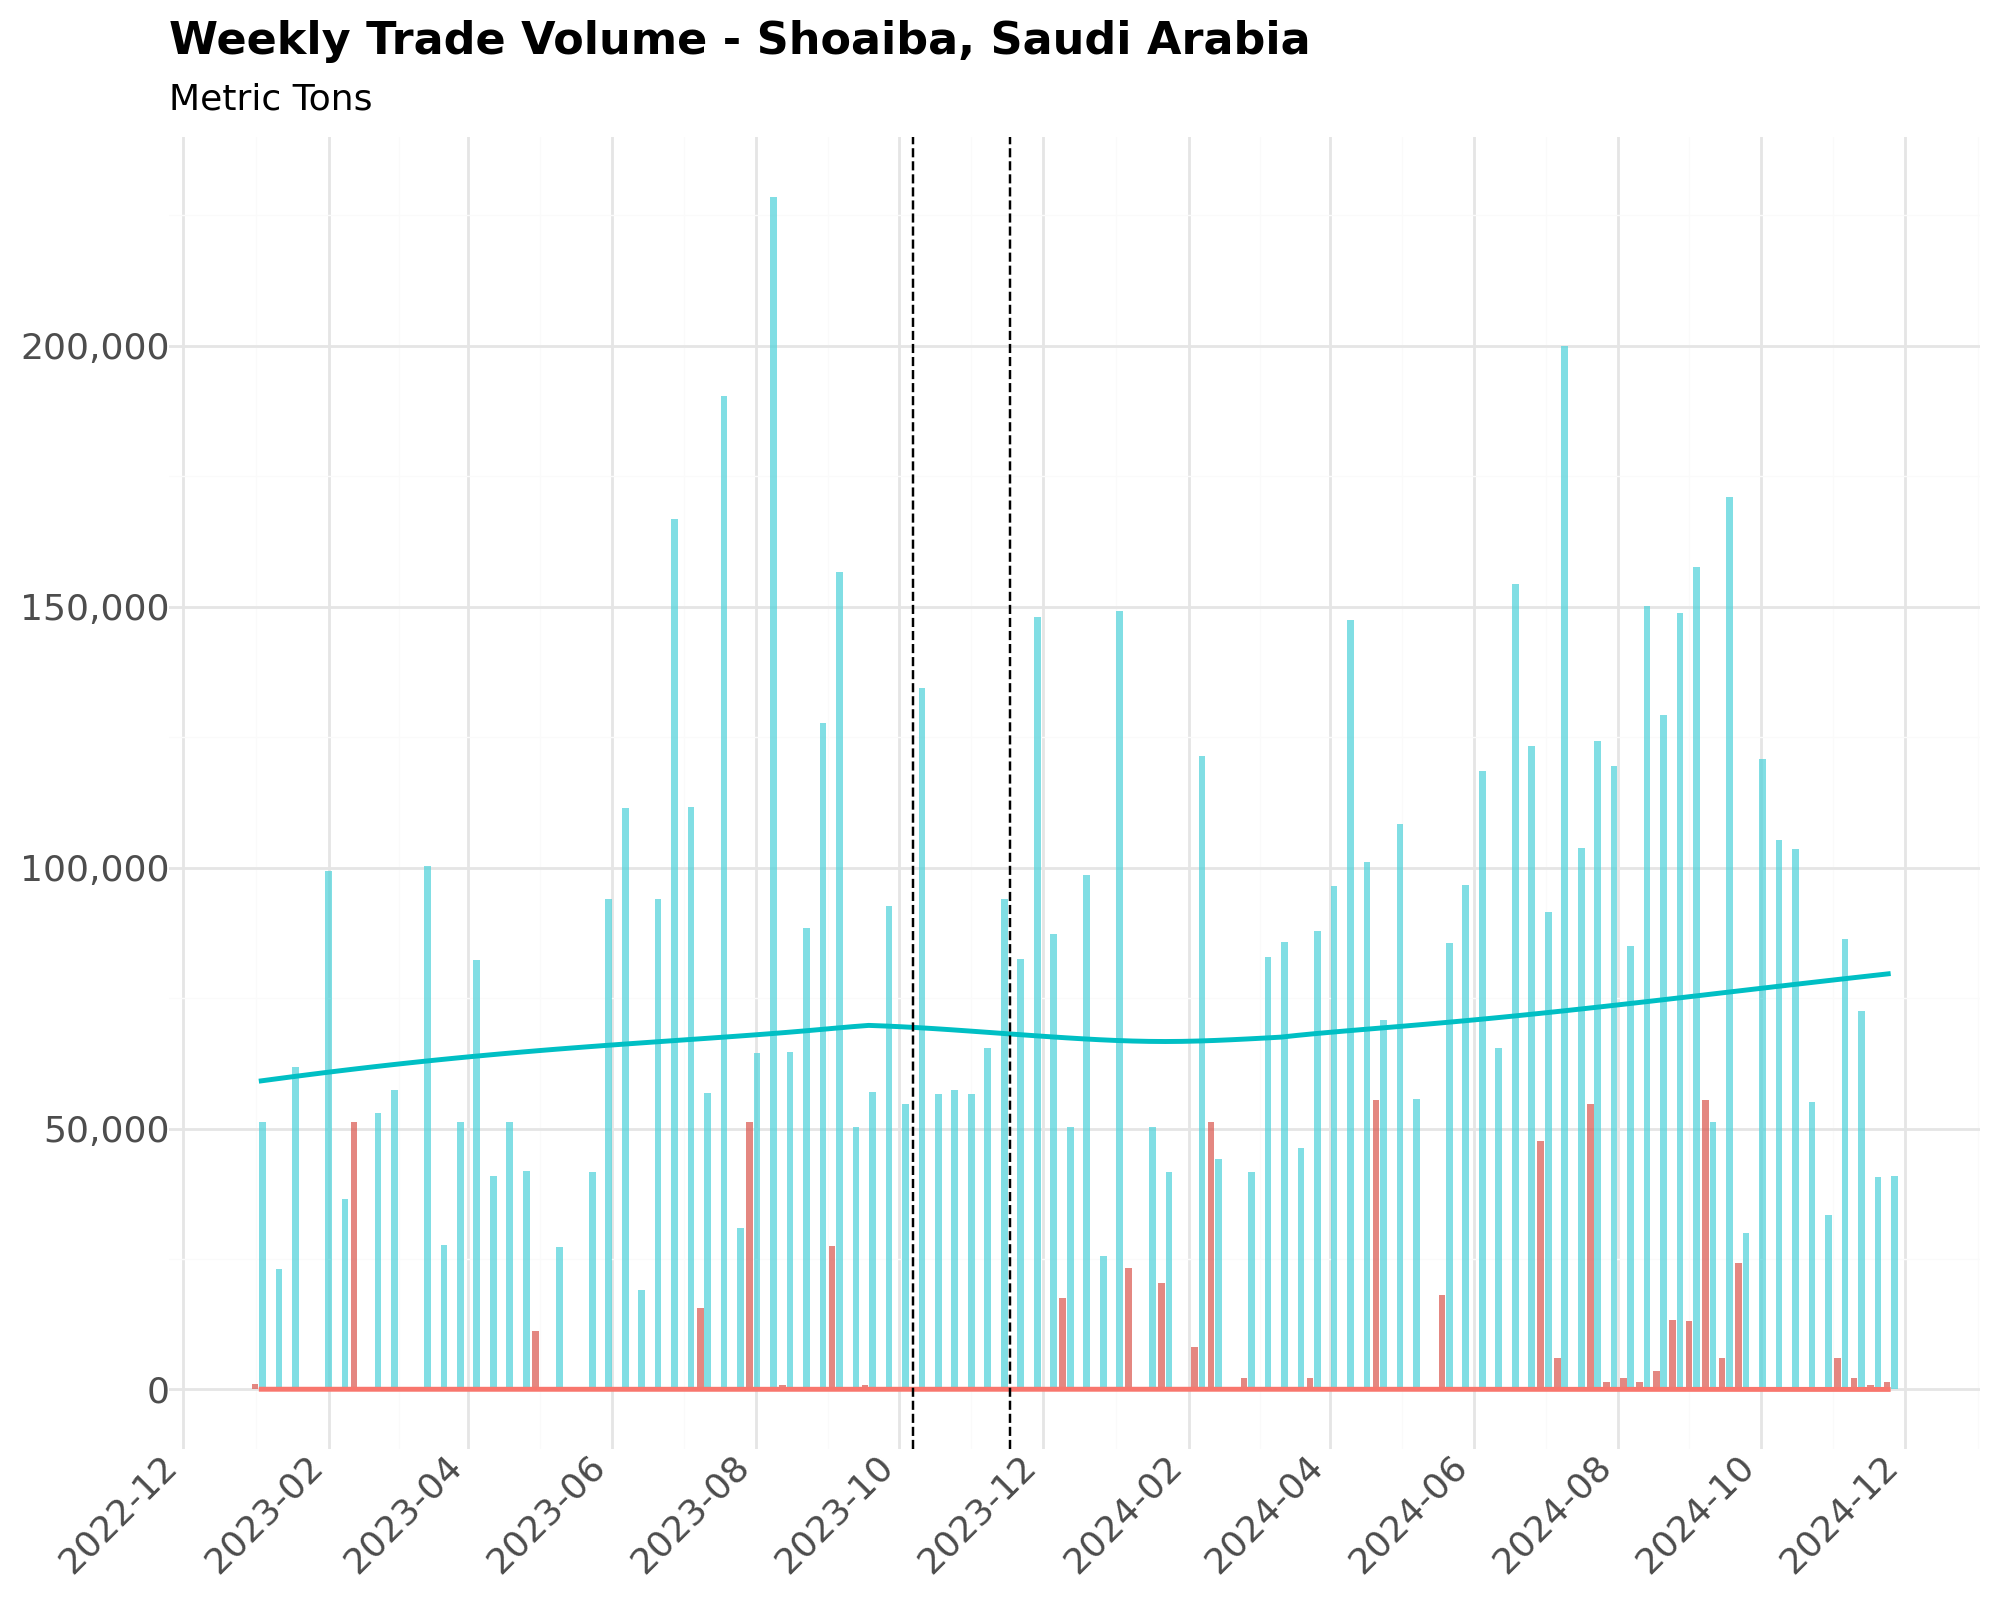
20.5.4. Weekly Trade Charts#
start_reference_date = "2022-01-01"
conflict_date = "2023-10-07"
crisis_date = "2023-11-17"
df_filt = df_week.loc[(df_week.date >= "2023-01-01")].copy() # Obtain the recent data
Calculate the reference period and add it to the recent data. The merging will occur on the week of the year.
df_ref = df_week.loc[(df_week.date >= start_reference_date) & (df_week.date < conflict_date)].copy()
df_ref = df_ref.groupby(["portname", "portid", "w"])[
    [
        "portcalls_cargo",
        "portcalls_tanker",
        "portcalls",
        "import_cargo",
        "export_cargo",
        "import_tanker",
        "export_tanker",
        "import",
        "export",
    ]
].mean()
df_ref.reset_index(inplace=True)
df_ref.rename(
    columns={
        "portcalls_cargo": "portcalls_cargo_ref",
        "portcalls_tanker": "portcalls_tanker_ref",
        "portcalls": "portcalls_ref",
        "import_cargo": "import_cargo_ref",
        "export_cargo": "export_cargo_ref",
        "import_tanker": "import_tanker_ref",
        "export_tanker": "export_tanker_ref",
        "import": "import_ref",
        "export": "export_ref",
    },
    inplace=True,
)
df_filt = df_filt.merge(
    df_ref, on=["portname", "portid", "w"], how="left", validate="m:1"
)
for port_id in df_filt.portid.unique():
    port_info = ports_red_sea.loc[ports_red_sea.portid == port_id].iloc[0]
    country = port_info.country
    df_port = df_filt.loc[df_filt.portid == port_id].copy()
    df_port_copy = df_port.copy()
    port = df_port_copy.iloc[0].portname
    df_port = df_port.melt(
        id_vars="date",
        value_vars=["import", "export"],
        var_name="direction",
        value_name="trade",
    )
    df_port.loc[:, "direction"] = df_port.direction.str.capitalize()
    p0 = (
        ggplot(df_port_copy, aes(x="date", y="import_ref"))  #
        + geom_bar(
            mapping=aes(x="date", y="trade", fill="direction"),
            data=df_port,
            alpha=3 / 4,
            stat="identity",
            position="dodge2",
        )
        + geom_smooth(
            mapping=aes(x="date", y="import_ref"), color="#00BFC4", size=1, alpha=3 / 4
        )
        + geom_smooth(
            mapping=aes(x="date", y="export_ref"), color="#F8766D", size=1, alpha=3 / 4
        )
        + geom_vline(xintercept=conflict_date, linetype="dashed", color="black")
        + geom_vline(xintercept=crisis_date, linetype="dashed", color="black")
        + labs(
            x="",
            y="",
            subtitle="Metric Tons",
            title=f"Weekly Trade Volume - {port}, {country}",
            fill="Trade Flow",
        )
        + theme_minimal()
        + theme(
            text=element_text(size=13),
            plot_title=element_text(size=16, weight="bold"),
            axis_text_x=element_text(rotation=45, hjust=1),
            legend_position="none",
        )
        + scale_x_datetime(breaks=date_breaks("2 month"), labels=date_format("%Y-%m"))
        + scale_y_continuous(labels=comma_format())
    )
    display(p0)
/home/sol/venv/lib/python3.10/site-packages/plotnine/stats/smoothers.py:347: PlotnineWarning: Confidence intervals are not yet implemented for lowess smoothings.
/home/sol/venv/lib/python3.10/site-packages/plotnine/stats/smoothers.py:347: PlotnineWarning: Confidence intervals are not yet implemented for lowess smoothings.
/home/sol/venv/lib/python3.10/site-packages/plotnine/stats/smoothers.py:347: PlotnineWarning: Confidence intervals are not yet implemented for lowess smoothings.
/home/sol/venv/lib/python3.10/site-packages/plotnine/stats/smoothers.py:347: PlotnineWarning: Confidence intervals are not yet implemented for lowess smoothings.
/home/sol/venv/lib/python3.10/site-packages/plotnine/stats/smoothers.py:347: PlotnineWarning: Confidence intervals are not yet implemented for lowess smoothings.
/home/sol/venv/lib/python3.10/site-packages/plotnine/stats/smoothers.py:347: PlotnineWarning: Confidence intervals are not yet implemented for lowess smoothings.
/home/sol/venv/lib/python3.10/site-packages/plotnine/stats/smoothers.py:347: PlotnineWarning: Confidence intervals are not yet implemented for lowess smoothings.
/home/sol/venv/lib/python3.10/site-packages/plotnine/stats/smoothers.py:347: PlotnineWarning: Confidence intervals are not yet implemented for lowess smoothings.
/home/sol/venv/lib/python3.10/site-packages/plotnine/stats/smoothers.py:347: PlotnineWarning: Confidence intervals are not yet implemented for lowess smoothings.
/home/sol/venv/lib/python3.10/site-packages/plotnine/stats/smoothers.py:347: PlotnineWarning: Confidence intervals are not yet implemented for lowess smoothings.
/home/sol/venv/lib/python3.10/site-packages/plotnine/stats/smoothers.py:347: PlotnineWarning: Confidence intervals are not yet implemented for lowess smoothings.
/home/sol/venv/lib/python3.10/site-packages/plotnine/stats/smoothers.py:347: PlotnineWarning: Confidence intervals are not yet implemented for lowess smoothings.
/home/sol/venv/lib/python3.10/site-packages/plotnine/stats/smoothers.py:347: PlotnineWarning: Confidence intervals are not yet implemented for lowess smoothings.
/home/sol/venv/lib/python3.10/site-packages/plotnine/stats/smoothers.py:347: PlotnineWarning: Confidence intervals are not yet implemented for lowess smoothings.
/home/sol/venv/lib/python3.10/site-packages/plotnine/stats/smoothers.py:347: PlotnineWarning: Confidence intervals are not yet implemented for lowess smoothings.
/home/sol/venv/lib/python3.10/site-packages/plotnine/stats/smoothers.py:347: PlotnineWarning: Confidence intervals are not yet implemented for lowess smoothings.
/home/sol/venv/lib/python3.10/site-packages/plotnine/stats/smoothers.py:347: PlotnineWarning: Confidence intervals are not yet implemented for lowess smoothings.
/home/sol/venv/lib/python3.10/site-packages/plotnine/stats/smoothers.py:347: PlotnineWarning: Confidence intervals are not yet implemented for lowess smoothings.
/home/sol/venv/lib/python3.10/site-packages/plotnine/stats/smoothers.py:347: PlotnineWarning: Confidence intervals are not yet implemented for lowess smoothings.
/home/sol/venv/lib/python3.10/site-packages/plotnine/stats/smoothers.py:347: PlotnineWarning: Confidence intervals are not yet implemented for lowess smoothings.
/home/sol/venv/lib/python3.10/site-packages/plotnine/stats/smoothers.py:347: PlotnineWarning: Confidence intervals are not yet implemented for lowess smoothings.
/home/sol/venv/lib/python3.10/site-packages/plotnine/stats/smoothers.py:347: PlotnineWarning: Confidence intervals are not yet implemented for lowess smoothings.
/home/sol/venv/lib/python3.10/site-packages/plotnine/stats/smoothers.py:347: PlotnineWarning: Confidence intervals are not yet implemented for lowess smoothings.
/home/sol/venv/lib/python3.10/site-packages/plotnine/stats/smoothers.py:347: PlotnineWarning: Confidence intervals are not yet implemented for lowess smoothings.
/home/sol/venv/lib/python3.10/site-packages/plotnine/stats/smoothers.py:347: PlotnineWarning: Confidence intervals are not yet implemented for lowess smoothings.
/home/sol/venv/lib/python3.10/site-packages/plotnine/stats/smoothers.py:347: PlotnineWarning: Confidence intervals are not yet implemented for lowess smoothings.
/home/sol/venv/lib/python3.10/site-packages/plotnine/stats/smoothers.py:347: PlotnineWarning: Confidence intervals are not yet implemented for lowess smoothings.
/home/sol/venv/lib/python3.10/site-packages/plotnine/stats/smoothers.py:347: PlotnineWarning: Confidence intervals are not yet implemented for lowess smoothings.
/home/sol/venv/lib/python3.10/site-packages/plotnine/stats/smoothers.py:347: PlotnineWarning: Confidence intervals are not yet implemented for lowess smoothings.
/home/sol/venv/lib/python3.10/site-packages/plotnine/stats/smoothers.py:347: PlotnineWarning: Confidence intervals are not yet implemented for lowess smoothings.
/home/sol/venv/lib/python3.10/site-packages/plotnine/stats/smoothers.py:347: PlotnineWarning: Confidence intervals are not yet implemented for lowess smoothings.
/home/sol/venv/lib/python3.10/site-packages/plotnine/stats/smoothers.py:347: PlotnineWarning: Confidence intervals are not yet implemented for lowess smoothings.
/home/sol/venv/lib/python3.10/site-packages/plotnine/stats/smoothers.py:347: PlotnineWarning: Confidence intervals are not yet implemented for lowess smoothings.
/home/sol/venv/lib/python3.10/site-packages/plotnine/stats/smoothers.py:347: PlotnineWarning: Confidence intervals are not yet implemented for lowess smoothings.
/home/sol/venv/lib/python3.10/site-packages/plotnine/stats/smoothers.py:347: PlotnineWarning: Confidence intervals are not yet implemented for lowess smoothings.
/home/sol/venv/lib/python3.10/site-packages/plotnine/stats/smoothers.py:347: PlotnineWarning: Confidence intervals are not yet implemented for lowess smoothings.
/home/sol/venv/lib/python3.10/site-packages/plotnine/stats/smoothers.py:347: PlotnineWarning: Confidence intervals are not yet implemented for lowess smoothings.
/home/sol/venv/lib/python3.10/site-packages/plotnine/stats/smoothers.py:347: PlotnineWarning: Confidence intervals are not yet implemented for lowess smoothings.
/home/sol/venv/lib/python3.10/site-packages/plotnine/stats/smoothers.py:347: PlotnineWarning: Confidence intervals are not yet implemented for lowess smoothings.
/home/sol/venv/lib/python3.10/site-packages/plotnine/stats/smoothers.py:347: PlotnineWarning: Confidence intervals are not yet implemented for lowess smoothings.
/home/sol/venv/lib/python3.10/site-packages/plotnine/stats/smoothers.py:347: PlotnineWarning: Confidence intervals are not yet implemented for lowess smoothings.
/home/sol/venv/lib/python3.10/site-packages/plotnine/stats/smoothers.py:347: PlotnineWarning: Confidence intervals are not yet implemented for lowess smoothings.
/home/sol/venv/lib/python3.10/site-packages/plotnine/stats/smoothers.py:347: PlotnineWarning: Confidence intervals are not yet implemented for lowess smoothings.
/home/sol/venv/lib/python3.10/site-packages/plotnine/stats/smoothers.py:347: PlotnineWarning: Confidence intervals are not yet implemented for lowess smoothings.
/home/sol/venv/lib/python3.10/site-packages/plotnine/stats/smoothers.py:347: PlotnineWarning: Confidence intervals are not yet implemented for lowess smoothings.
/home/sol/venv/lib/python3.10/site-packages/plotnine/stats/smoothers.py:347: PlotnineWarning: Confidence intervals are not yet implemented for lowess smoothings.
/home/sol/venv/lib/python3.10/site-packages/plotnine/stats/smoothers.py:347: PlotnineWarning: Confidence intervals are not yet implemented for lowess smoothings.
/home/sol/venv/lib/python3.10/site-packages/plotnine/stats/smoothers.py:347: PlotnineWarning: Confidence intervals are not yet implemented for lowess smoothings.