20. Maritime Port Activity#
20.1. Summary#
Ports’ normal operations can be affected during a crisis which will ultimately have an impact over the export/import operations of the country. Questions like: How can a crisis disrupt port operations? How can we measure the disruption in the number of vessels, money, exports, and imports affected? Where is the trade going? Which are the ports that will receive more pressure? may arise. This class will teach students how to answer these questions using an open-source dataset developed by IMF.
20.2. Learning Objectives#
20.2.1. Overall goals#
The main goal of this class is to teach students how to assess a crisis impact over the operation of ports.
20.2.2. Specific goals#
At the end of this notebook, you should have gained an understanding and appreciation of the following:
PortWatch dataset:
What is PortWatch.
Which are the available datasets.
How to access the data.
Monitor Chokepoints and Ports:
Learn the methodology for monitoring Chokepoints and Ports.
Generate indicators to reflect the impact of a crisis into ports activity.
20.3. Data#
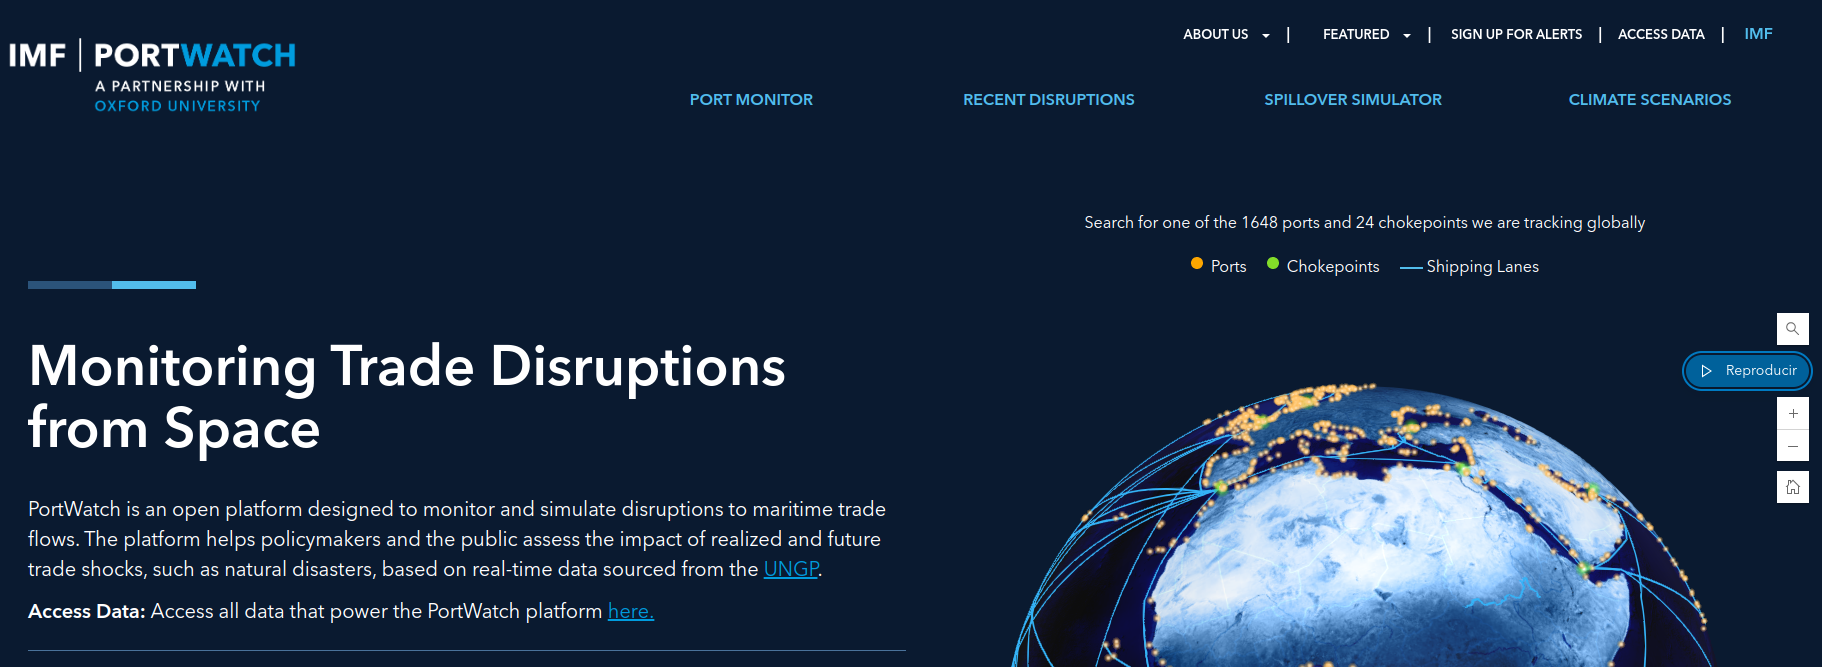
PortWatch is an open platform designed to monitor and simulate disruptions to maritime trade flows. The platform helps policymakers and the public assess the impact of realized and future trade shocks, such as natural disasters, based on real-time data sourced from the UNGP.
The datasets offered are the following:
Daily Port Activity Data and Trade Estimates: Daily port activity and preliminary trade volume estimates for 1,648 ports worldwide.
Daily Chokepoint Transit Calls and Trade Volume Estimates: Daily chokepoint transit calls and preliminary transit trade volume estimates for 24 major chokepoints worldwide.
Ports & Chokepoints: They have classified ports into globally systemic (i.e., important for global supply-chains), regionally systemic (e.g., essential for regional trade integration), and domestically systemic (e.g., important for domestic supply-chains).
Disruptions: Using the Global Disaster Alert and Coordination System (GDACS) service, they collect information on natural disasters (earthquakes, tsunamis, tropical cyclones, floods, volcanic eruptions, or droughts). Other types of disruptions are also included, such as those caused by geopolitical tensions. They intersect disaster areas with ports and chokepoints to identify ports and chokepoints at risk of being disrupted.
Spillover Simulator: The spillover simulator allows users to visualize the potential spillover effects of port disruptions. Users are able to fill in a disruption duration (# of days), which is used to scale the output of the spillover analysis (linearly). The simulator consists of three different types of visualizations, which distinguish the spillover impacts on three different spatial scales: the port layer, the country trade layer, and the supply-chain layer.
Climate Scenarios: The climate scenario analysis allows users to visualize the climate risks to ports and the most critical nodes within the maritime (sub-)network a country depends on. This can be done for the risk at-present, or in the future (2050) under different climate scenarios. The climate scenario analysis consists of two different types of visualizations; one depicting the climate risks and the other one which distinguishes the systemic risks at the country trade layer.
If you want to understand more about how the data is generated, you can explore their FAQs.
20.3.1. Access the Data#
Data can be downloaded or accessed through an API call, which is quite convenient since the portal creates the URL for you.
Go to ACCESS THE DATA.
Select the data set of your interest and press the ACCESS API button.
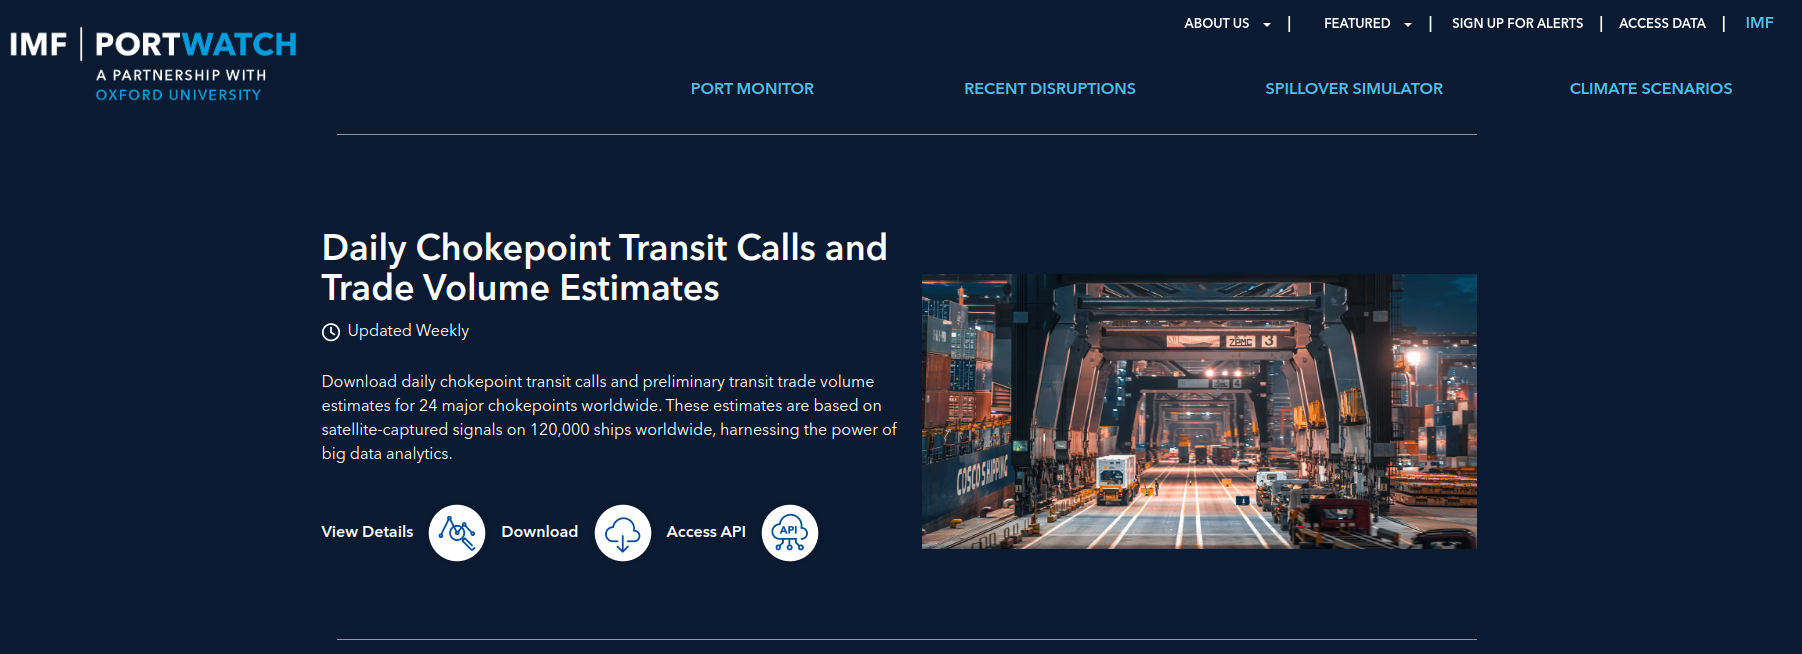
Fig. 20.2 IMF Portwatch API.#
The site provides options to create the API URL and use it for the API call.
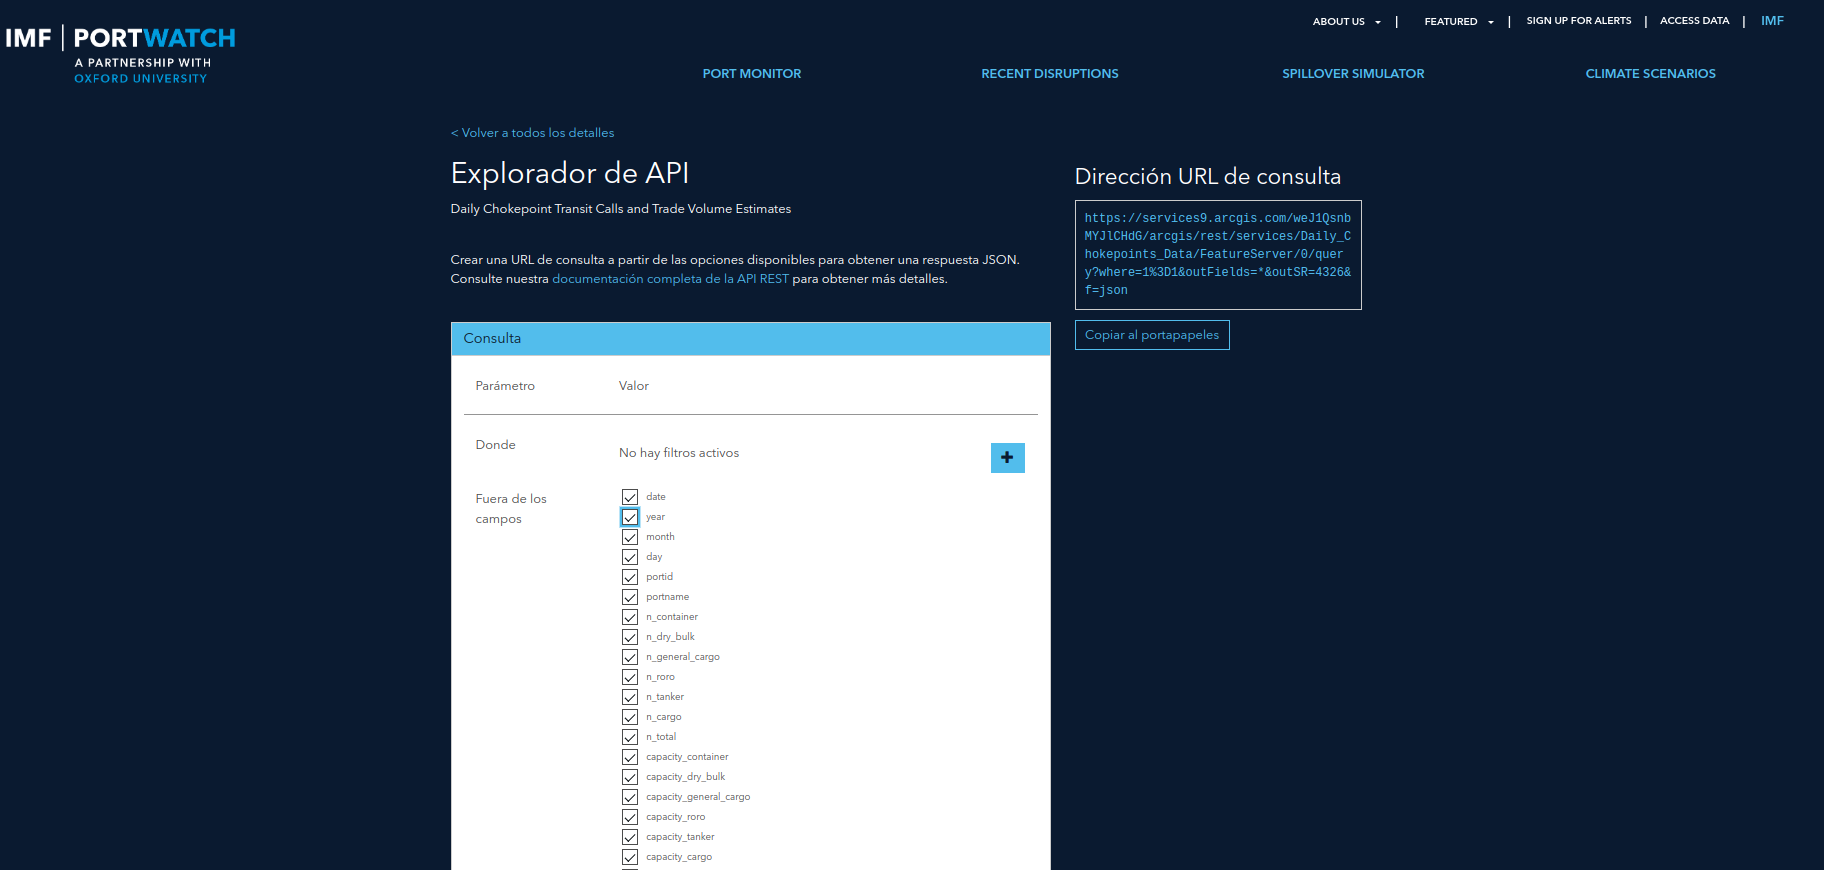
Fig. 20.3 Tool for creating an API URL.#
# !pip install requests geopandas plotnine mizani

import requests
import pandas as pd
import geopandas as gpd
from shapely import Point
from datetime import datetime
import numpy as np
import os
from os.path import join, exists
pd.set_option('display.max_columns', 500)

# For plotting
from plotnine import *
from mizani.breaks import date_breaks
from mizani.formatters import date_format, percent_format, comma_format
import plotnine

plotnine.options.figure_size = (10, 8)
# URL copied from the site
chokepoints_info_url = "https://services9.arcgis.com/weJ1QsnbMYJlCHdG/arcgis/rest/services/Daily_Chokepoints_Data/FeatureServer/0/query?where=1%3D1&outFields=*&outSR=4326&f=json"
res = requests.get(chokepoints_info_url)
df_chokepoints_info = pd.DataFrame([d["attributes"] for d in res.json()["features"]])
df_chokepoints_info.head()
| date | year | month | day | portid | portname | n_container | n_dry_bulk | n_general_cargo | n_roro | n_tanker | n_cargo | n_total | capacity_container | capacity_dry_bulk | capacity_general_cargo | capacity_roro | capacity_tanker | capacity_cargo | capacity | ObjectId | |
|---|---|---|---|---|---|---|---|---|---|---|---|---|---|---|---|---|---|---|---|---|---|
| 0 | 1546300800000 | 2019 | 1 | 1 | chokepoint1 | Suez Canal | 23 | 22 | 14 | 4 | 22 | 63 | 85 | 1.937886e+06 | 9.439567e+05 | 174972.926920 | 46461.102534 | 1.326360e+06 | 3.103276e+06 | 4.429637e+06 | 1 |
| 1 | 1554940800000 | 2019 | 4 | 11 | chokepoint1 | Suez Canal | 18 | 11 | 11 | 5 | 16 | 45 | 61 | 1.394680e+06 | 5.888119e+05 | 87139.404241 | 71594.237388 | 1.099303e+06 | 2.142225e+06 | 3.241528e+06 | 2 |
| 2 | 1546387200000 | 2019 | 1 | 2 | chokepoint1 | Suez Canal | 26 | 4 | 6 | 5 | 10 | 41 | 51 | 2.647842e+06 | 2.389135e+05 | 33158.163236 | 99397.705404 | 6.181574e+05 | 3.019311e+06 | 3.637469e+06 | 3 |
| 3 | 1555027200000 | 2019 | 4 | 12 | chokepoint1 | Suez Canal | 19 | 8 | 4 | 1 | 10 | 32 | 42 | 2.075613e+06 | 5.654068e+05 | 12572.360271 | 19356.464486 | 9.187598e+05 | 2.672949e+06 | 3.591709e+06 | 4 |
| 4 | 1546473600000 | 2019 | 1 | 3 | chokepoint1 | Suez Canal | 12 | 16 | 10 | 3 | 24 | 41 | 65 | 7.566682e+05 | 1.050450e+06 | 81769.437679 | 50061.205601 | 1.069216e+06 | 1.938949e+06 | 3.008165e+06 | 5 |
def api_call(url):
    '''Make an API call and return a GDF'''
    res = requests.get(url)
    df = pd.DataFrame([d["attributes"] for d in res.json()["features"]])
    return df

def create_gdf(data, epsg, lat, lon):
    '''Create a GDF from a csv with lat and lon'''
    geometry = data.apply(lambda row: Point(row[lon], row[lat]), axis = 1)
    return gpd.GeoDataFrame(data, crs = epsg, geometry = geometry)
chokepoints = api_call('https://services9.arcgis.com/weJ1QsnbMYJlCHdG/arcgis/rest/services/PortWatch_chokepoints_database/FeatureServer/0/query?where=1%3D1&outFields=*&outSR=4326&f=json')
chokepoints_gdf = create_gdf(chokepoints, 'EPSG: 4326', 'lat', 'lon')
chokepoints_gdf.explore()