Getting Data
Learning objective
In this lesson we will cover some different ways that you can get input data for GeoE3. This includes automated downloads, or "fetch it yourself and import it". In some cases you will need to research to find indices that are applicable for your study area. By the end of this section you should be able to source data confidently for any country.
Every indicator in the GeoE3 model needs a dataset or a number behind it. There are three distinct ways that data gets into your project:
- Automatic, in-app downloads: GeoE3 fetches it for you, no browser required.
- Manual download and import: you find a dataset on an external website, download it, and load it into QGIS yourself.
- Manual research and entry: for national-level indicators (like workplace discrimination law), you research a published score and type a single number into the plugin.
This page works through each one as a short, self-contained tutorial. Skip to whichever source you need.
Pre-built geodatabases for SIDS countries
If the country you're analysing is one of the Small Island Developing States (SIDS) covered by the World Bank's original GeoWEAF pilot, you may not need to assemble your own data at all: a ready-made geodatabase already exists. The World Bank Gender Spatial data catalogue collects the spatial GDBs for every SIDS pilot country, pre-built for use with this tool.
Tutorial: automatic downloads built into GeoE3
There's another way to get data besides going and fetching it yourself: you can also use the built-in downloader tool, which is based on QuickOSM logic. Click the Download from OSM button inside an indicator's dialog, and it will do a query from OpenStreetMap and fetch down the specific data that indicator needs (childcare facilities, for example, if that's the one you're configuring).
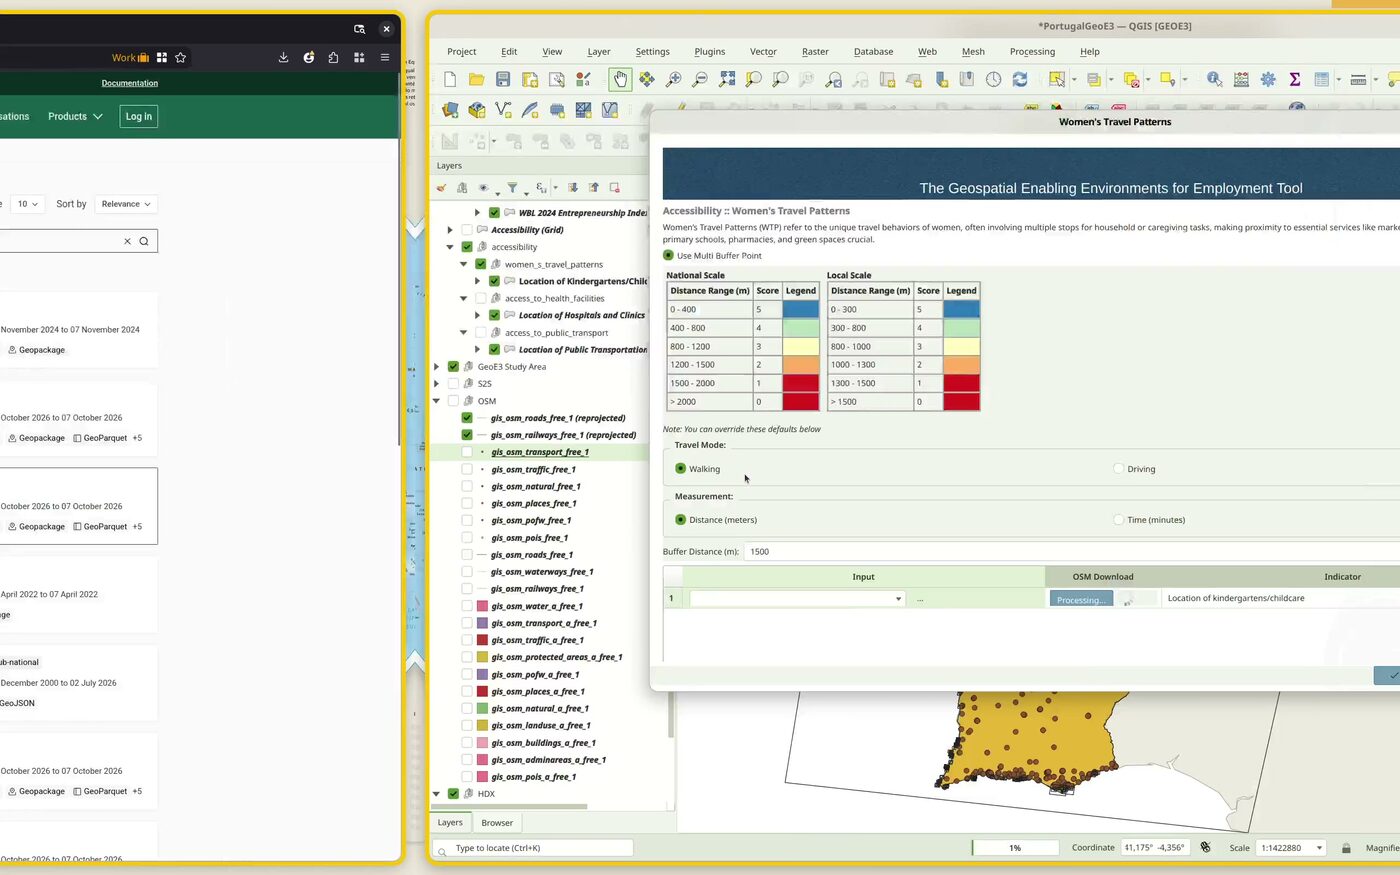
Note
Quite often the servers are busy and it might fail. Keep trying every few minutes until it works for you.
One of the nice things about setting up a project is that if you're doing a regional-scale one, you can also prefetch a bunch of data for your analysis. Tick the box in the setup wizard and click Next, and it's going to go and download a bunch of indicators: a bunch of reference datasets, Space2Stats, that we can use for the analysis.
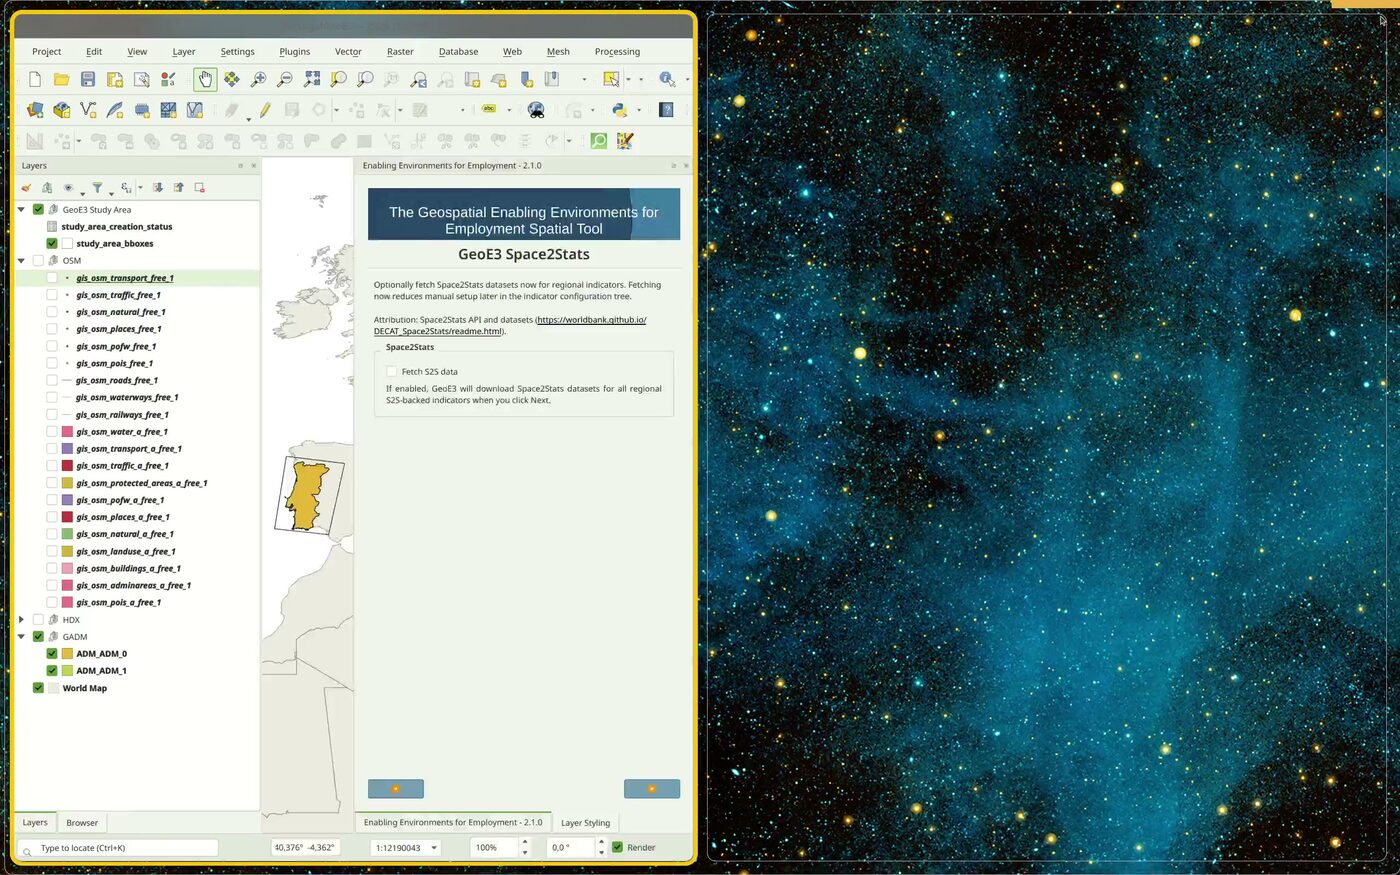
GHSL (Global Human Settlement Layer) settlement/population classification and Ookla open broadband/mobile coverage also get fetched automatically in the background the first time a workflow needs them. There's nothing to click for those.
This whole process is about collecting data, and there are a bunch of different sources you can fetch it from: there's the Space2Stats program, which is World Bank hosted data; there's OpenStreetMap, which you wouldn't normally get straight from OpenStreetMap itself. Instead you'd get it from a service like the Geofabrik service below, or using the QuickOSM downloader tool, or using the button inside of the indicator, which also basically uses QuickOSM underneath the hood. Or you might get it from your national dataset, from whatever your country's official data sources provide.
Tutorial: OpenStreetMap extracts from Geofabrik
For a national or local-scale project, where Space2Stats' regional prefetch doesn't apply, to get busy with actually using the plugin, we need to get some data. What I recommend is to head over to Geofabrik to start off. Geofabrik is an amazing website where they provide extracts from OpenStreetMap for free, and you can just go and download any data you want.
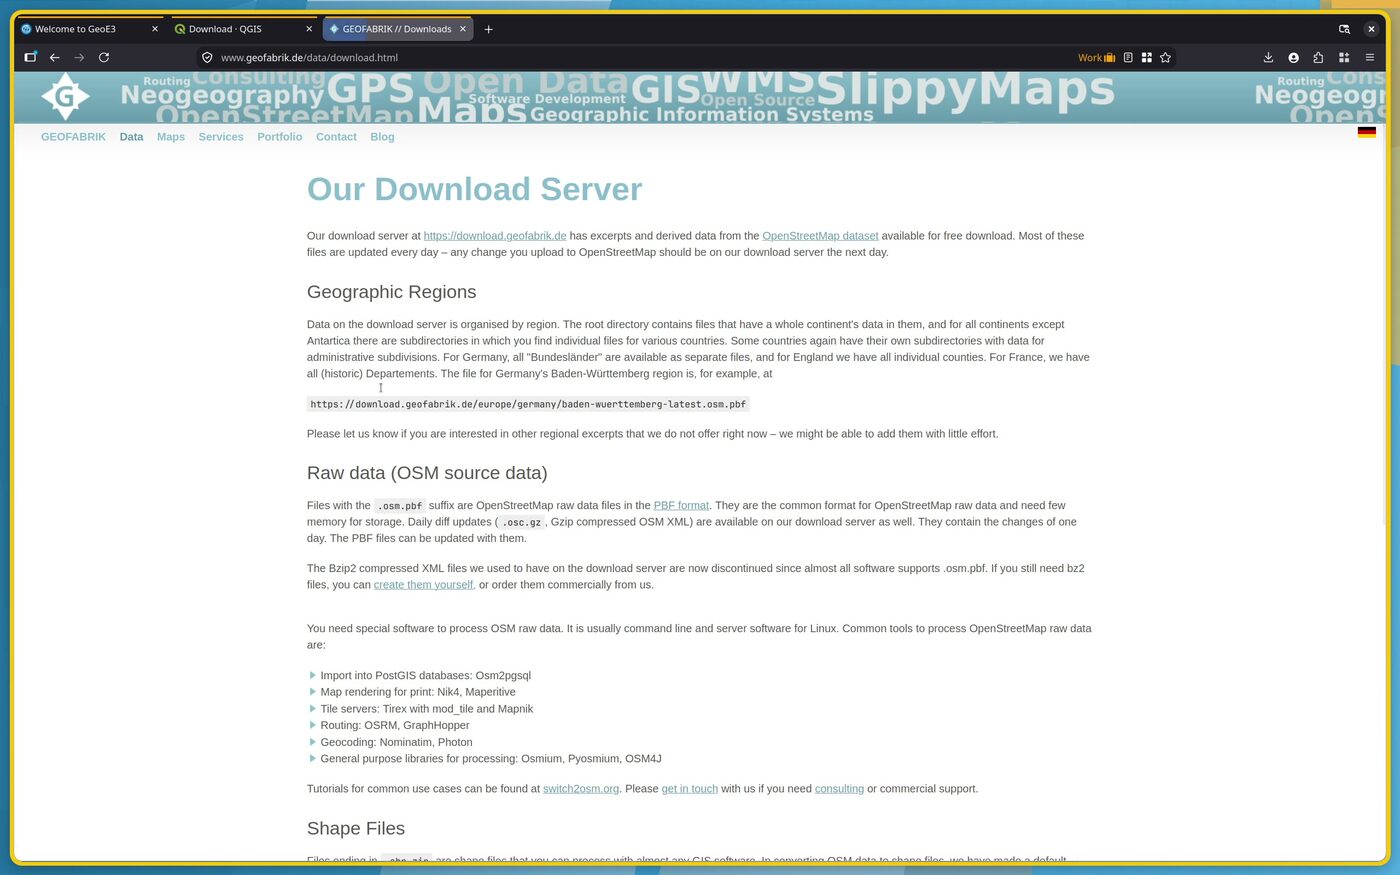
Go to the Geofabrik homepage, then Data, then Downloads. Click the
link at the top and it's split up by regions, so you just start drilling
down to your region: continent, then country (and sometimes there are
sub-regions too, for larger countries). You can download it in different
ways: individual files, or one big file which has got kind of everything
in it. Grab the latest free .gpkg.zip (GeoPackage) if it's offered.
Once it's downloaded, extract it, add it to QGIS, and right-click the
folder in the Browser panel → Add as a Favorite, which will make
it easy to work with the data in that folder going forward.
The geopackage is more convenient because you get everything in one single file. You don't have a lot of files all over your hard drive to keep track of. But if there's an error in the file, you can go to plan B, which is to download the shapefiles instead, or use GADM (below) for boundaries specifically.
Tutorial: official administrative boundaries from GADM
Sometimes the admin boundary you get from OpenStreetMap or HDX still isn't quite what you want. It might include the coastal maritime area rather than the land boundary you need, or the highest level available might not be the one you're after. If you don't have what you want yet, the next option is to use GADM boundaries.
You could search just for "[your country] official boundary" and see if you can find it published by an official source. That's often difficult to do, though if you're working in your own country, maybe you're already familiar with where to get the official data. I happen to know about GADM:
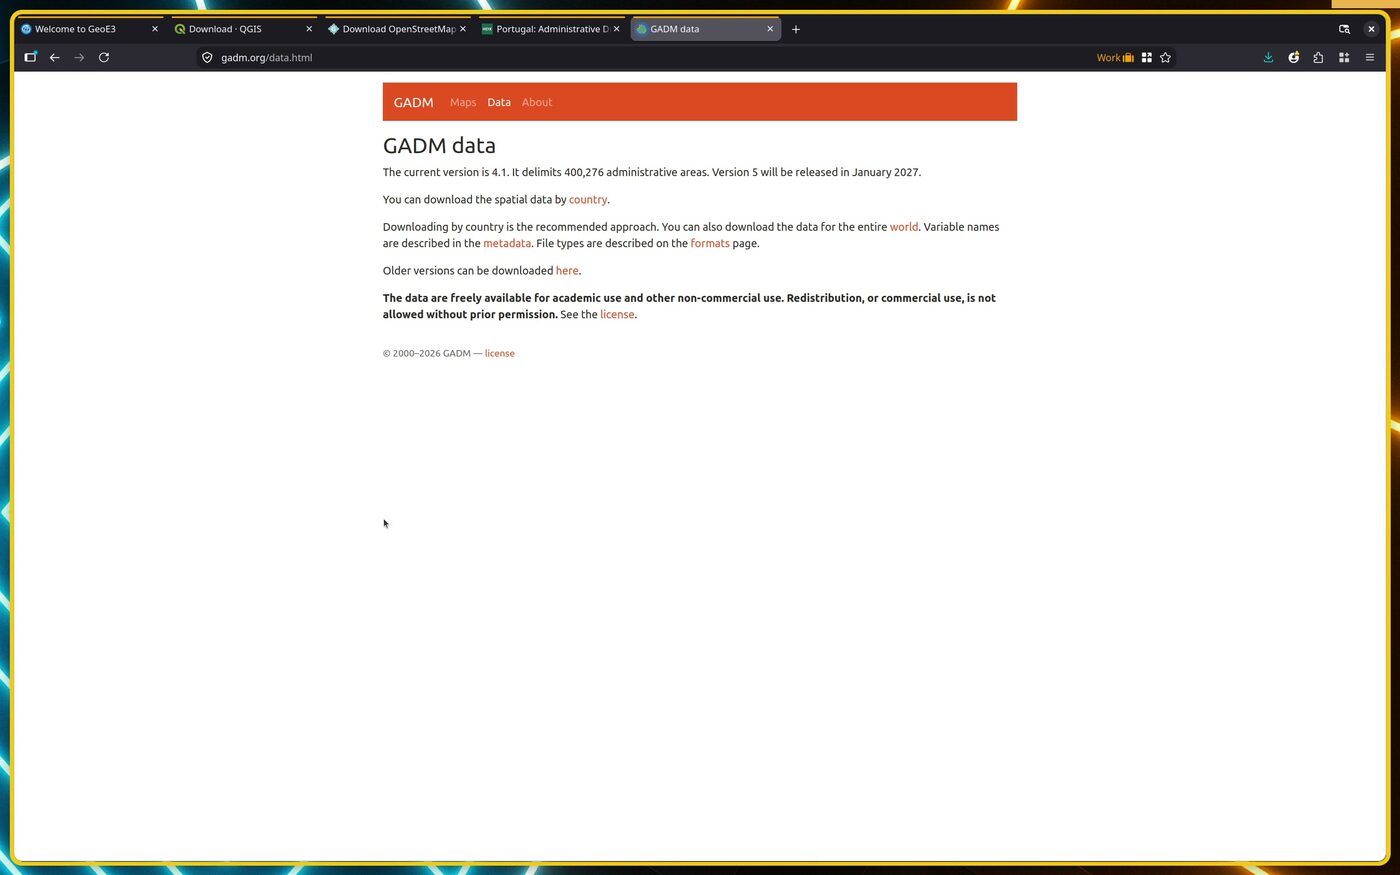
Here you can also download data by country. Choose yours, and again, you
can get a geopackage, which is always nicer. It contains one layer per
administrative level (ADM_0 for the national boundary, ADM_1 for the
first subdivision, and so on), finally what we need.
Check the license before you redistribute anything
GADM data is free for academic and non-commercial use. Redistribution or commercial use needs permission from GADM first. See their license page before you publish an analysis built on it.
Tutorial: Humanitarian Data Exchange (HDX)
Another common source of data is the Humanitarian Data Exchange, HDX for short. GeoE3 does not query it automatically. This is a manual browse-and-download source, the same as Geofabrik or GADM. Punch in your country and you'll see a range of interesting-looking datasets: health, population, airports, railways, buildings, education. Some of these will be useful for you, but you want only the geospatial data, so filter on geodata to narrow it down.
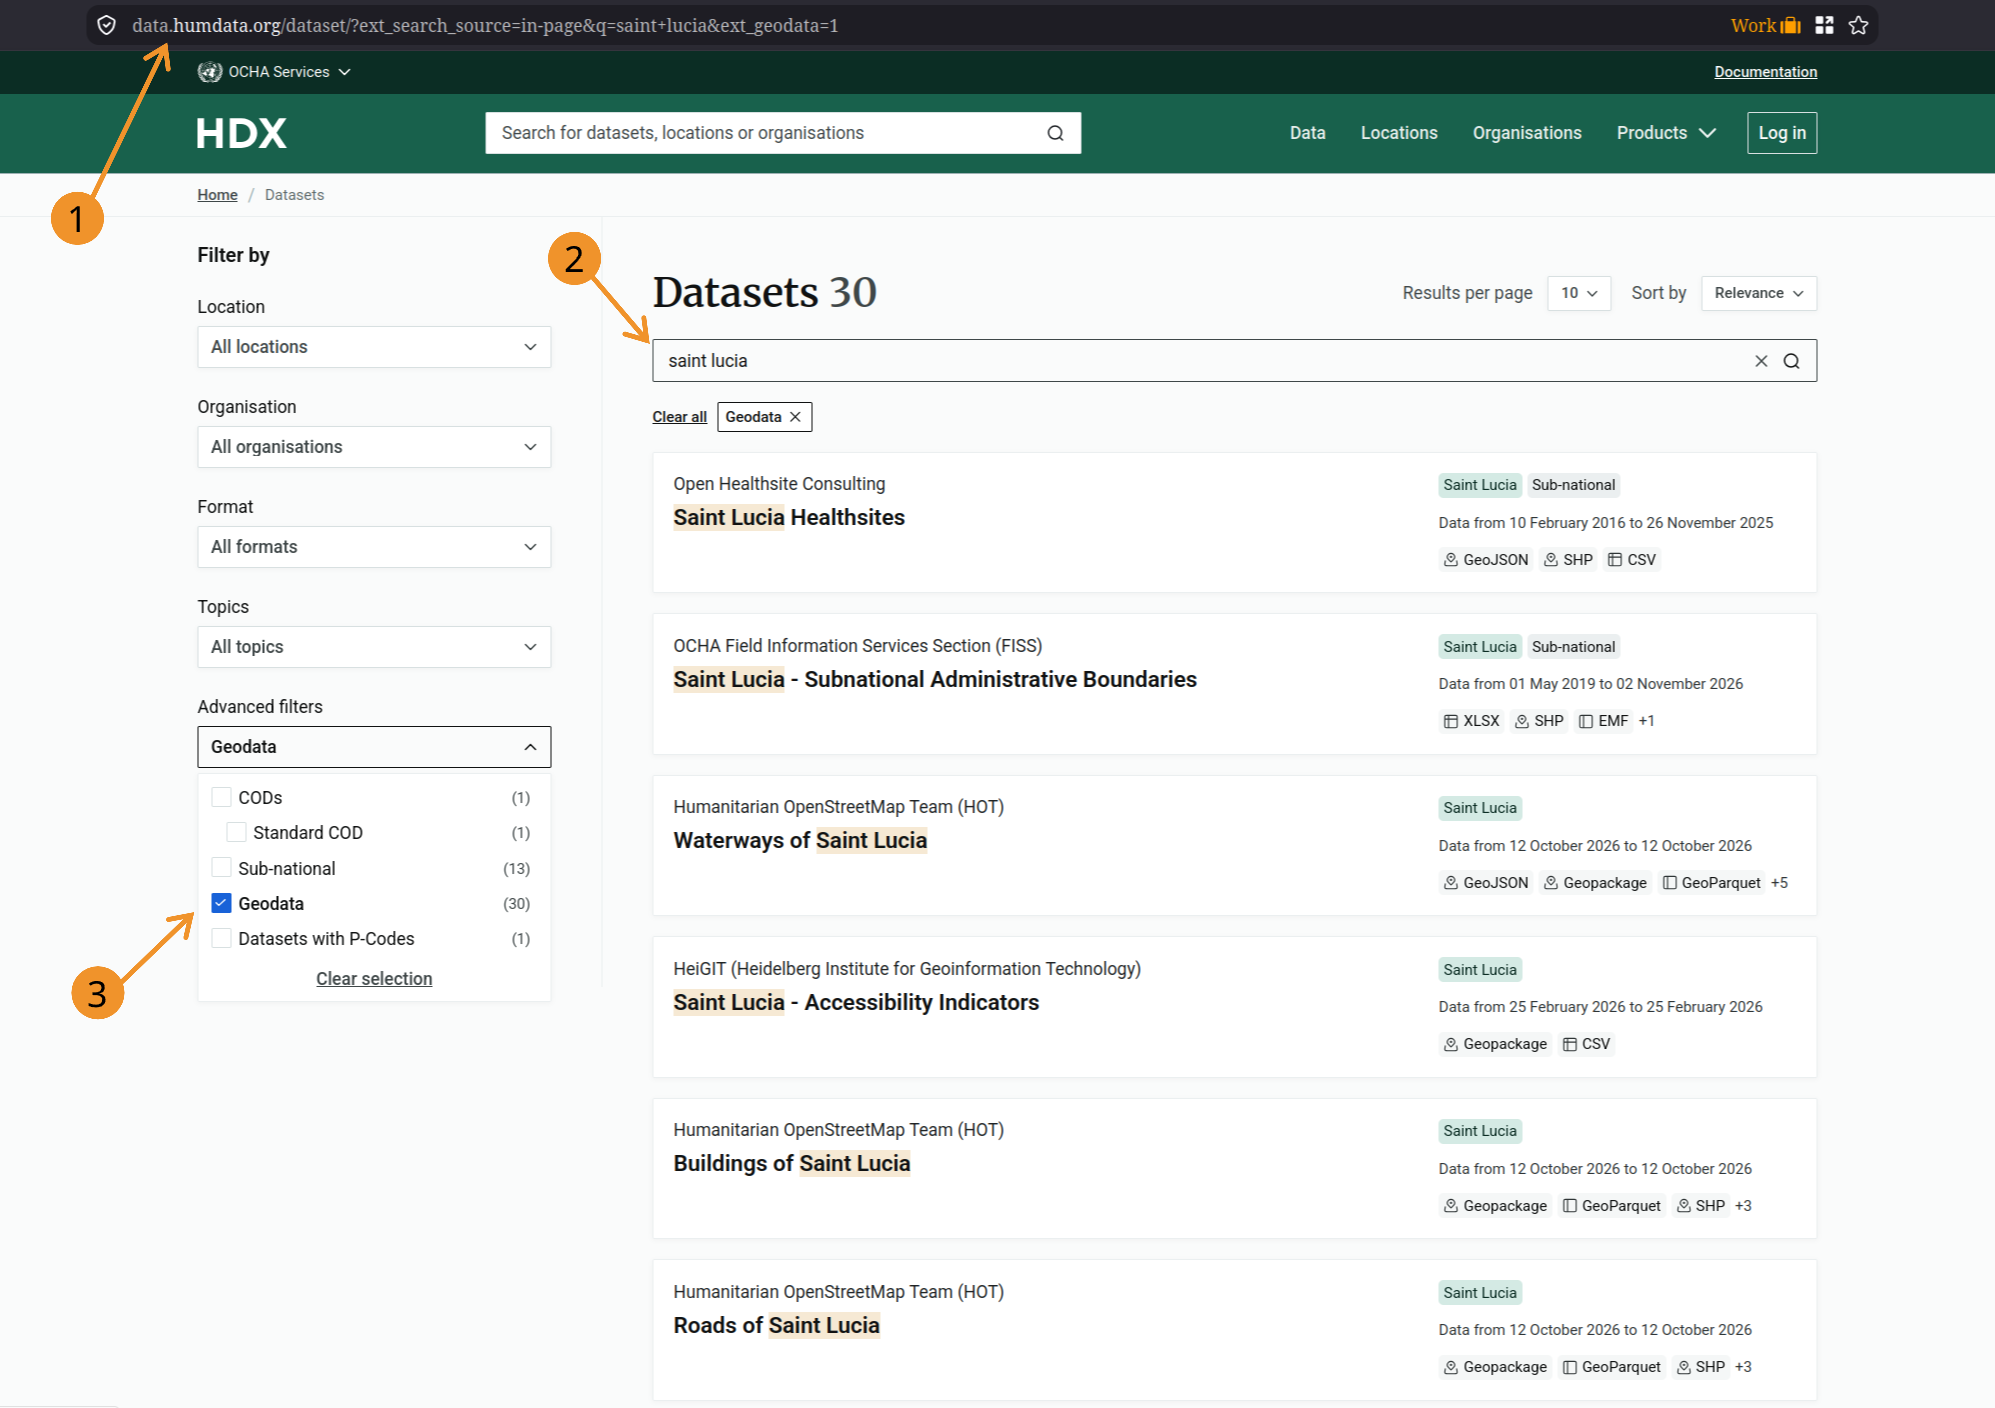
For example, health facilities is going to be one of the things you're interested in for the Accessibility dimension. Since it's there on HDX, grab it. (The source is still coming from HDX, though it looks like they get it from HOT OSM.) Open the dataset page, scroll to Data and Resources, and download the shapefile or GeoPackage.
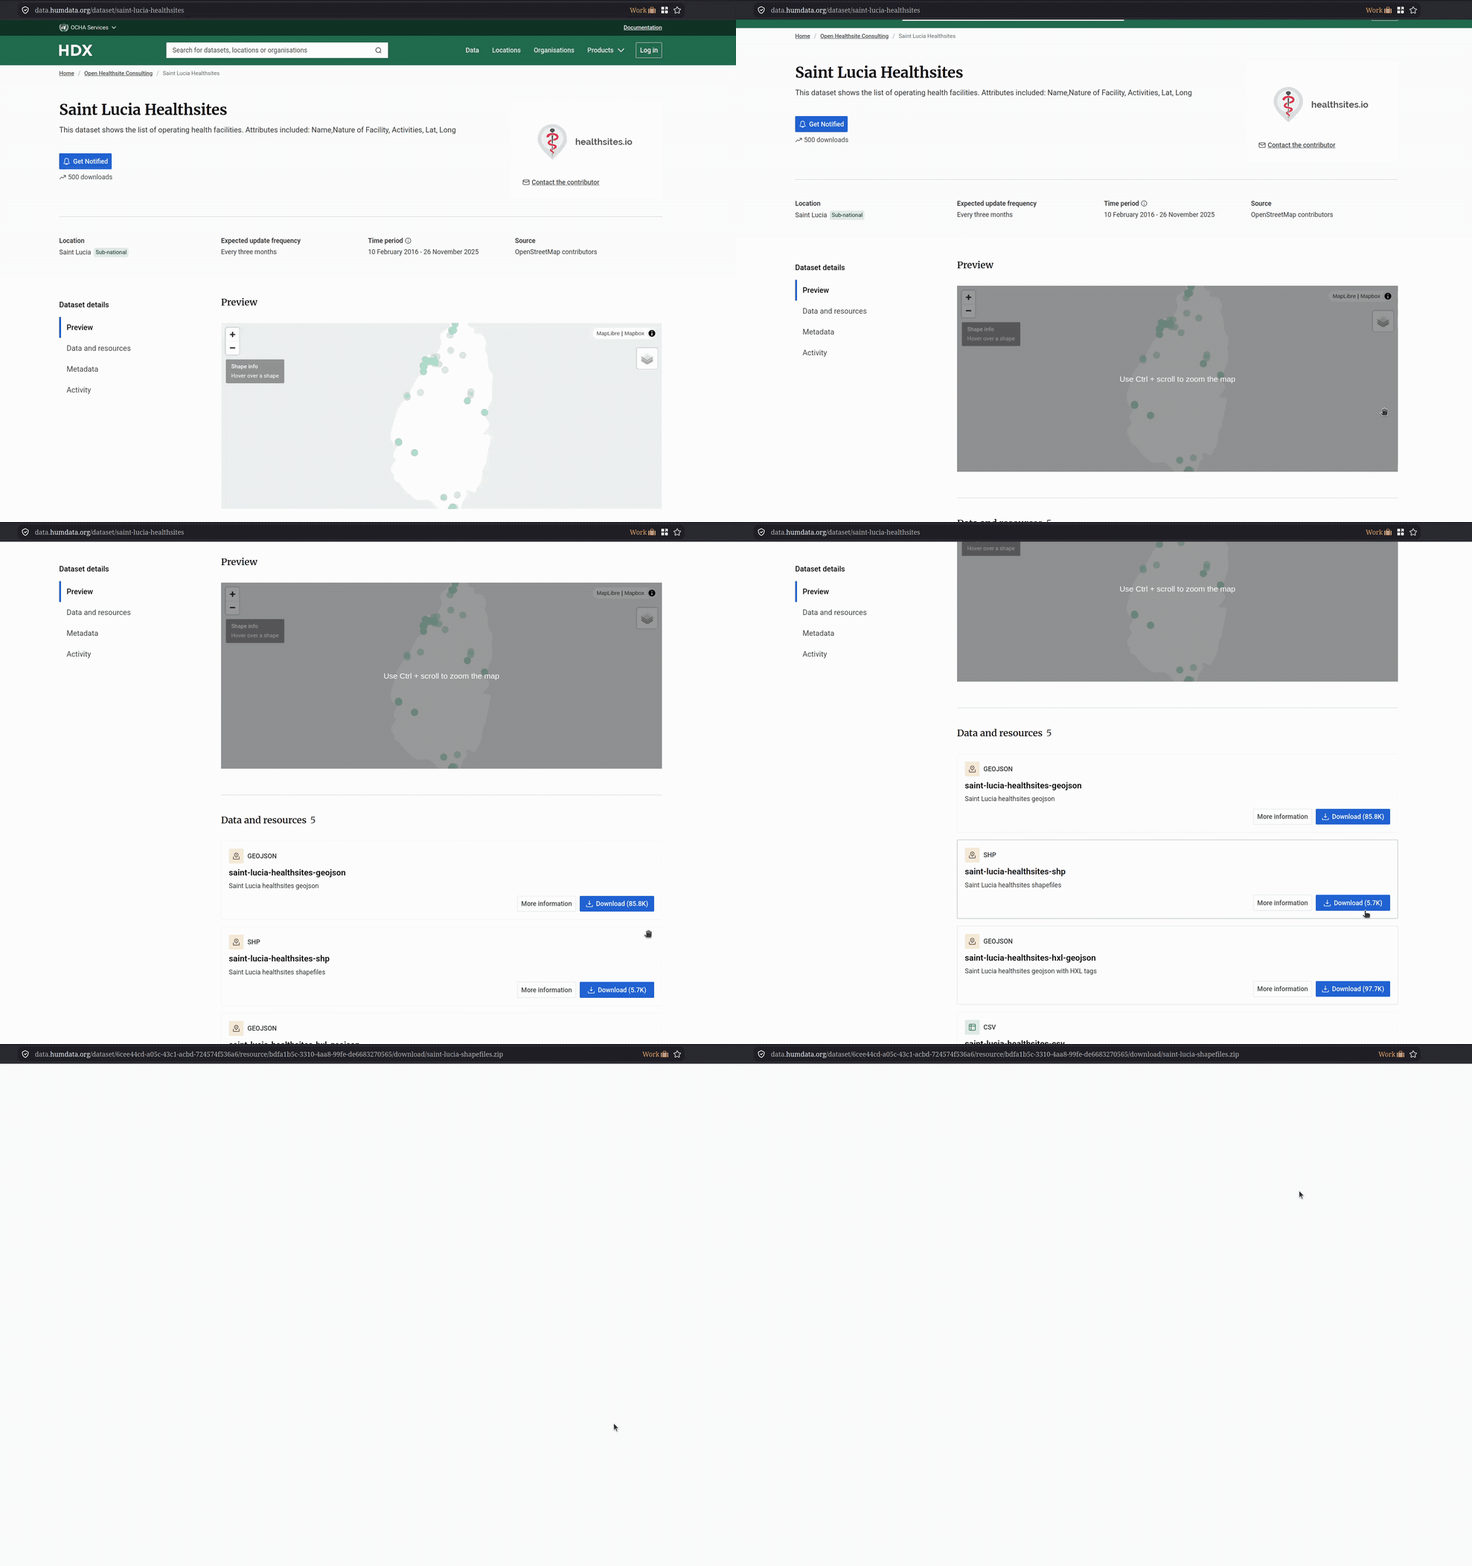
HDX is a good first stop for health facilities and some administrative boundary sets, but coverage varies a lot by country. If it doesn't have what you need, fall back to the in-app OSM downloader or Geofabrik.
Tutorial: population data from WorldPop
If you want to introduce population into your results (see Configuring Items) and you already ticked Fetch S2S data during project setup, you likely already have a Space2Stats population layer and can skip this. If not, getting it is its own little side quest.
There are various places to get population data. You can go to the Humanitarian Data Exchange, ideally looking for the group you're trying to foster enablement for (women's census population, say), though it's not always there as a clean geospatial layer. Failing that, go to WorldPop. WorldPop is an open data initiative for providing population data for around the world.
Under national boundaries you can download the total population for a given year. But if you want more, you can also get the demographic breakdown: go to Age and sex structures and you can get individual countries from there.
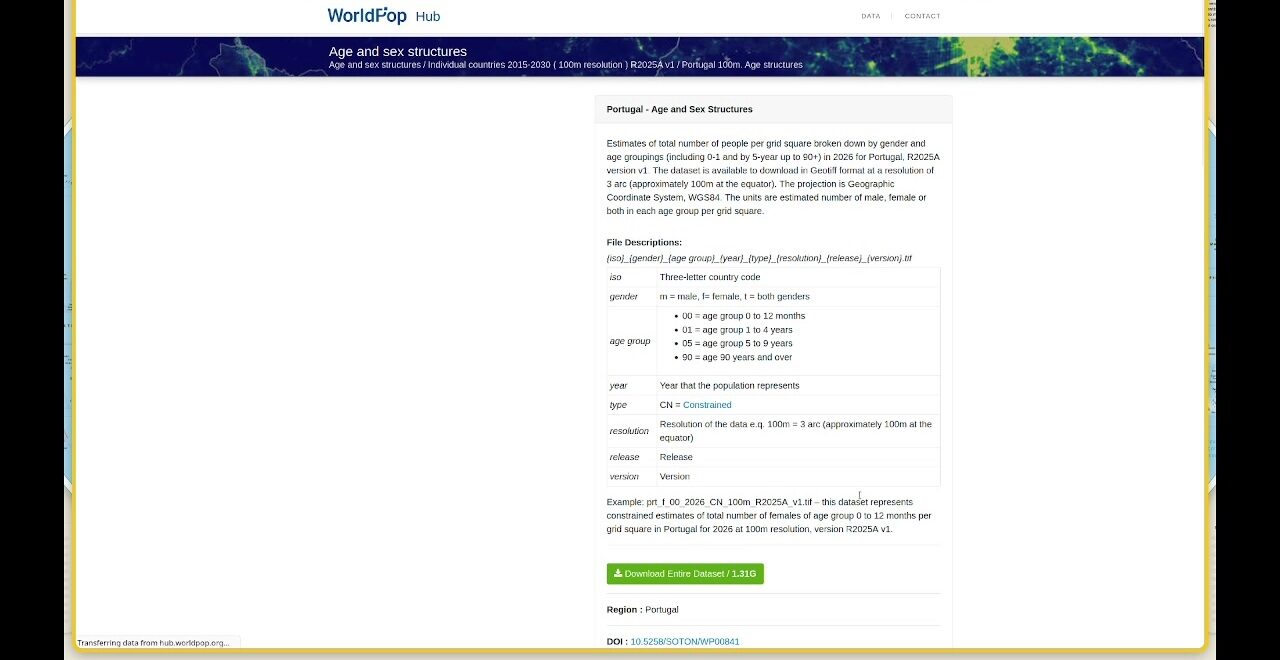
The filename encodes exactly what's inside it: country code, gender, age band, year and resolution. You can tell at a glance which file has, for example, working-age women.
Tutorial: manual national index-score entry
This class of indicators (the four Contextual-dimension factors: EPLEX Score, Workplace Discrimination, Regulatory Frameworks and Financial Inclusion) is calculated using a national score. It assigns one number to the whole dataset based on, for example, what the workplace discrimination environment is like. You need to do your research, find out for your country what level of enablement there is in the legislation, and if it's highly enabling, for example, you'd give it a 95 or plus; if it's some order below that, you'd give it a rating as appropriate.
The table below gives a worked Saint Lucia example and the general sources to use for any other country. If you'd rather skip the lookup entirely, Contextual Dimension lists the Workplace Discrimination, Regulatory Frameworks and Financial Inclusion default score for every country in one table.
Data sources used for the Saint Lucia example
| DIMENSION | FACTOR | LAYER | DATA SOURCE/QUERY |
|---|---|---|---|
 CONTEXTUAL |
 Workplace Discrimination |
WBL 2024 Workplace Index Score | WBL 2024 index score |
 Regulatory Frameworks |
WBL 2024 Pay+Parenthood Index Score | WBL 2024 index score for Pay and Parenthood | |
 Financial Inclusion |
WBL 2024 Entrepreneurship Index Score | WBL 2024 index score for Entrepreneurship | |
 EPLEX |
The Employment Protection Legislation Index | EPLEX Score | |
 ACCESSIBILITY |
 Women's Travel Patterns |
 Location of kindergartens/childcare |
Humdata or OSM |
 Location of primary schools |
Humdata or OSM | ||
 Location of groceries |
OSM | ||
 Location of pharmacies |
OSM | ||
 Location of green spaces |
OSM | ||
 Access to Public Transport |
Location of public transportation stops, including maritime | OSM | |
 Access to Health Facilities |
Location of hospitals and clinics | Humdata or OSM | |
 Access to Education and Training Facilities |
Location of universities and technical schools | Humdata or OSM | |
 Access to Financial Facilities |
Location of Banks and other financial facilities | OSM | |
 PLACE CHARACTERIZATION |
 Active Transport |
Location of street crossings | Mapillary or OSM |
| Location of cycle paths | OSM | ||
| Location of footpaths | OSM | ||
| Block Layout | OSM | ||
 Safety Perception |
Street lights/Nighttime lights | Mapillary or NTL | |
 FCV |
ACLED data | mail for ACLED data | |
 Education |
Share of graduates by field, female (%) | WB data | |
 Digital Inclusion |
Individuals using the Internet (% of population) | WB data | |
 Environmental Hazards |
Global Natural Hazards Data |
General Data Source: Fires | Flood | Landslides | Tropical Cyclones | Drought |
|
 Water Sanitation |
Water points | Mapillary or OSM |
General sources for other countries
While the table above is specific to Saint Lucia, the same kinds of sources exist for most countries:
- World Bank, Women, Business and the Law (WBL): indices on workplace discrimination, regulatory frameworks and financial inclusion.
- ILO EPLEX: employment protection legislation index.
- UNDP: gender equality, economic participation and sustainable development metrics.
- National statistics offices: gender-disaggregated data for contextual and accessibility indicators.
- OpenStreetMap: locations of facilities for accessibility and active-transport indicators (via the in-app downloader, Geofabrik, or overpass-turbo.eu directly).
- Humanitarian Data Exchange (HDX): schools, health facilities and other infrastructure.
- World Bank environmental hazards catalogue: fire, flood, landslide, cyclone and drought layers.
- Mapillary: crowdsourced street-level imagery, useful for street crossings, sidewalks and public lighting where OSM coverage is thin.
- VIIRS Nighttime Lights (NTL): a proxy for safety perception where no dedicated safety-perception dataset exists.
Data attribution
GeoE3 pulls from whichever external datasets and services your workflow and inputs actually use: typically some combination of OpenStreetMap, OpenRouteService, GHSL (European Commission JRC), Ookla Open Data, Space2Stats, ACLED and VIIRS Nighttime Lights. When you publish or share an analysis, check and include the attribution, citation text and license/terms for whichever of these you actually used. They're not all the same license.
Recap
- GeoE3 gets data three ways: automatic in-app download (OSM, Space2Stats, GHSL, Ookla), manual download-and-import (Geofabrik, GADM, HDX, WorldPop), and manual research-and-entry (the four Contextual factors).
- For a regional-scale project, ticking Fetch S2S data during project setup covers most of your data needs in one step.
- For national or local-scale projects, you'll do more manual sourcing: Geofabrik for OSM extracts, GADM for clean admin boundaries, HDX and WorldPop for everything else.
- Check data licenses before you redistribute results. GADM in particular restricts commercial/redistribution use without permission.