WORLD BANK GROUP · GEOE3
Map where places enable or block economic access
A QGIS plugin that scores any landscape against factors that enable or limit access to the economic activity, so you can see exactly where to invest to close the gap.
Welcome to GeoE3
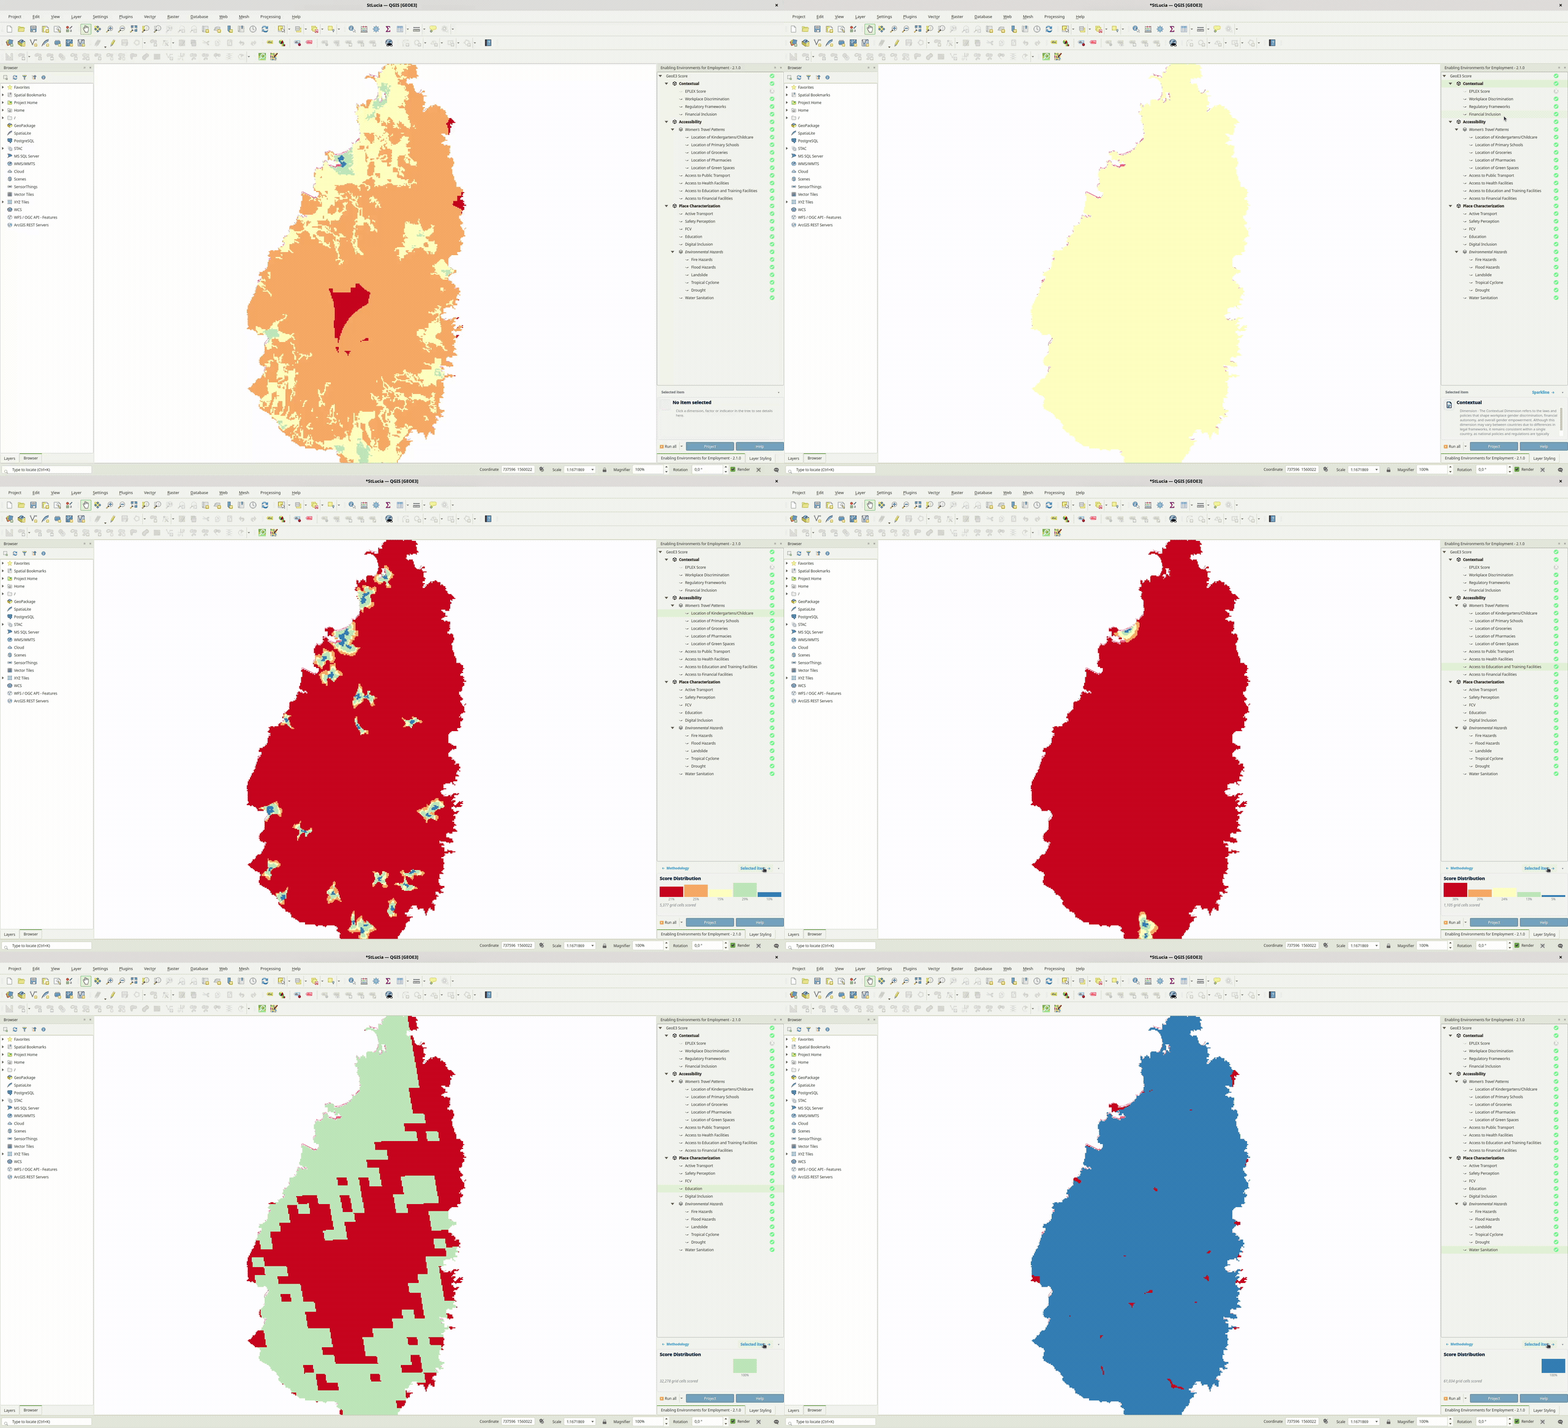
Developed by the World Bank, GeoE3 (The Geospatial Enabling Environments for Employment Spatial Tool) is a powerful and user-friendly open-source spatial mapping tool that enables a comprehensive analysis of how various spatial factors influence employment and business opportunities in any geographic area of interest.
By using this tool, you can identify key areas for intervention, make data-driven decisions, and ultimately work toward creating more equitable job opportunities for people across different regions.
What it is
GeoE3 is the practical, in-QGIS implementation of the World Bank's GeoWEAF framework. It combines contextual, accessibility and place-characterization data (childcare, safety, transport, digital inclusion, environmental hazards and more) into a single enablement score for every cell of a study area.
Run it against a city, a region or a whole country. The output tells you two things: where conditions already support women's employment, and which specific missing piece of infrastructure would raise the score where it's weakest. That could be a clinic, a bus route, or broadband.
What's in the box
-
Three scored dimensions
Contextual, Accessibility and Place Characterization factors combine into one enablement score per cell, fully auditable back to its inputs.
-
Built-in data collection
OpenStreetMap, GHSL settlement data and Ookla broadband coverage download straight into the project automatically. No manual GIS prep required.
-
Insights that drive investment
Combine population distribution with enablement scores to flag the highest-impact places to act.
-
A standard QGIS plugin
Installs from the QGIS Plugin Manager like any other plugin. Nothing bespoke to compile or configure.