
Dimensions vs separate indicators
Worked example: SI.POV.DDAY is a single indicator with no breakdown dimensions in the CSV — one indicator ID per project.
When an indicator can be disaggregated (for example by sex, age group, or urban/rural area), organizations choose one of two data organization patterns.
Option 1 — Separate indicators
Each disaggregation is a different indicator with its own identifier.
Example: population by sex as three indicators — "Population, total", "Population, male", and "Population, female". Each has its own indicator ID column value; typically one indicator project per ID.
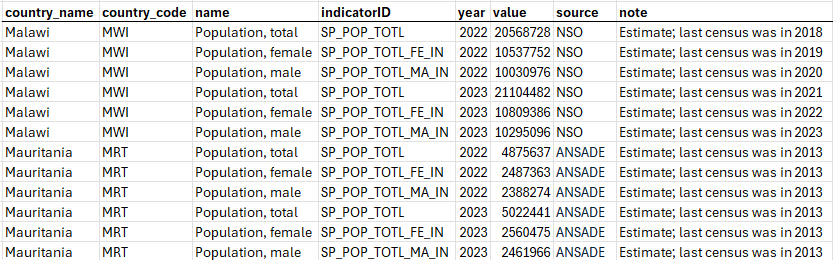
SI.POV.DDAY follows this pattern: one indicator ID (SI.POV.DDAY), no dimension columns in the long CSV.
Option 2 — One indicator with dimensions
A single indicator ID with dimension columns in the long-format CSV (for example SEX with values M, F, T).
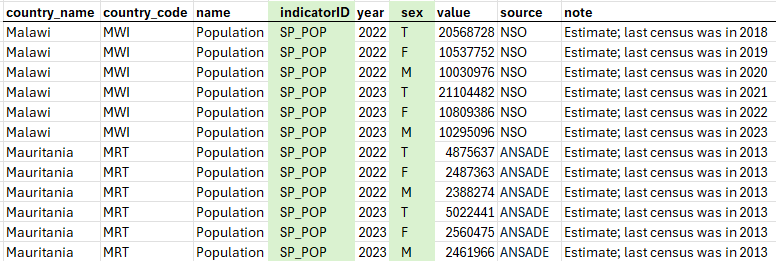
In the data structure, dimension columns use column type Dimension and are usually linked to codelists. See Column types.
Choosing a pattern
| Consideration | Option 1 (separate indicators) | Option 2 (dimensions) |
|---|---|---|
| Catalog discovery | Simpler — one catalog entry per series | Fewer catalog entries; users filter by dimension |
| Number of projects | More indicator projects | Fewer projects |
| Complex cross-tabs | Many indicators (for example 90 combinations) | One indicator with multiple dimension columns |
Example where dimensions are often necessary: population by age group (9 groups + total), sex (2 + total), and urban/rural (2 + total) would require 10 × 3 × 3 = 90 separate indicators under Option 1. A single "population" indicator with three dimension columns is more maintainable.
Reference metadata vs DSD
- Prefer documenting breakdowns in the bound data structure (structural metadata).
- The reference metadata
Dimensionselement is for cases when a DSD is not documented. When a DSD is attached, dimensions are defined by structure components. See Reference metadata — Dimensions.