Geospatial data management practices#
Geospatial data needs are driven by information needs, which vary based on the situation, the agency, and the country. This translates into variation in terms of required data, accuracy, timeliness, and attribution. In addition, humanitarian actors often work in a reactive mode, therefore, the collection and harmonization of data happens just before or just after an emergency. In this section, several data management and data handling practices are investigated as implemented by different agencies. The goal is to understand how agencies manage and collect data in order to better understand the roadblocks and bottle necks in the process.
UN Data Scramble#
UN OCHA leads the Coordinated Data Scramble (CDS). There is no fixed set of people to be involved in this process, but OCHA recommends involving local and remote responders and to include representatives from all UN, NGO, and local authorities. During the process, the team discusses the data needs, assesses available sources, and identifies the best available data for each information need. The body where improvements of current data handling practices are discussed is the Global Information Management Working Group IMWG, chaired by OCHA, the Data Sub-Group responsible for the improvement of the Common Operational Datasets, and the GIS Sub-Group.
“Slow Data Scramble” project by MapAction#
The problem with the CDS is timeliness: if data collection and harmonization starts at the onset of a crisis, map production and geospatial analysis has to leverage existing data, on short timelines. This leads to sub optimal results driven by holes in data quality and availability, many of which could be improved by working on the problem before the crisis. MapAction has proposed a solution to automate the production of nine “core” map products for use in humanitarian disasters called the “slow data scramble”. The ambition is to “fundamentally change the way we approach map creation in the humanitarian sector in the future”. The project identified 23 data layers needed to make these core map products, the slow scramble comprises identifying sources for each data item and developing a more thorough understanding of the holes and limitations of those data sources.
Humanitarian Data Exchange#
The Humanitarian Data Exchange platform HDX is run by UN-OCHA. It serves as a data exchange where humanitarian actors upload data that might be helpful to others. Currently, HDX contains over 18000 entries. While only 197 items are flagged as Geodata, ~8000 items appear to be geolocated, as indicated by their file format. This is indicative of the lack of quality-control and detailed metadata in HDX, which is both a drawback and a feature. HDX explicitly does not enforce data standards on the platform, as requirements to reformat the data prior to sharing would discourage users. Instead, HDX encourages the use of the Humanitarian Exchange Language HXL, a low-barrier standard, which consists of adding additional alias names from a defined namespace to each column in a table. The lack of enforced standards makes depositing data a simple process, which encourages uptake; however, the lack of quality controls makes searching, assessing and using data a difficult process. We looked more closely at the geospatial data items in HDX as identified by their file extension. 62 organizations have uploaded geospatial data into HDX, but the majority (90%) of data comes from only five providers:
The Humanitarian OpenStreetMap Team (HOT) uploaded over half of the 7802 data items. These consist of extracts from OpenStreetMap, optimized for the needs of the humanitarian community.
WorldPop contributes 14% of the datasets which show population or demographics data, as a grid, or aggregated to COD admin units.
UN-OCHA (we combined the numbers for the individual regional OCHA offices) uploaded 626 or 8% of the data items, out of which 511 are CODs.
UNOSAT contribute 7% of the datasets which mostly contain satellite detected water extents during flood events, satellite image derived damage assessments, and a few other analyses based on satellite imagery.
Food prices, food security indicators, flood hazard data, land degradation, and a variety of further layers are provided by WFP; these data make up 5% of the geospatial items in HDX.
The remaining geospatial data coming from 57 other organizations make up only ~10% of all geospatial data items in HDX.
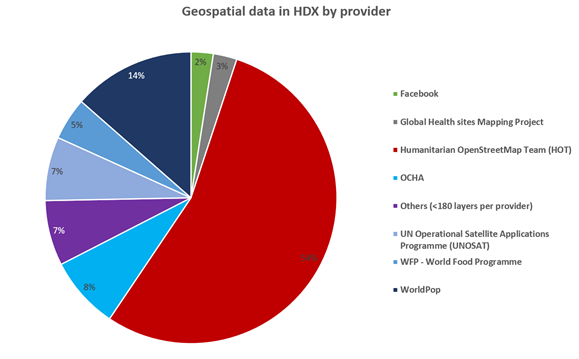
Fig. 2 Relative share of geospatial data items in HDX by provider#
To assess the completeness of the data available on HDX we assigned each dataset to a thematic cluster according to the UN cluster system. We further classified the data into three scales:
local data - describing the infrastructure of a refugee site
regional data - covering a sub-national scale
national scale - national level coverage, such as administrative boundaries
Completeness of HDX Data Grids#
HDX actively curates a subset of their data, which they consider essential. This subset, called Data Grids, contains 27 data layers; this list is similar, but slightly different to the list of priority data items assembled by ACAPS for the Coordinated Data Scramble. HDX continuously monitors the completeness of these items in HDX. The datasets must be at a sub-national scale (admin1 or finer), have a broad geographic coverage (be available for the entire country, where relevant), and be timely. Data in HDX are evaluated for completeness of both attributes and geographic coverage | | Attributes | Coverage Complete | at least one dataset is found that fulfills all criteria | Has comparator for assessment and matches that assessment Incomplete | at least one dataset on HDX partly fulfills partly these criteria | Has no comparator or does not match expectation No Data | no datasets available | no datasets available
For example, crowd-sourced data like OSM is marked as “incomplete” as the geographic coverage lacks truth to compare. A similar, but slightly more complex measure for data completeness to the one employed by HDX is proposed by van den Homberg et al. (2018). Overall, 51% of the HDX data grids are complete, 24% are incomplete, 25% are missing (Figure 4).
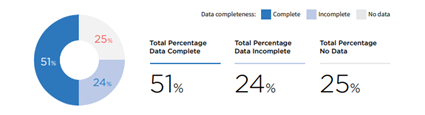
Fig. 3 Overall completeness of Data Grids in HDX. From State of Open Humanitarian Data 2021 (humdata.org)#
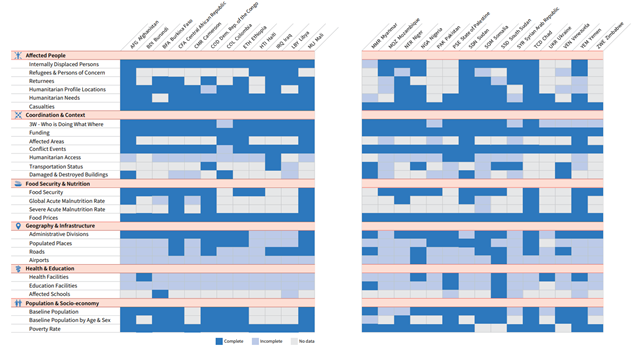
Fig. 4 Completeness of HDX Data Grids by category and country#
OpenStreetMap#
The large number of uploads of OpenStreetMap data into HDX shows the importance of OSM for the humanitarian community. The data in OSM might not always be complete, or authoritative, but it is easily accessible and free of charge; making it the first choice for many information products. The consistency of OSM data and schema make it possible to develop tools and products that can be published consistently around the globe leveraging OpenStreetMap. However, the homogeneity of data quality and coverage makes assessments difficult. Despite its limitations, the humanitarian and development community should continue to contribute to OSM whenever possible; which happens in a number of ways:
The promotion of voluntary mapping from satellite images via Missing Maps. Missing Maps organizes campaigns in which volunteers map specific locations from satellite images. These activities mostly address features that can be identified in satellite imagery, such as building footprints, streets, water bodies, and landcover/land use. Sometimes, the local OSM community is involved to collect points of interest on the ground, but this is not always the case.
Humanitarian OpenStreetMap Team - a non-profit organization that promotes the use of OSM for humanitarian and development applications, by organizing community mapping campaigns, giving trainings, and developing tools for the humanitarian community. These tools include the tasking manager used by Missing Maps and others to organize mapping campaigns, but also tools to export data relevant for the humanitarian context, as well as tools to explore the completeness of the OSM data.
Open Cities Africa - the aim of this project was to build up local OSM communities who then map not only building footprints, streets and water bodies, but collect all kinds of geospatial information on the ground. This includes drainage canals and various points of interest. The decision what to collect and how to structure the data (the data model) was developed by the local stakeholder in each of the 12 involved cities. According to the WB contact we interviewed about this, approximately 75% of the data to collect was the same everywhere, but local differences required the data model to adapt. In Open Cities Africa, a large part of the data model was based on the [model developed](https:\raw.githubusercontent.com\hotosm\RamaniHuria\master\data model\Data Model and Tagging.pdf) by the community-based mapping project Dar Ramani Huria in Dar es Salaam, Tanzania.
To overcome the challenge of locally different data models in use for refugee site mapping in OSM, UNHCR tasked CartONG with analyzing the data models de facto in use, and to engage with the OSM community to develop and promote a unified data model for features relevant for UNHCR. An overview of which tags are in use either officially or de-facto is found on a dedicated wiki page of the OSM documentation. CartONG also works on procedures to export features from UNHCR’s internal database of refugee site infrastructure into OSM, and to combine OSM data and UNHCR data in local copy of OSM at UNHCR; both requires identifying the correspondences between OSM tags and UNHCR attributes.