Central African Republic#
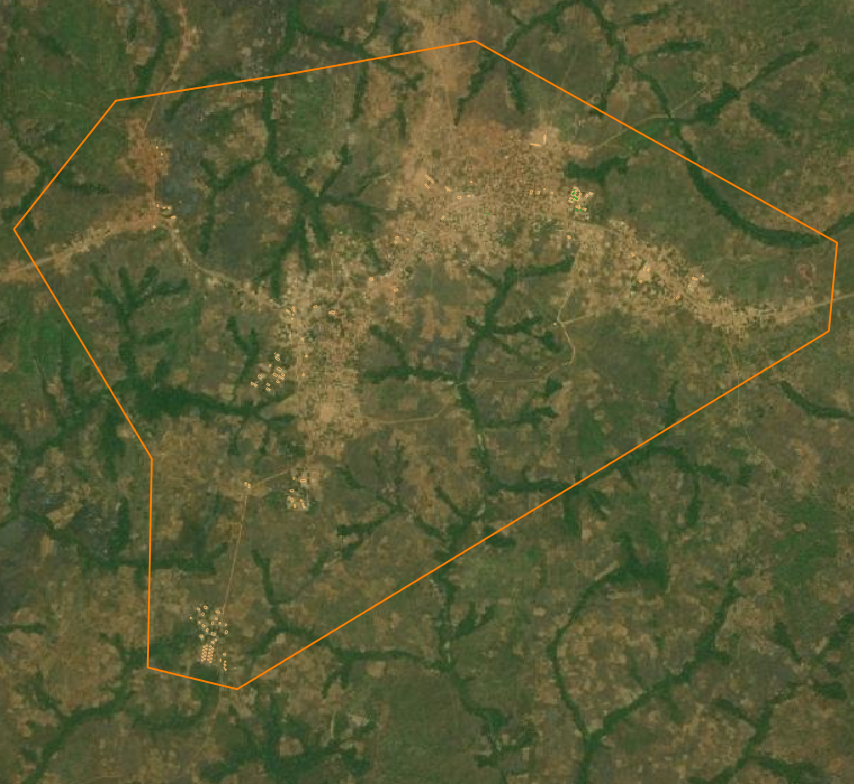
For Central African Reepublic (CAR), we first had to come up with a list of locationss where internally displaced people (IDP) live. This list was generated through a survey conducted by in 2021. There are a total of 597 sites. Please see the screenshot below for the map of the sites.
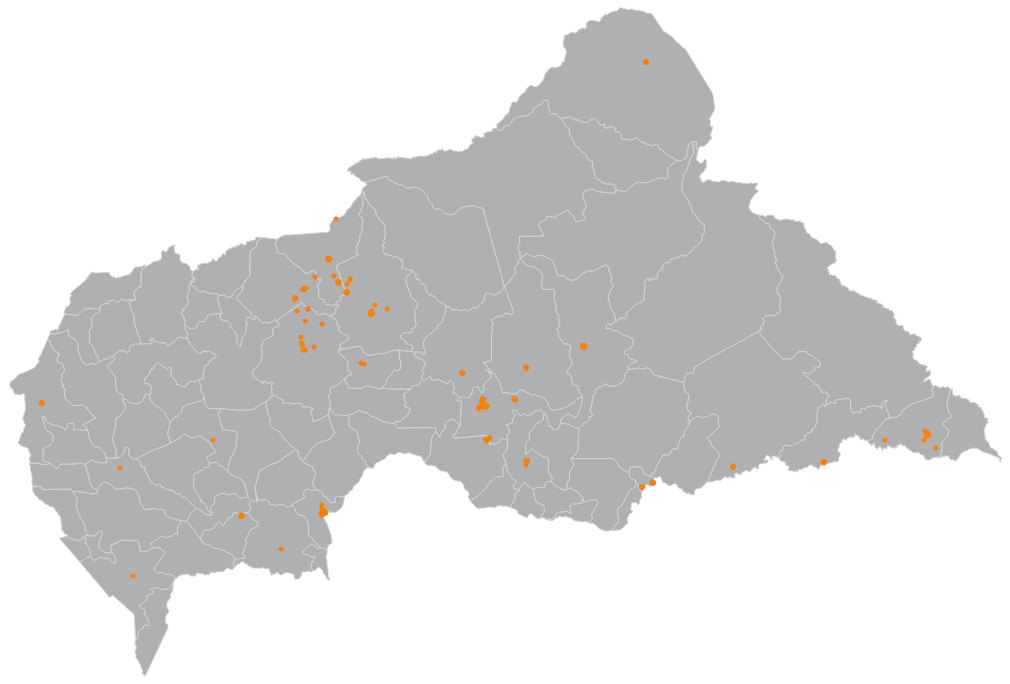
Fig. 49 Study area in CAR identifying locatios of IDPs#
Assessment of OSM building data in the IDP site#
Through quick visual assessments, it was easy to see that most of the regions in the country have been mapped due to prior mapping campaigns. For example, this a region with many IDP sites but with majority of the buildings already mapped
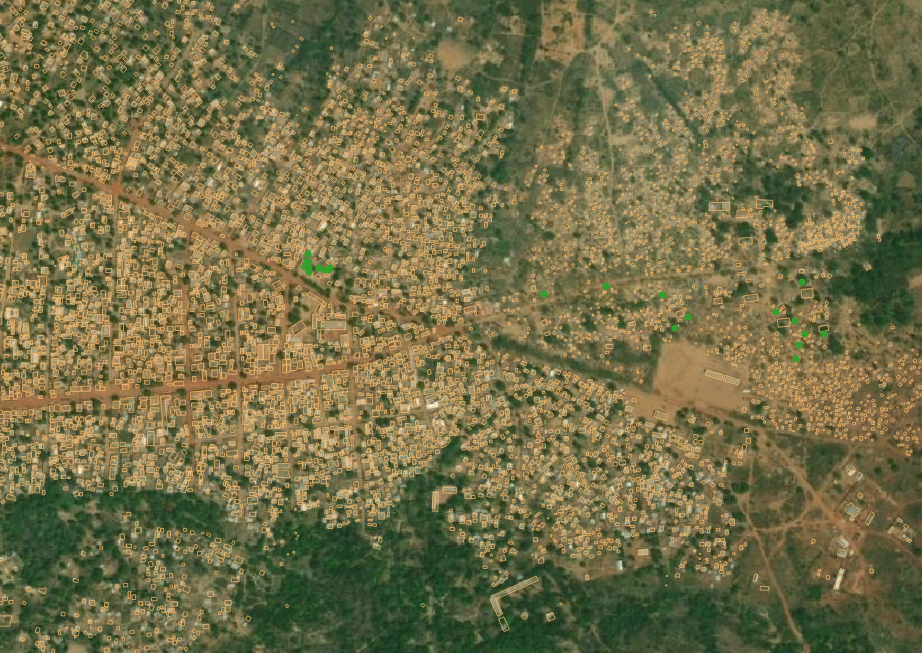
Fig. 50 Region with existing building foorprints#
However, there were still many IDP sites in regions with many unmapped buildings such as shown in screenshot below:
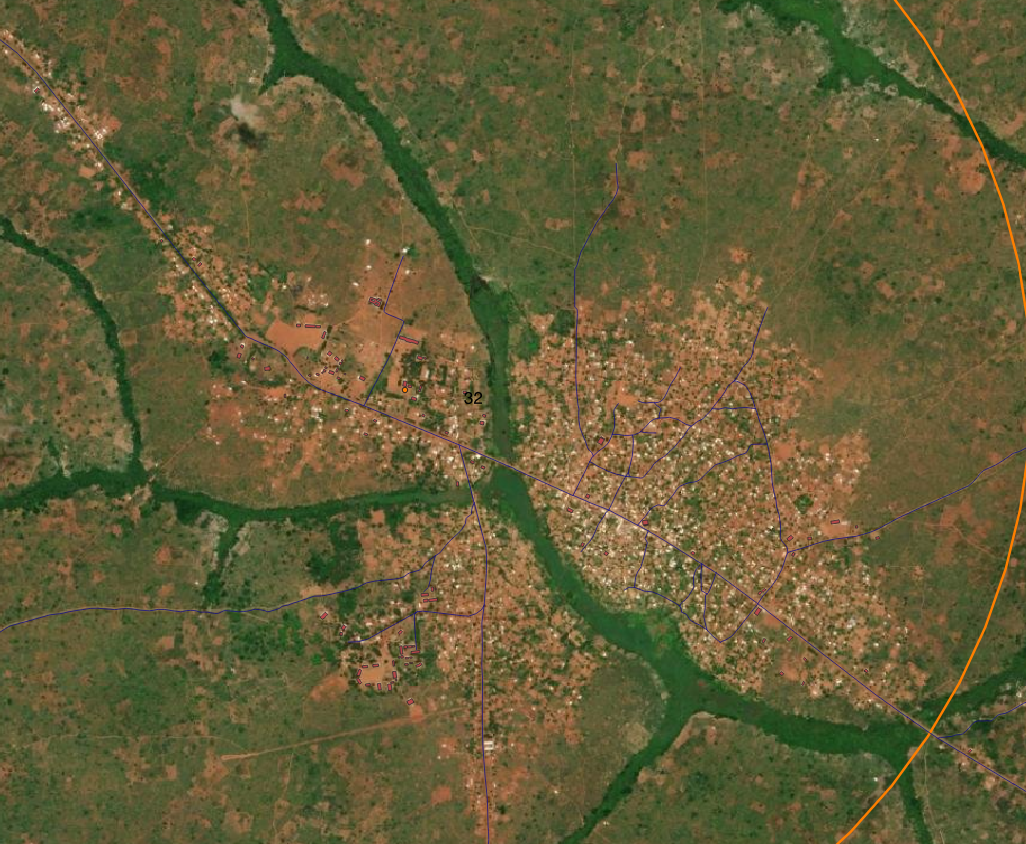
Fig. 51 Region without existing building footprints#
Selection of IDP region to map#
Since some of the areas with IDP were already fully mapped, we had to select which regions to focus on for the mappung exercise. In order to select such regions, we mostly used visual inspection to identfy regions with unmapped buildings and roads around the IDP sites. Note that we couldnt identify the actual IDP sites because they are points rather than polygons. Next, polygons were drawn around these regionsto facilitate creation of mapping zones in OSM
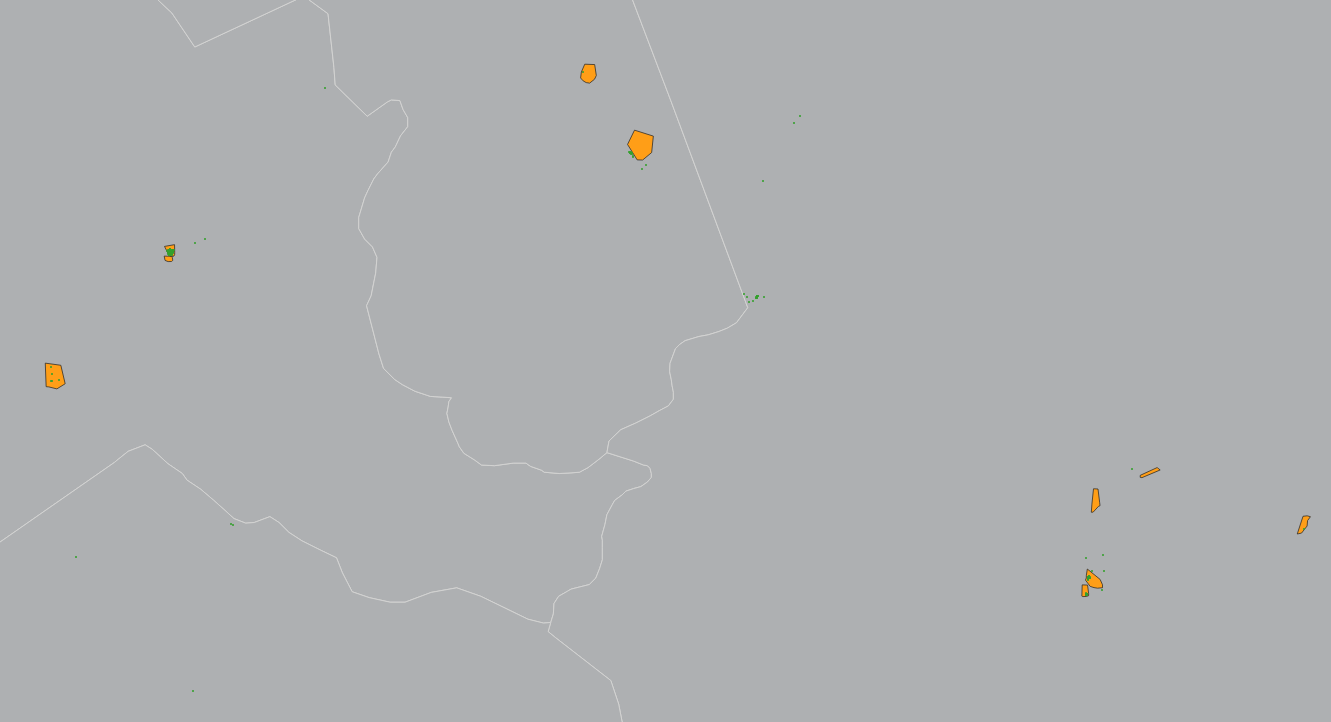
In total, 30 small regions with varying amount of unmapped building buildings were identified. Out of the 30 zones identified above, we decided to create 3 HOT-OSM projects to enable easy identificatin of tasks by mappers as having only project would make it hard for geographically scattered zones.
Fig. 54 OSM regions#
However, due to limited number of volunteers and mapping time, we focused the mapping on one region (Bria) which has many unmapped buildings in the south western corner as shown below
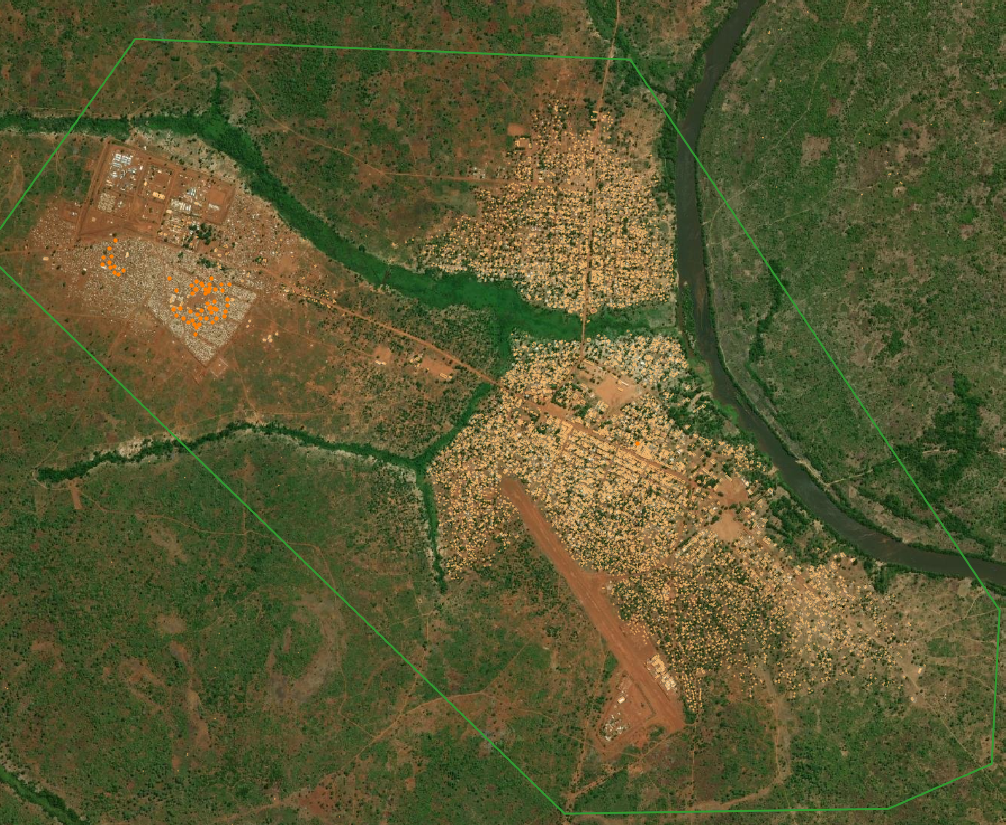
Fig. 55 Bria#
Post mapping statistics#
Due to the fact that we used volunteers for this mapping and the mapping wass also donee for a few hours, we will not focus on comparing the before and after in terms of the number of buildings and roads which were mapped. In total, across all the three projects that we created, we were able to map 2,002 buildings.
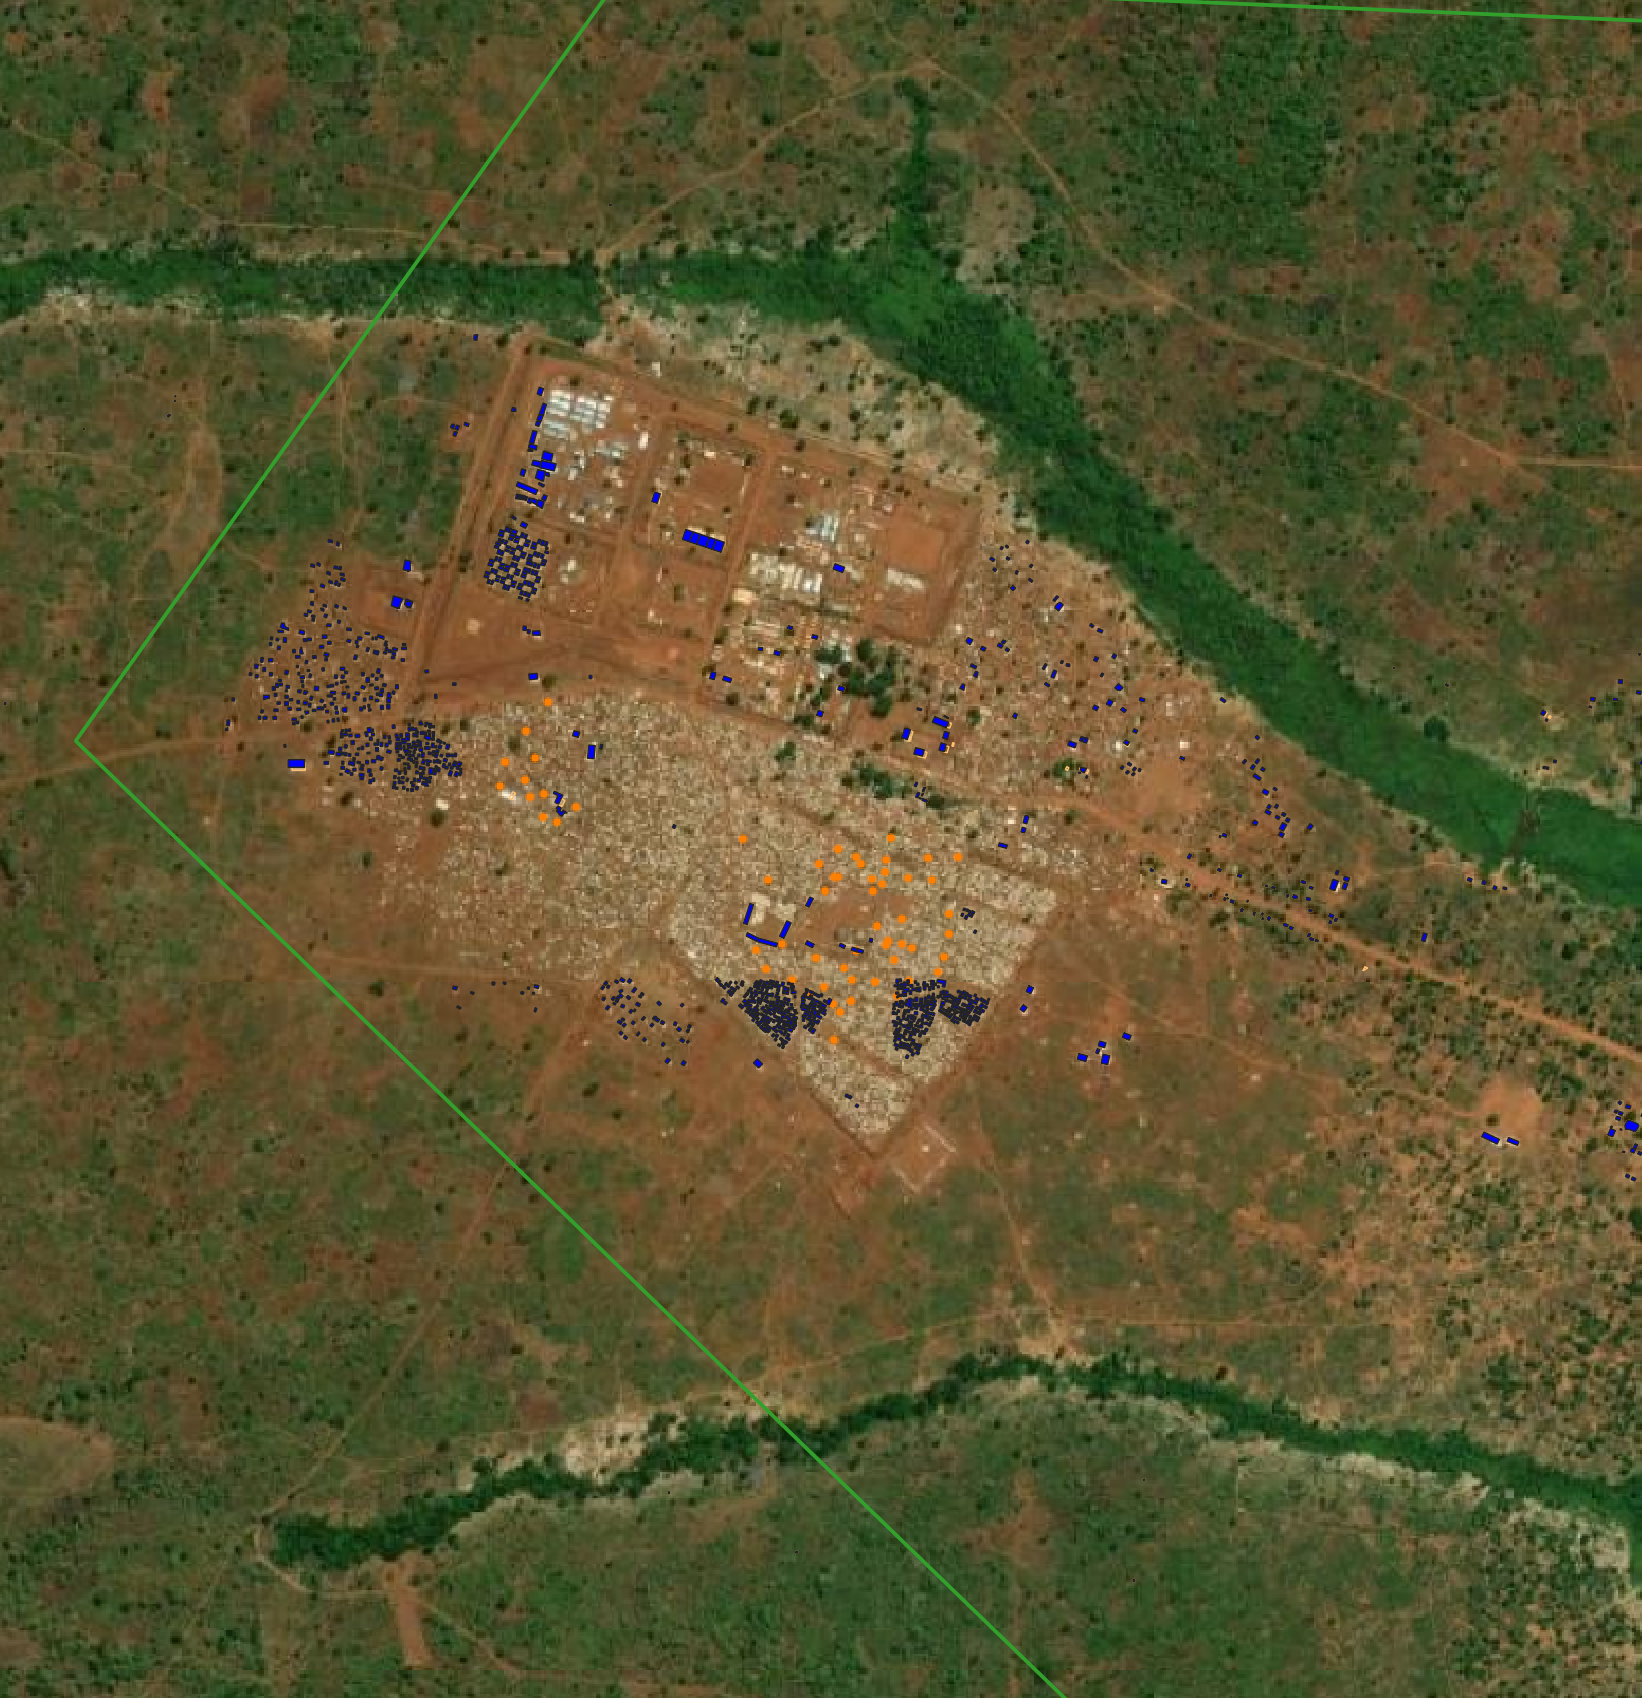
Fig. 56 Before and after updates#
Challenges in the mapping#
First, the IDP regions were provided as GPS points which seemed to be pointing to specific households rather than camps based on how close they are to each other. This presented a problem of how to identify areal extent of are where the IDP live. As a result, the small mapping regions we ended up generating are utmost a rough estimate which most likely overestimates areas covered by IDP. Due to the fact that we have over 500 sites scattered over the whole country, this presented a logistical challenge as as creating HOT-OSM proje ts is concerned as it was difficult to find geographically contigous regions to map as spread out regions are hard to map. This prompted us to create many projects wich is time consuming.
Secondly, since the mapping relied on volunteers and one of the main challenges was lack of enough people to do the mapping in a sustained manner. Secondly, again due to relying on volunteers, it was difficult to select mappers with higher skill levels and so the mapping process was slightly slowed down by first providing a tutorial on the mapping process, the beginner mappers asking many questions and finally by the mere fact that beginner mappers are slow.
Another challenge is the low quality of the satellite imagery as well as mismatch between different imagery providers. As a default, we used Maxar imagery as it had more uptodate imagery but it was still the xase that in some regions, other providers had more update to imagery. Furthermore, these different image sources produced alignment errors in the mapped buildings. Concretely, we noted that the