Stage 4: Assess Fit for Purpose#
Step 1: Check the geographic completeness#
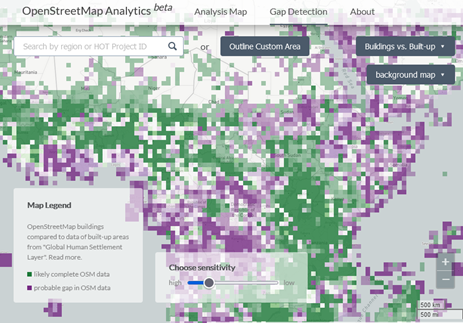
Understanding completeness of geographic data can be a tricky process, as there is rarely a true dataset to use for comparison. Instead, comparisons must be made to other, related geospatial data, through triangulation processes. HOT provides tools that show the density of OpenStrretMap features, which might help in identifying areas which need further mapping (Figure 2) as well as a gap analysis tool for building footprints.

Fig. 8 Building footprint gap analysis tool from HOT OSM, derived from https://osm-analytics.org/#
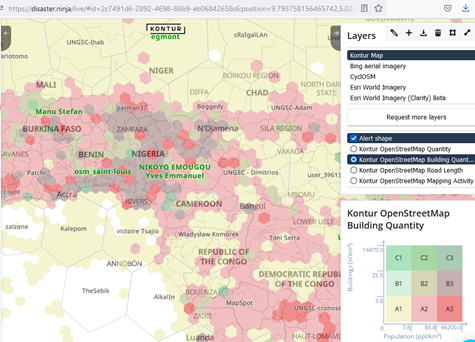
The company Kontur built a similar tool named Disaster Ninja to compare the density of features in OpenStreetMap with population density to show which areas are likely under-mapped. It offers a large variety of analytical comparisons (Figure 3).

Fig. 9 Analysis of OSM building density. From Disaster Ninja#
Step 2: Check geometrical accuracy of layers#
Not all geospatial data are created equal; questions of scale, purpose, and source will dramatically affect the quality of geospatial information. One important point for evaluating usefulness is to evaluate the geometrical accuracy of the data: how closely the data match the situation on the ground. While we often do not have true data to make a comparison, there are several steps we can take to evaluate the quality of the data:
Overlay the data layers on a satellite image to see how closely geospatial data closely follow the satellite image. Small errors in the order of a few meters of deviation between features and map occur because the georeferencing of the satellite image that was used to map the features and the current satellite image are slightly misaligned. Depending on the purpose of the maps fixing such small errors might not be necessary. However, large differences could suggest that the area has changed and needs to be re-mapped.
If there is a systematic shift of geometric objects with respect to a reference, for example a satellite image, the coordinate system might not be correctly defined.
Implement topology: a topology defines a relationship between vector objects, and is useful for identifying errors in geospatial. Rules limiting polygon overlap, or slivers in polygon datasets, or ensuring points fall within specific polygons are all examples of topological relationships.
Step 3: Check attribute correctness#
While spatial coverage and accuracy are important to geospatial practitioners, understanding the completeness, accuracy, and coverage of attributes is equally important. Attributes can be evaluated in several ways:
Comprehension: Are the attributes clear? do the metadata clearly identify the columns with definitions? If not, it is important to reach out to primary sources for support, as mistaking attribute values can invalidate many analyses.
Completeness: How complete is the attribute table? For each column assess how many null or empty values exist and determine if those missing values are truly missing or represent holes in the data: some data naturally have missing values, while in other columns this is indicative of missing data.
Correctness: Do the attribute data make sense? Understanding correctness requires completing the comprehension and completeness steps but is important to properly using the data. For variables of interest, evaluate if the data make sense, based on the field type:
a. Numeric: are all the values numbers? Do they fit within a prescribed range?
b. Text: are all the characters translated correctly?
c. Categorical: are there any errant entries? Do all entries fit a prescribed definition?
