Baseline data assessment and report for Kasai Health Zones#
Dictionary#
JOSM: JOSM is an extensible editor for ?OpenStreetMap (OSM) for ?Java 8+. It supports loading GPX tracks, background imagery, and OSM data from local sources as well as from online sources and allows to edit the OSM data (nodes, ways, and relations) and their metadata tags. JOSM is open source and licensed under GPL?.)
HOT: Humanitarian OpenStreetmap Team is an international team dedicated to humanitarian action and community development through open mapping.
HOT Tasking Manager: Tasking Manager is the tool for coordination of volunteers and organization of groups to map on OpenStreetMap.
HOT Tasking Manager Project: An area smaller than 5000 sq kilometers that is broken down into smaller grids called tasks, so it can be mapped in parallel by multiple persons.
HOT Tasking Manager Task: A square grid inside a OSM Tasking Manager Project that can be locked for a period of time by a person so that other people mapping know somebody is working on improving that area, so that they do not start work on the same area of land.
Quantitative assessment of OpenStreetMap (OSM) completeness in the Kasai Health Zones#
At the start of the project, there were 8533 buildings added inside the Kasai Health Zones. We decided that we would give the mapping team only the task of adding the buildings, without adding roads. After they add the buildings we will come and add the missing roads after they finish mapping the buildings. This simplified the process of getting a better estimation of the speed of edits of the buildings. The mapping team added 200k buildings. The map below shows just the count for the buildings that were added by the team.
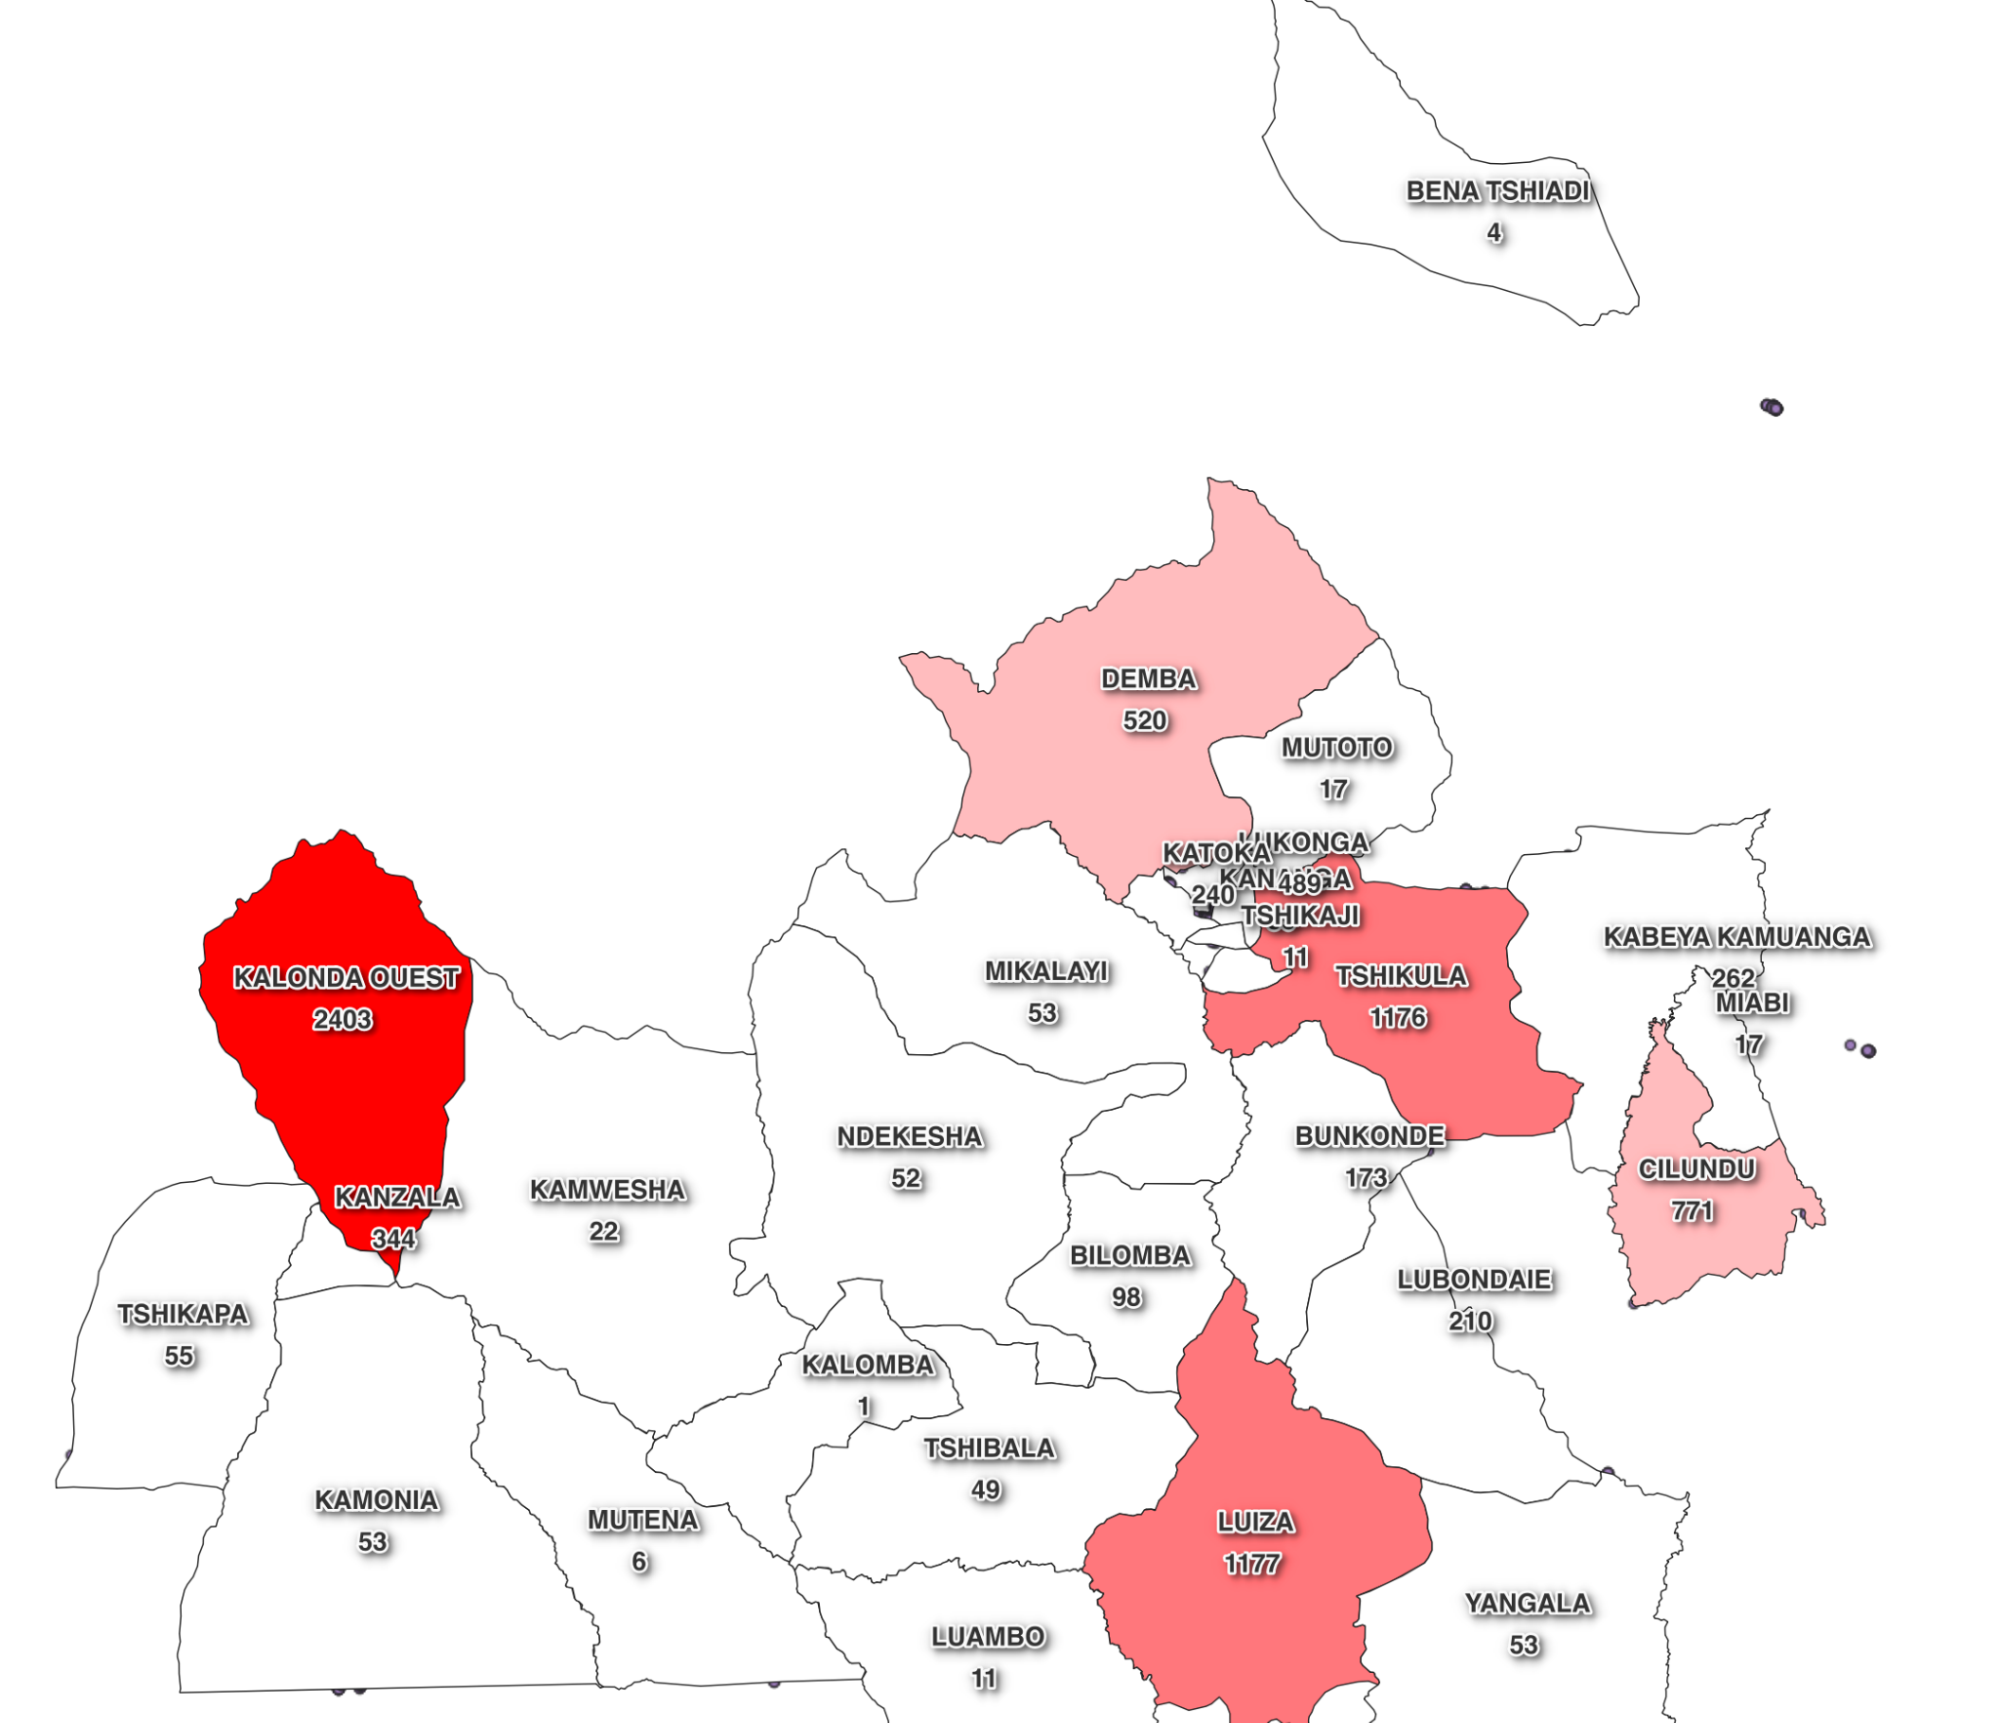
Fig. 14 Baseline buildings in Kasai health zones prior to update#
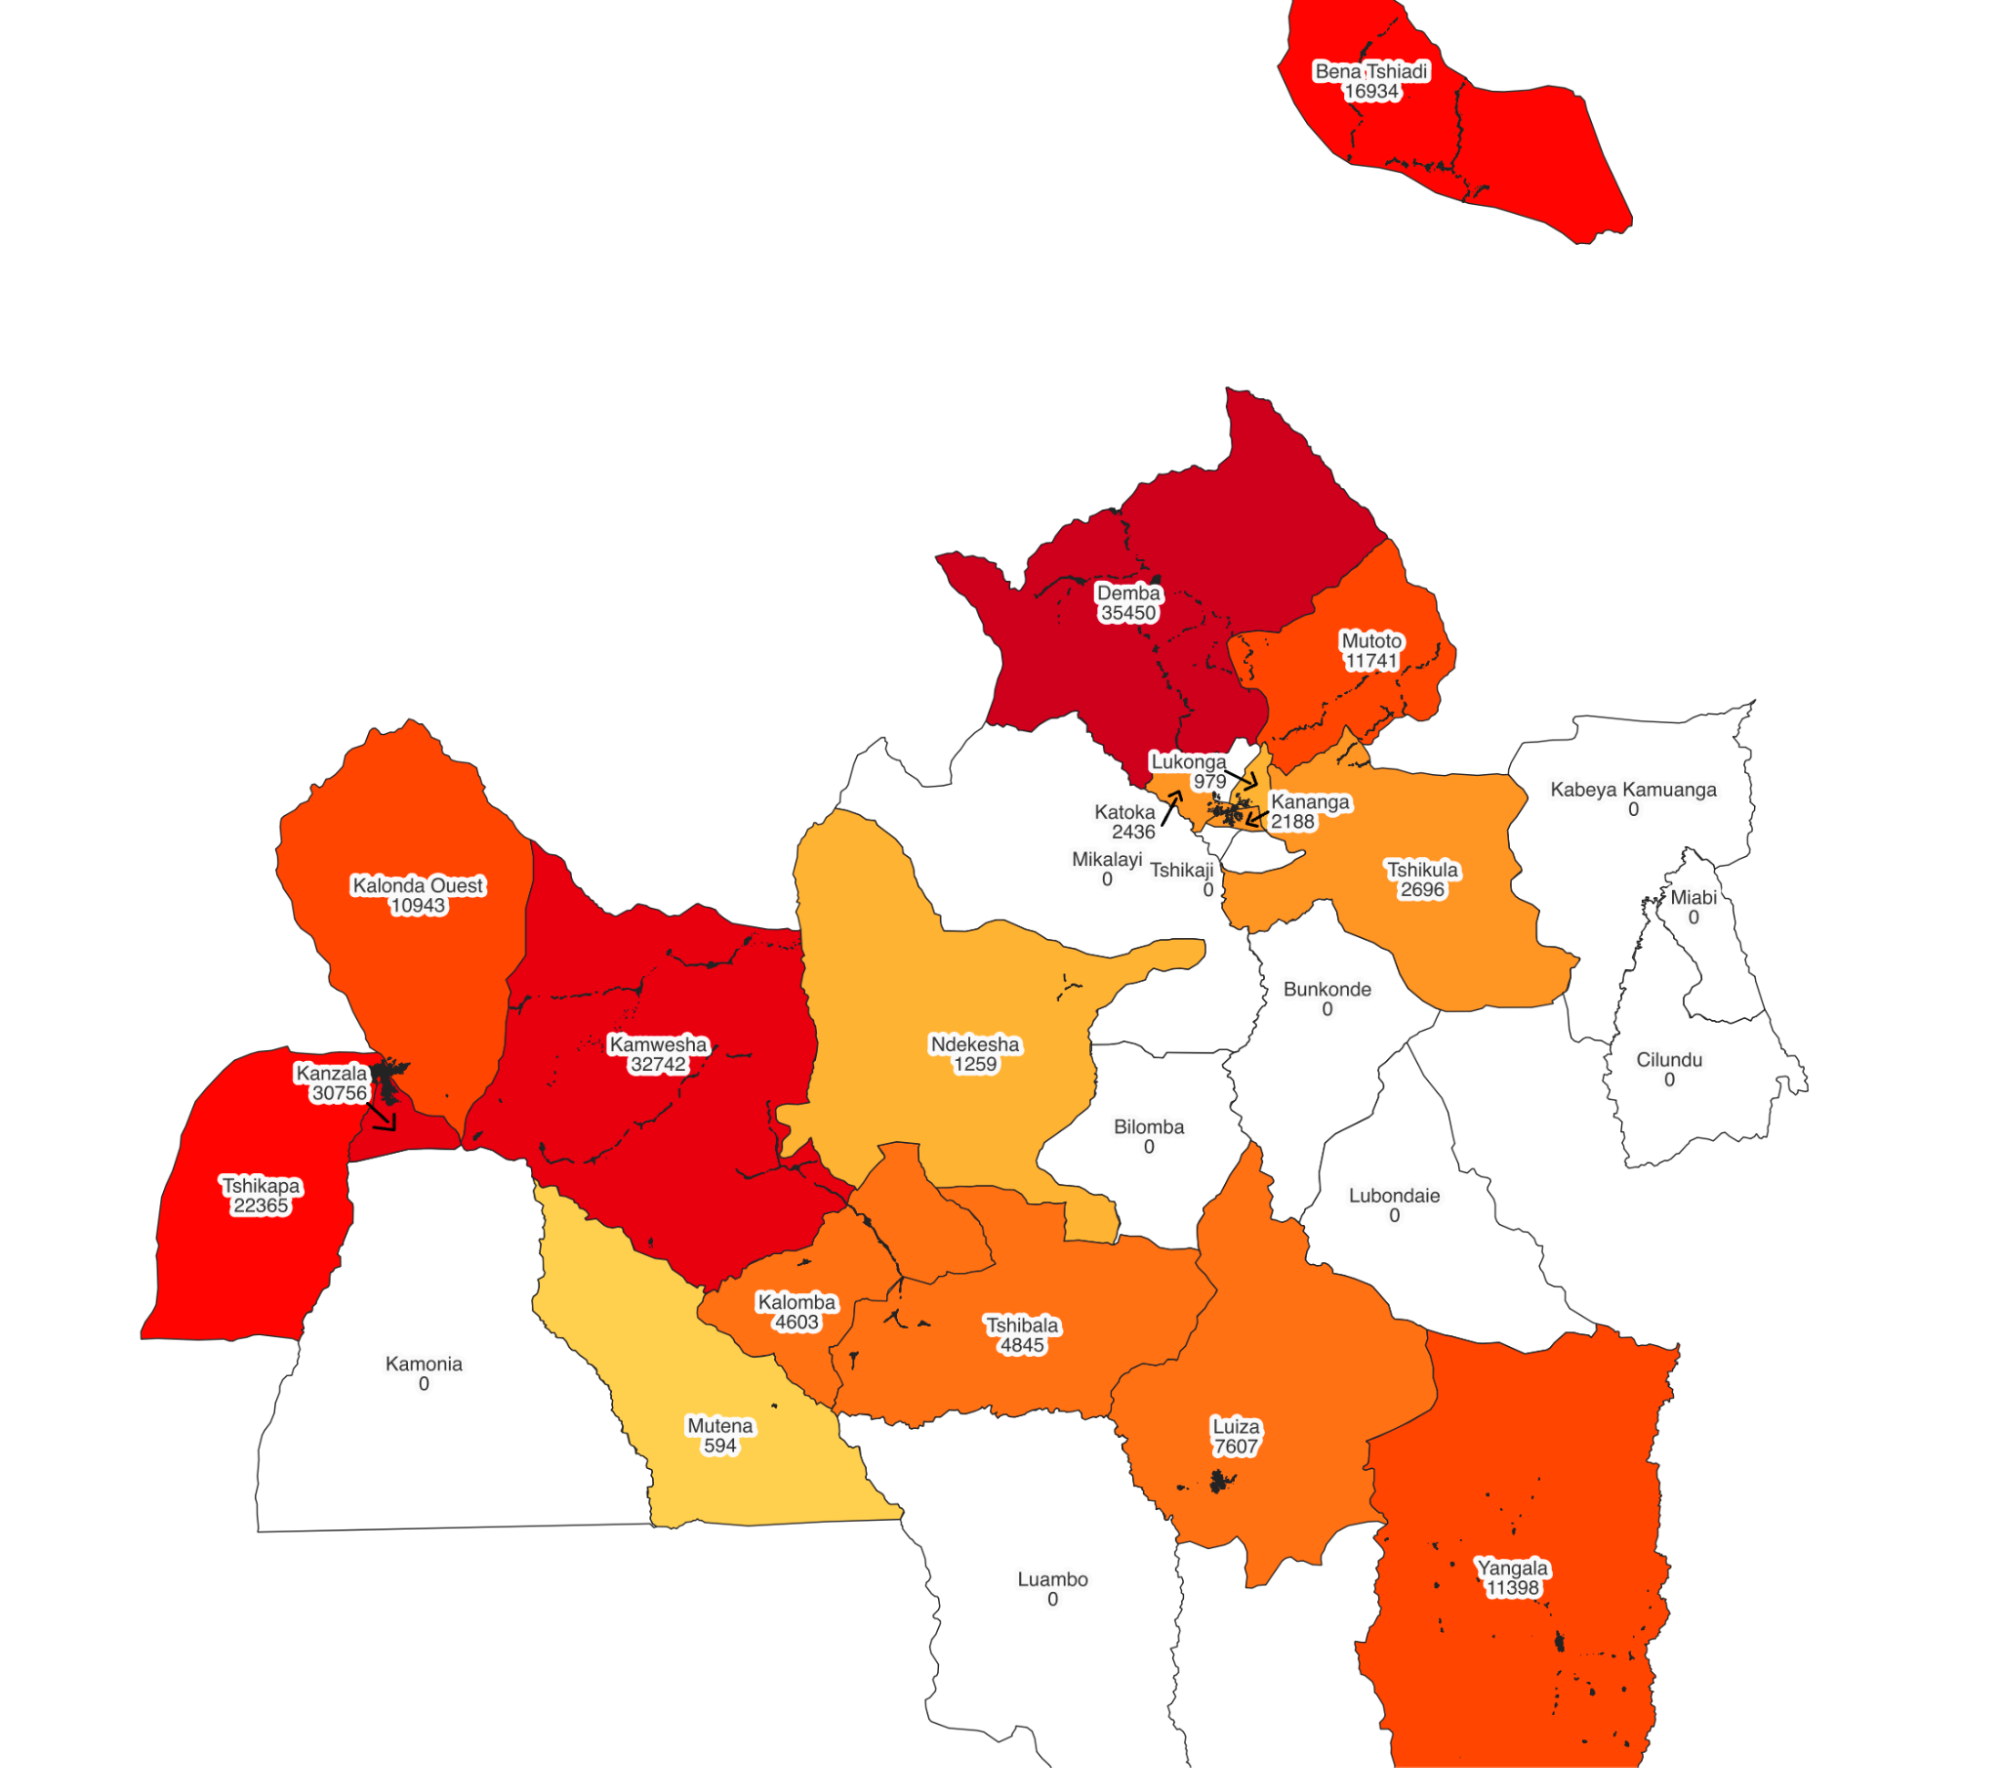
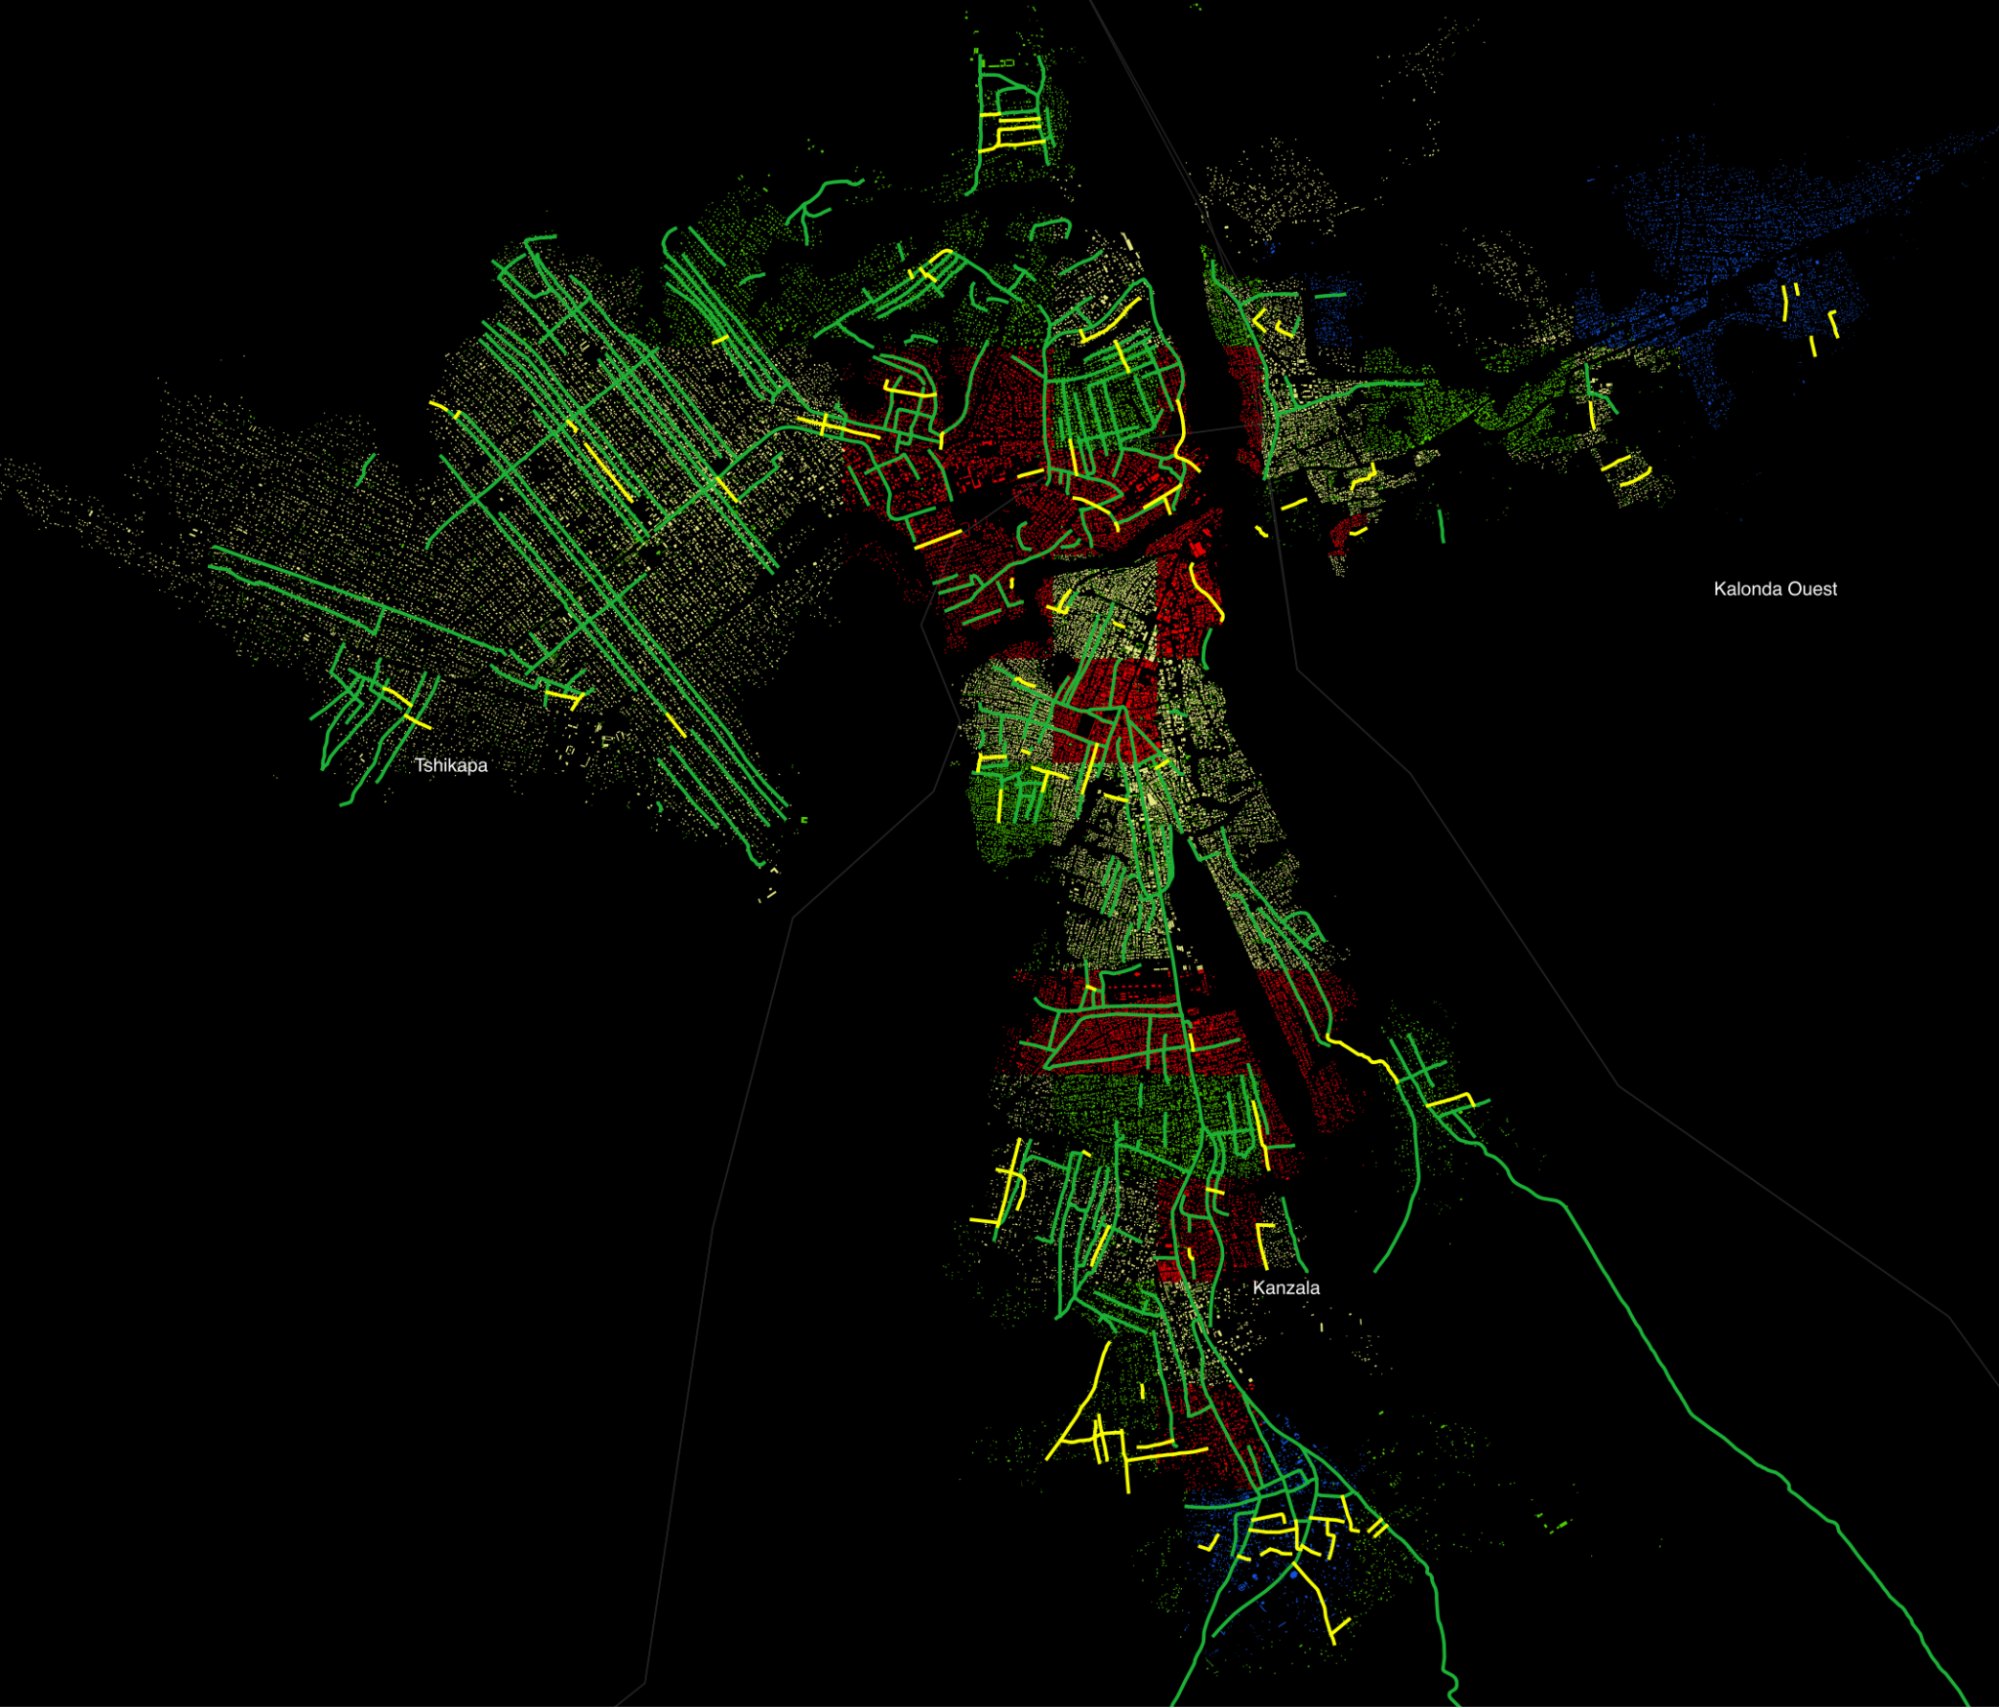
Fig. 15 Buildings added in Kasai health zones#
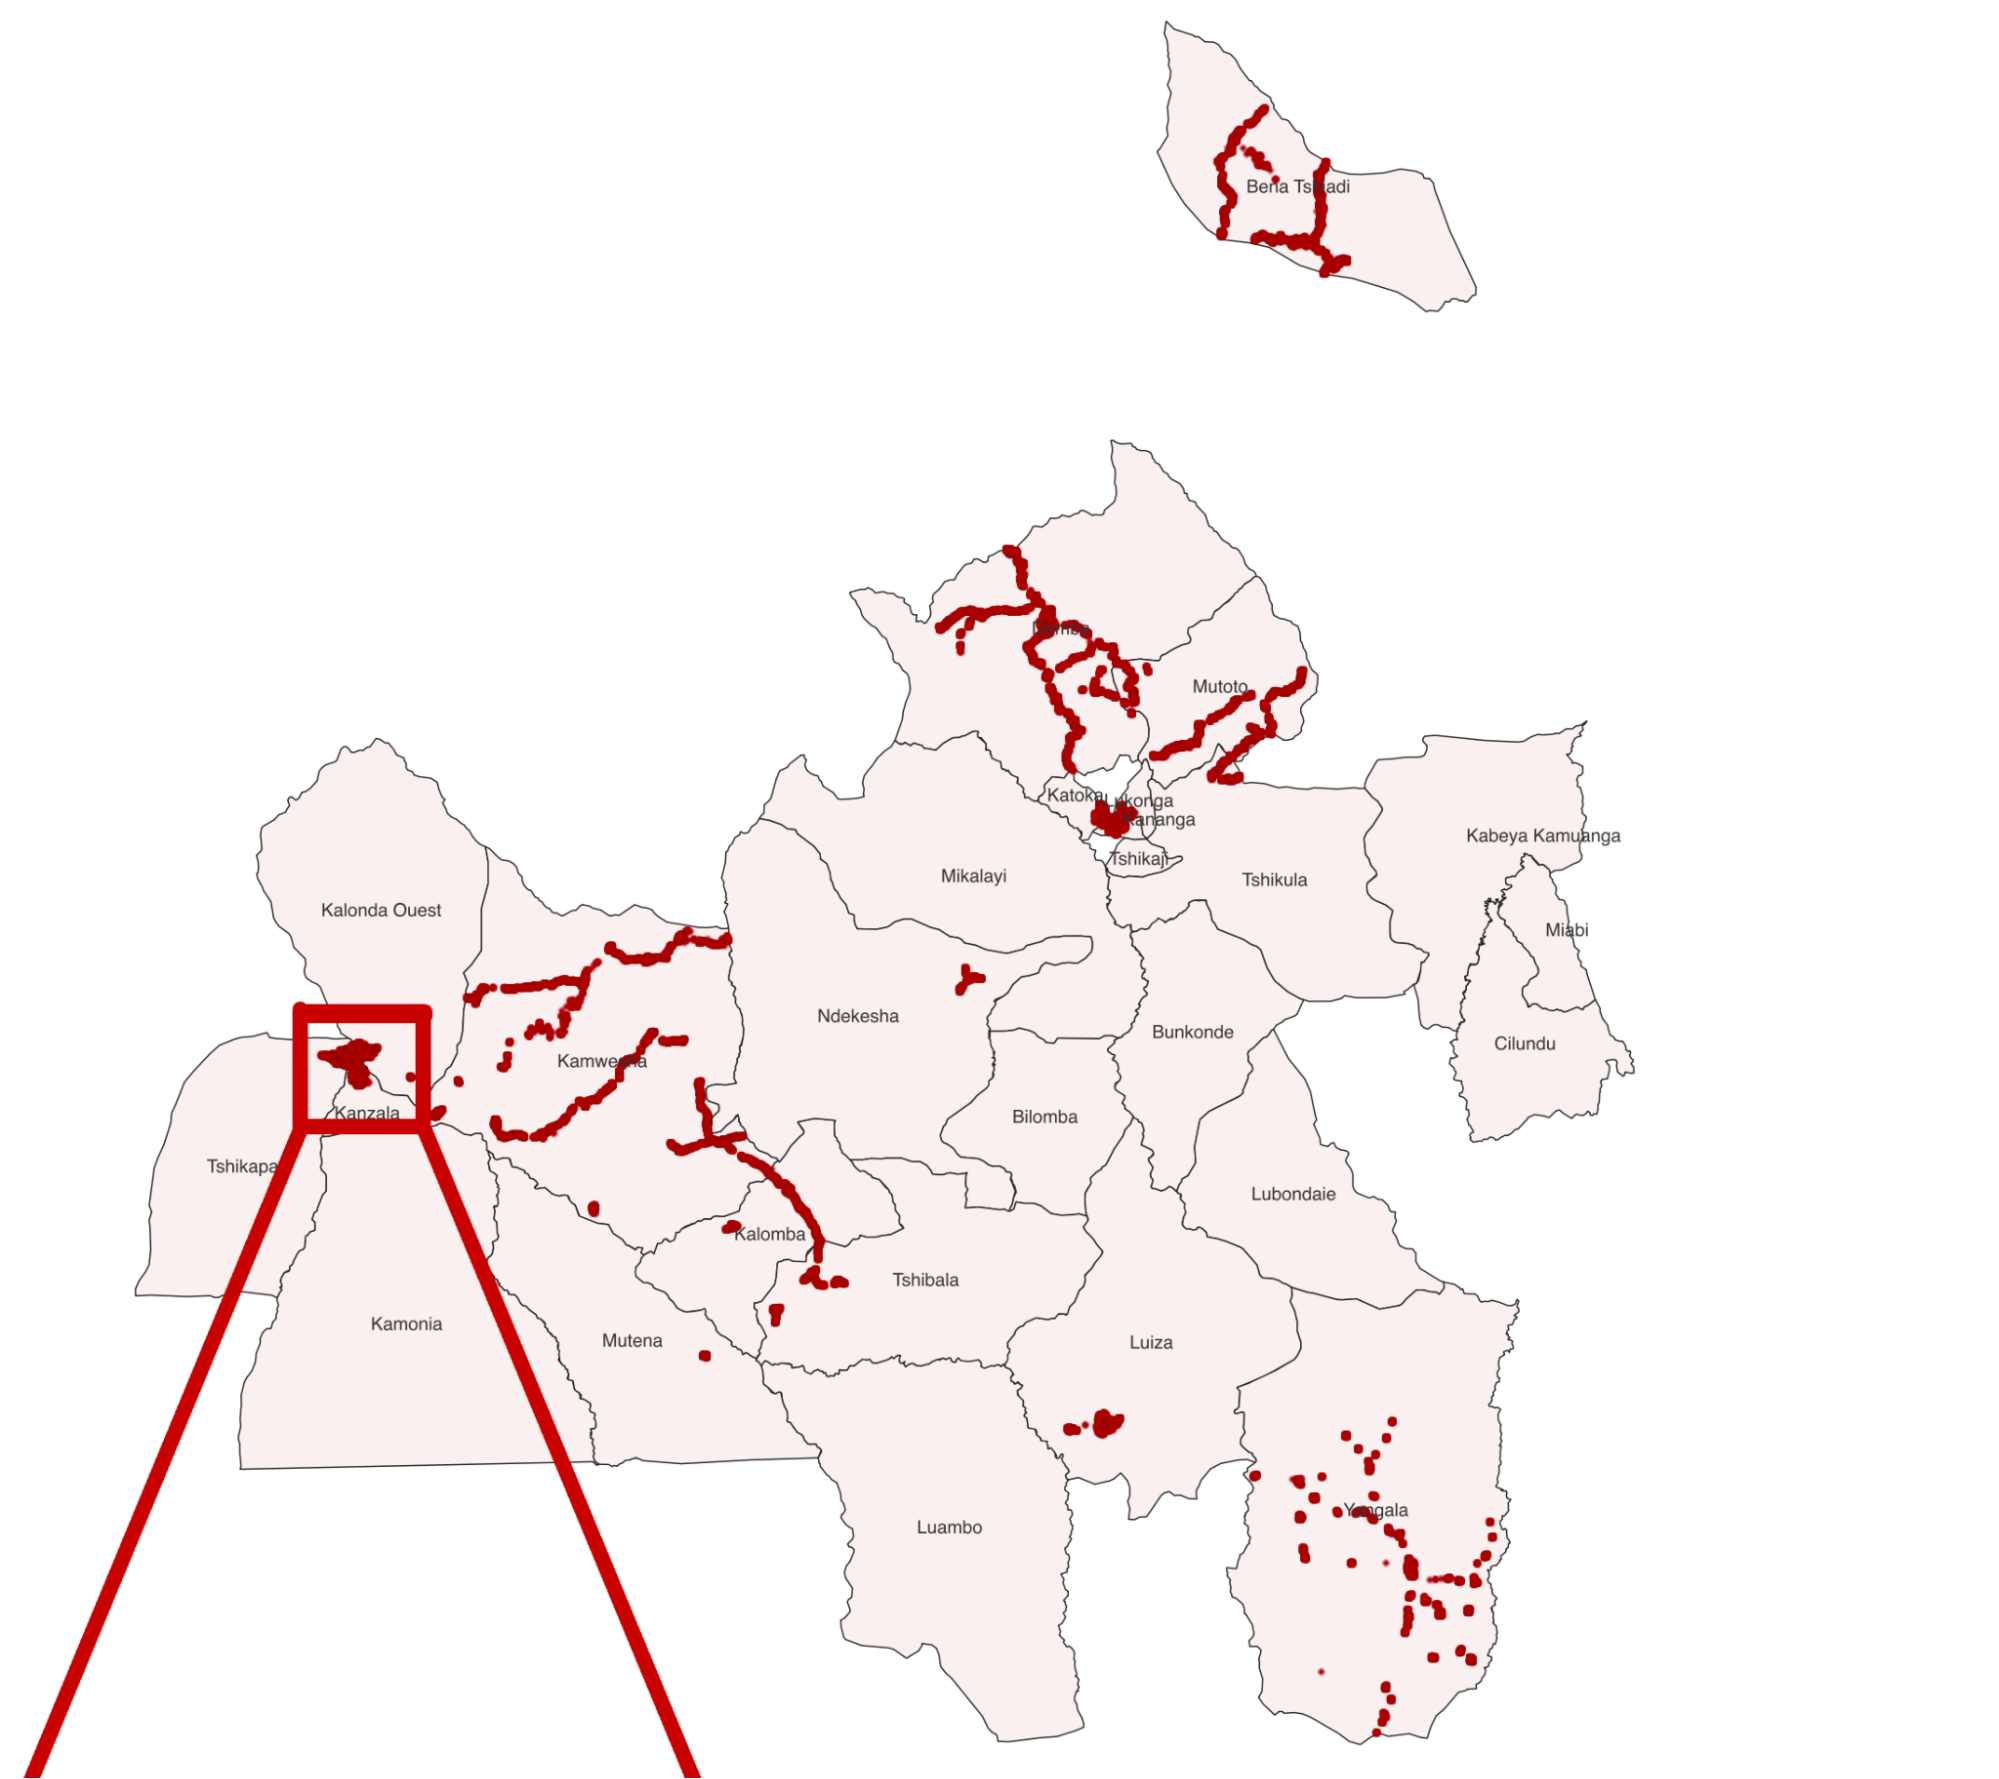
Fig. 16 Buildings added in Kasai health zones#
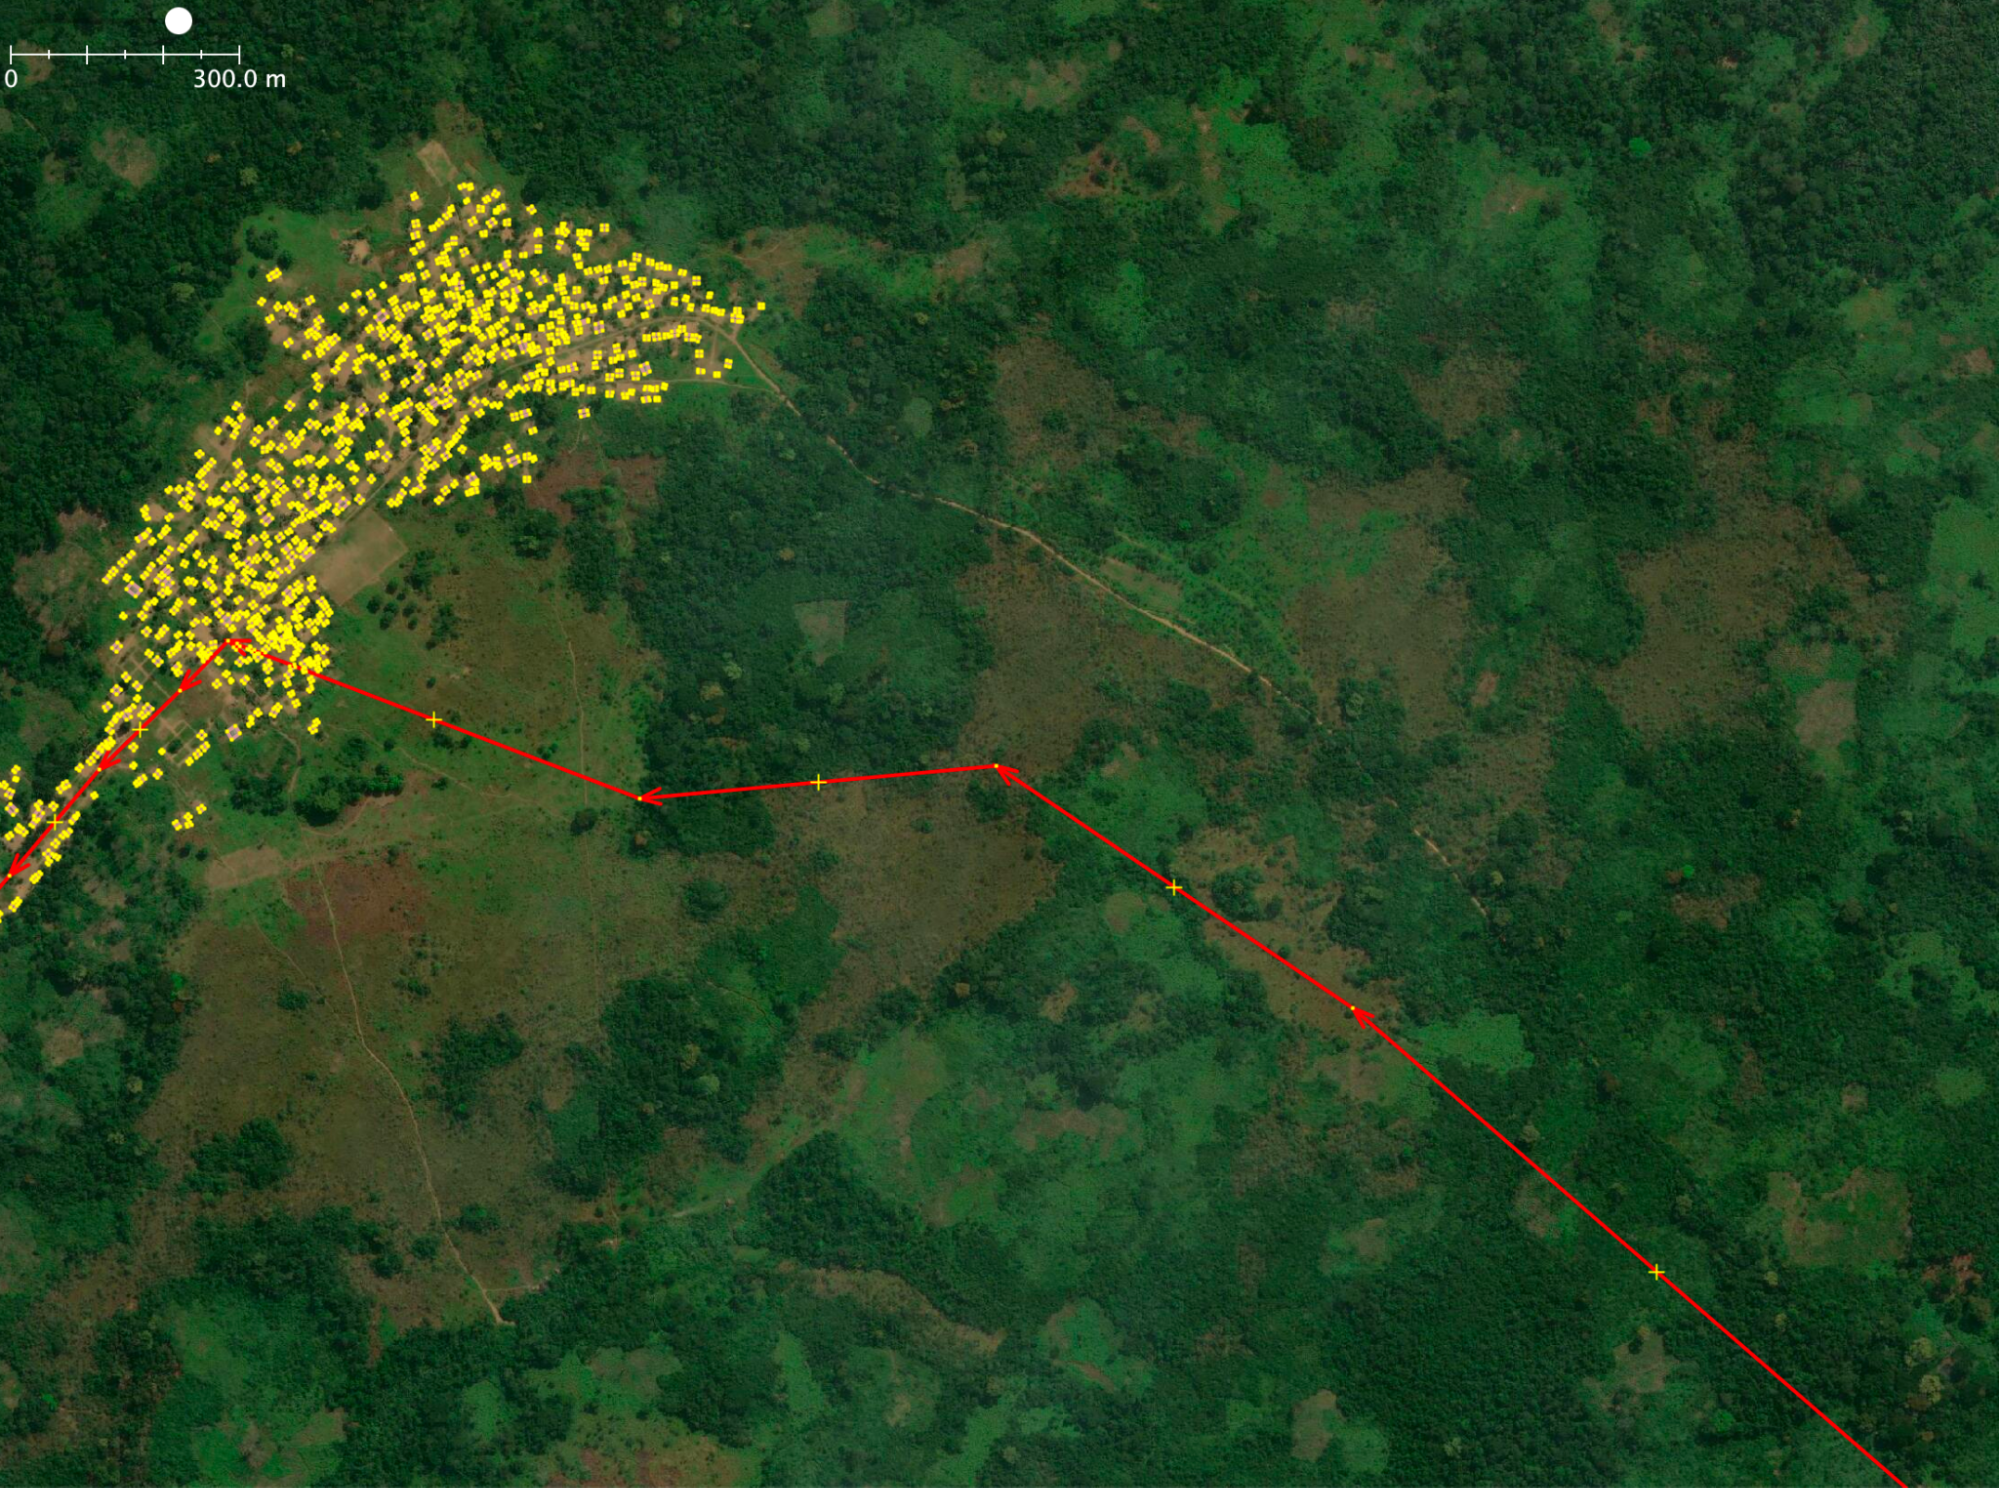
Below we can see a zoom-in image of Tshikapa (the square image from the above image). The different colors represent different people from the map team that mapped different parts of the city.
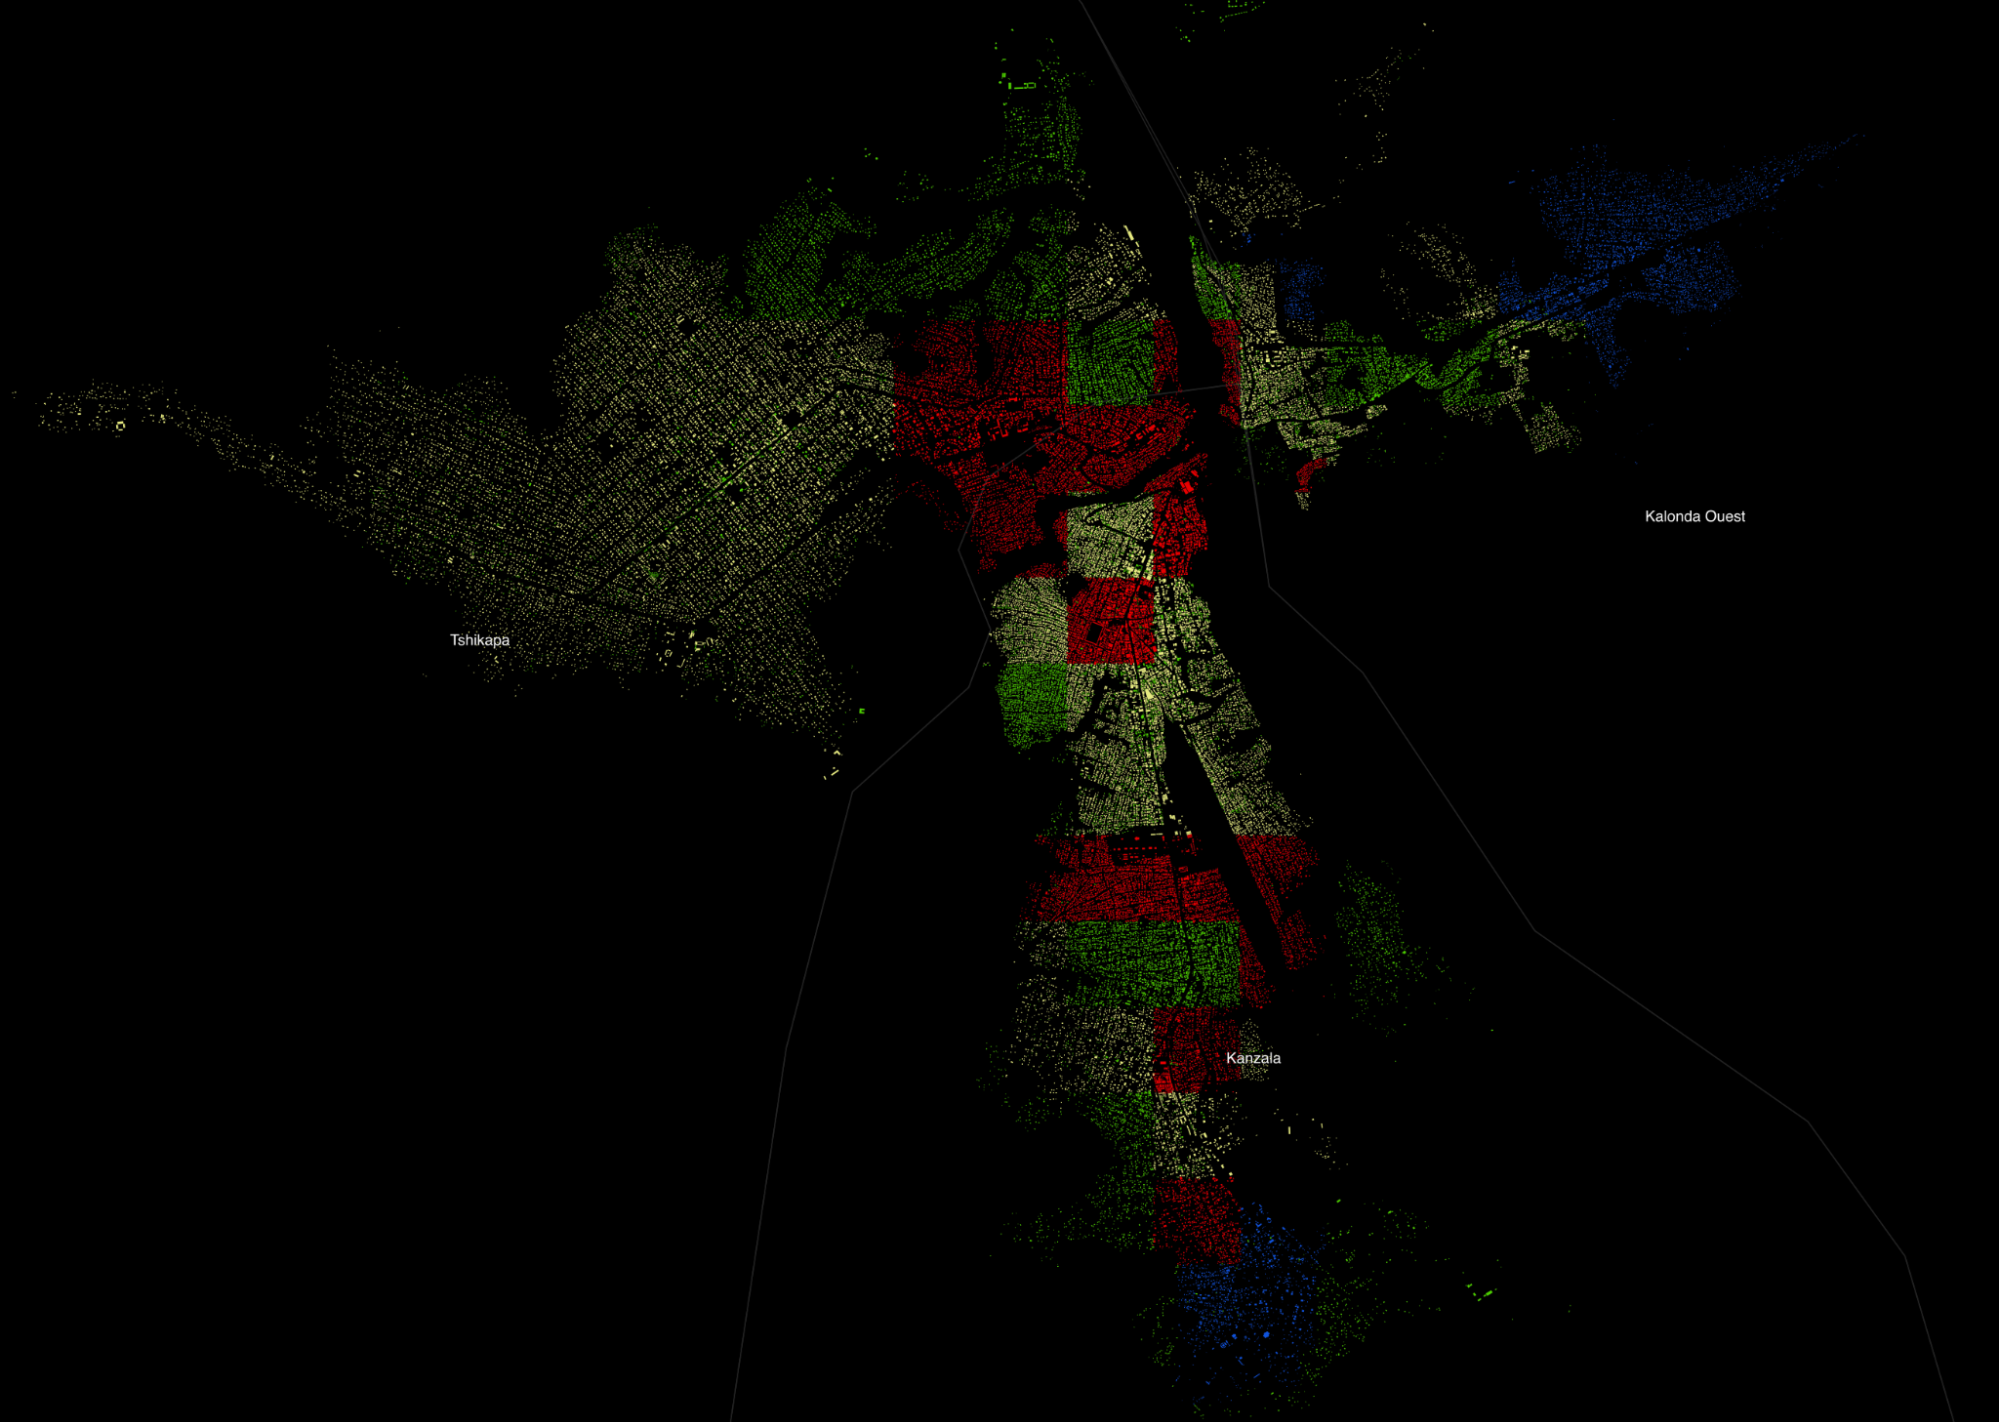
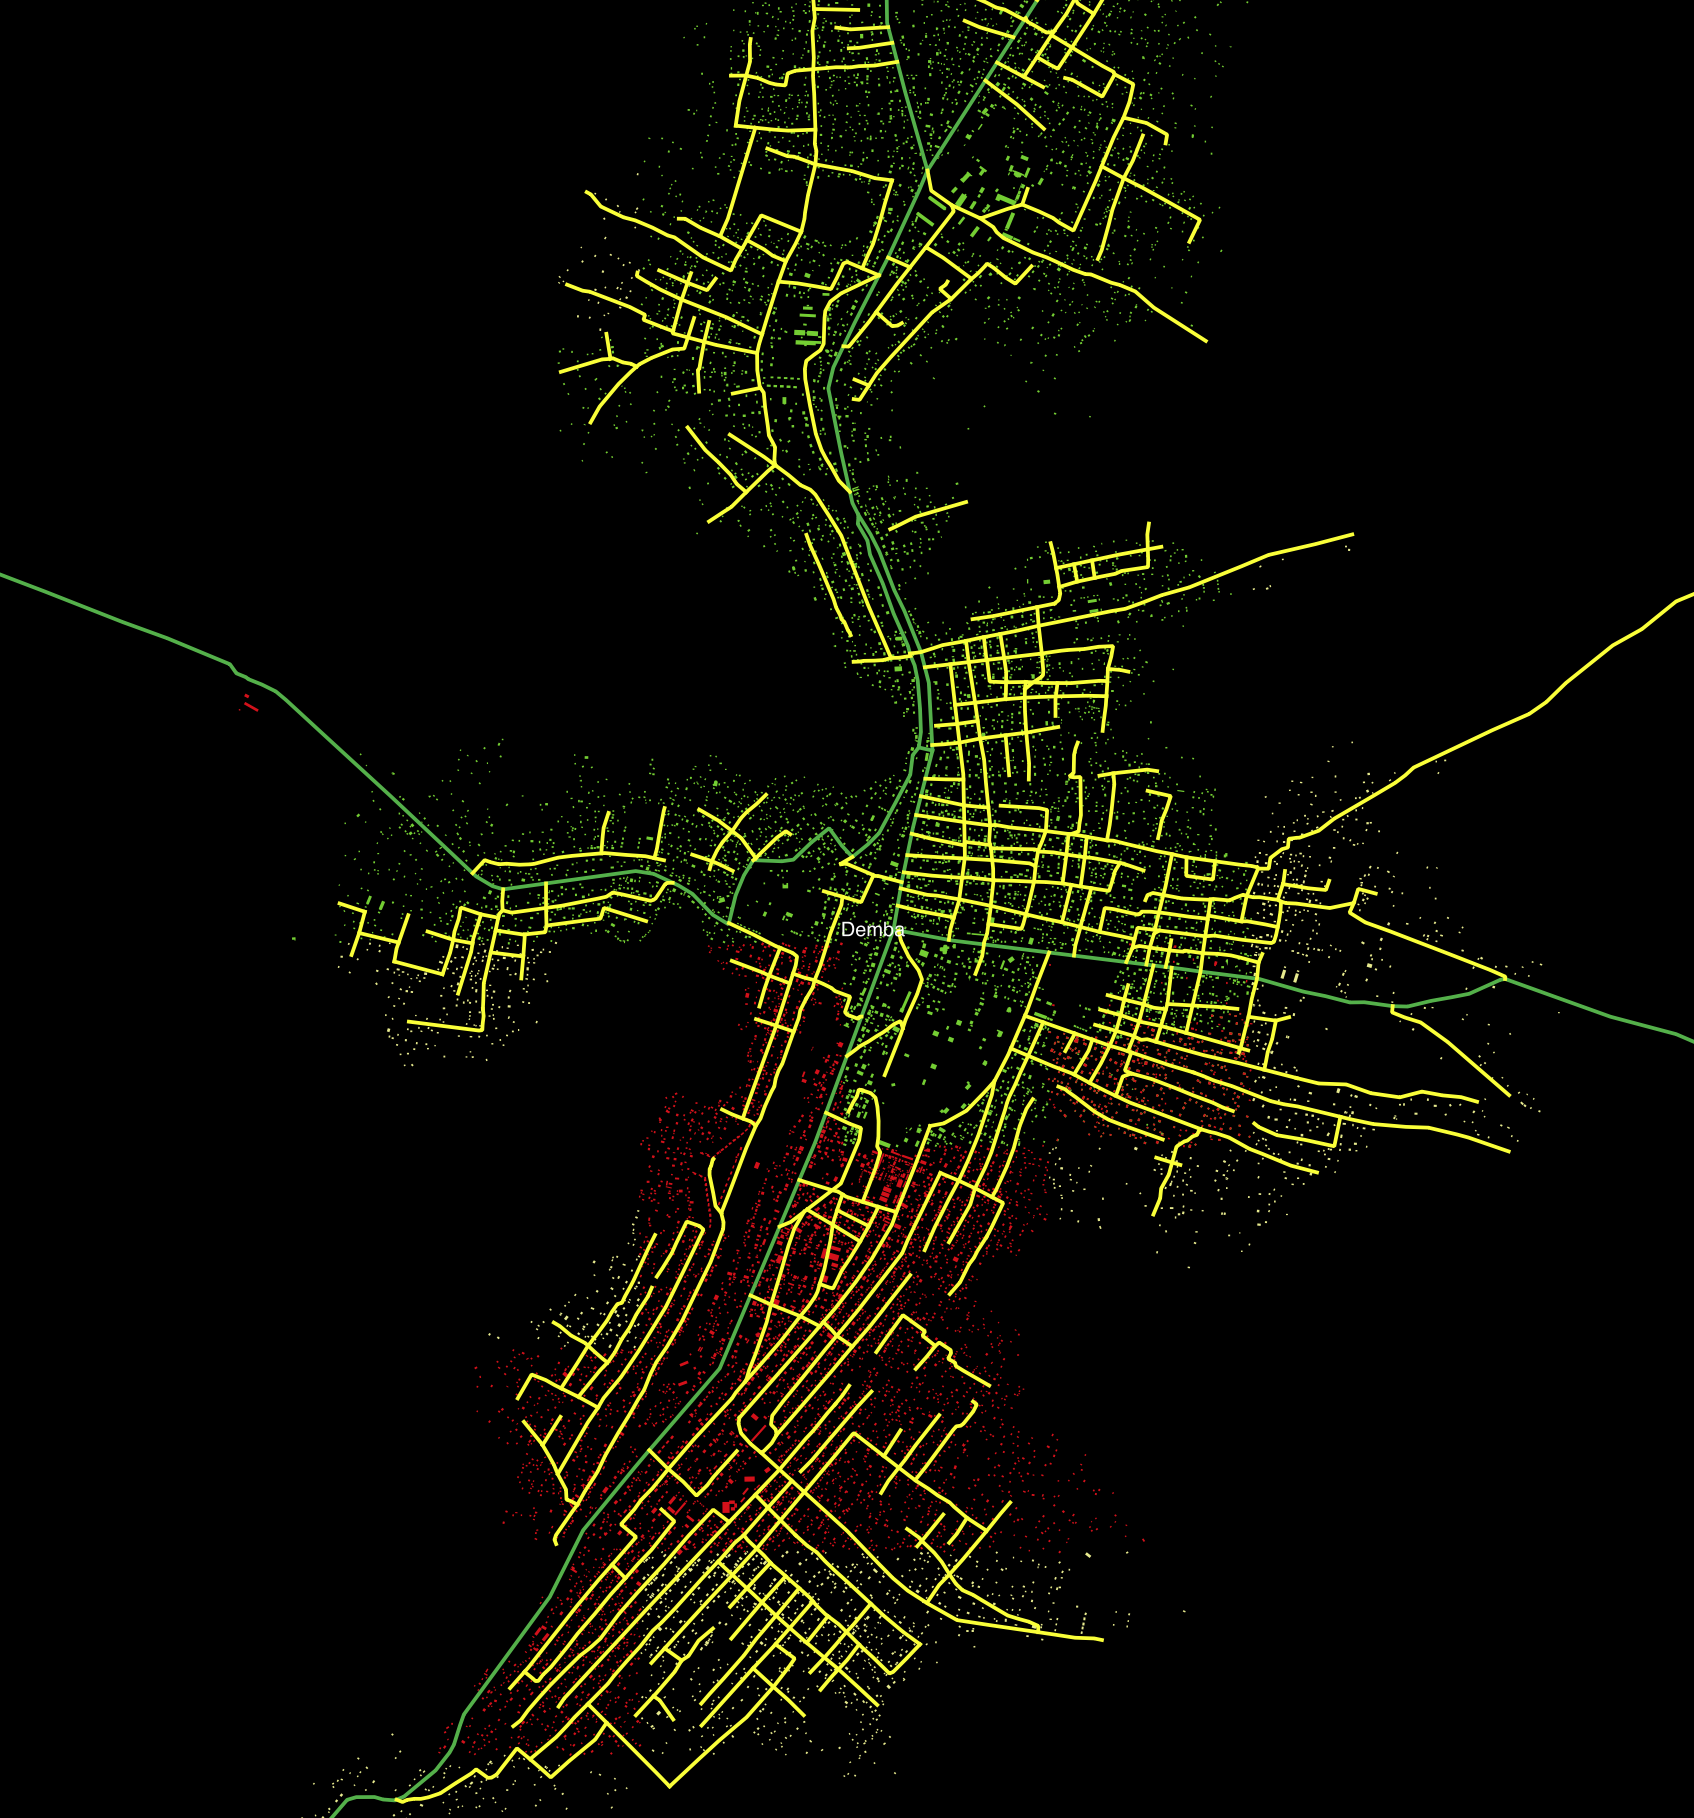
Fig. 17 Map of added buildings in Tshikapa#
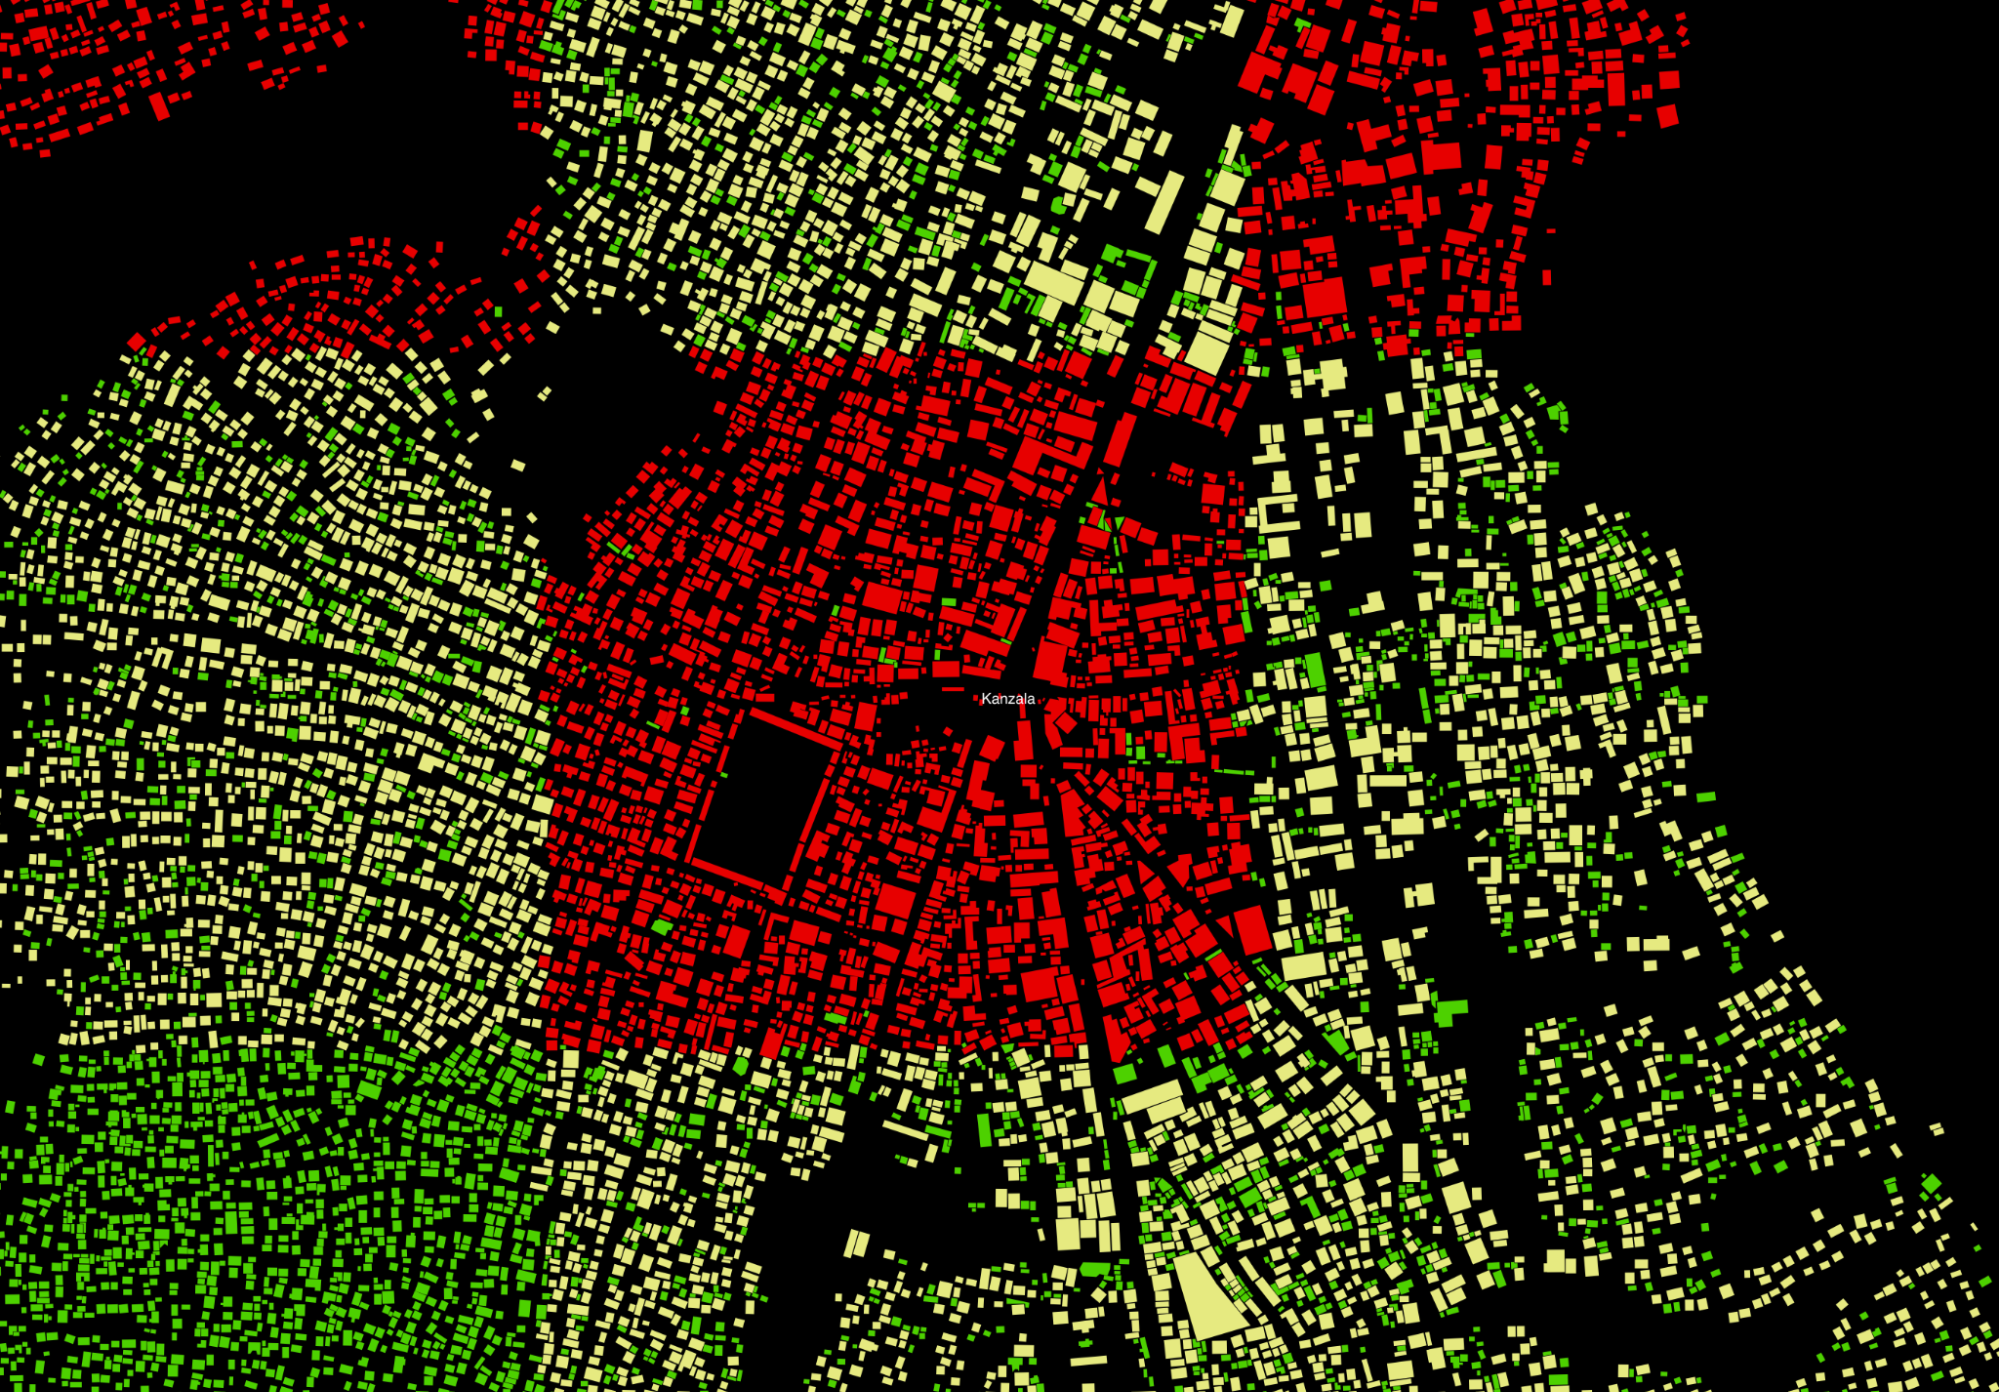
Fig. 18 Map of added buildings in Tshikapa zoom#
Each person from the map team added their grids and at the end, there was a mapper with a background in architecture that has given the task to do a final pass of the city and add some of the buildings that were missed by the other colleagues in the team (the green colored buildings)
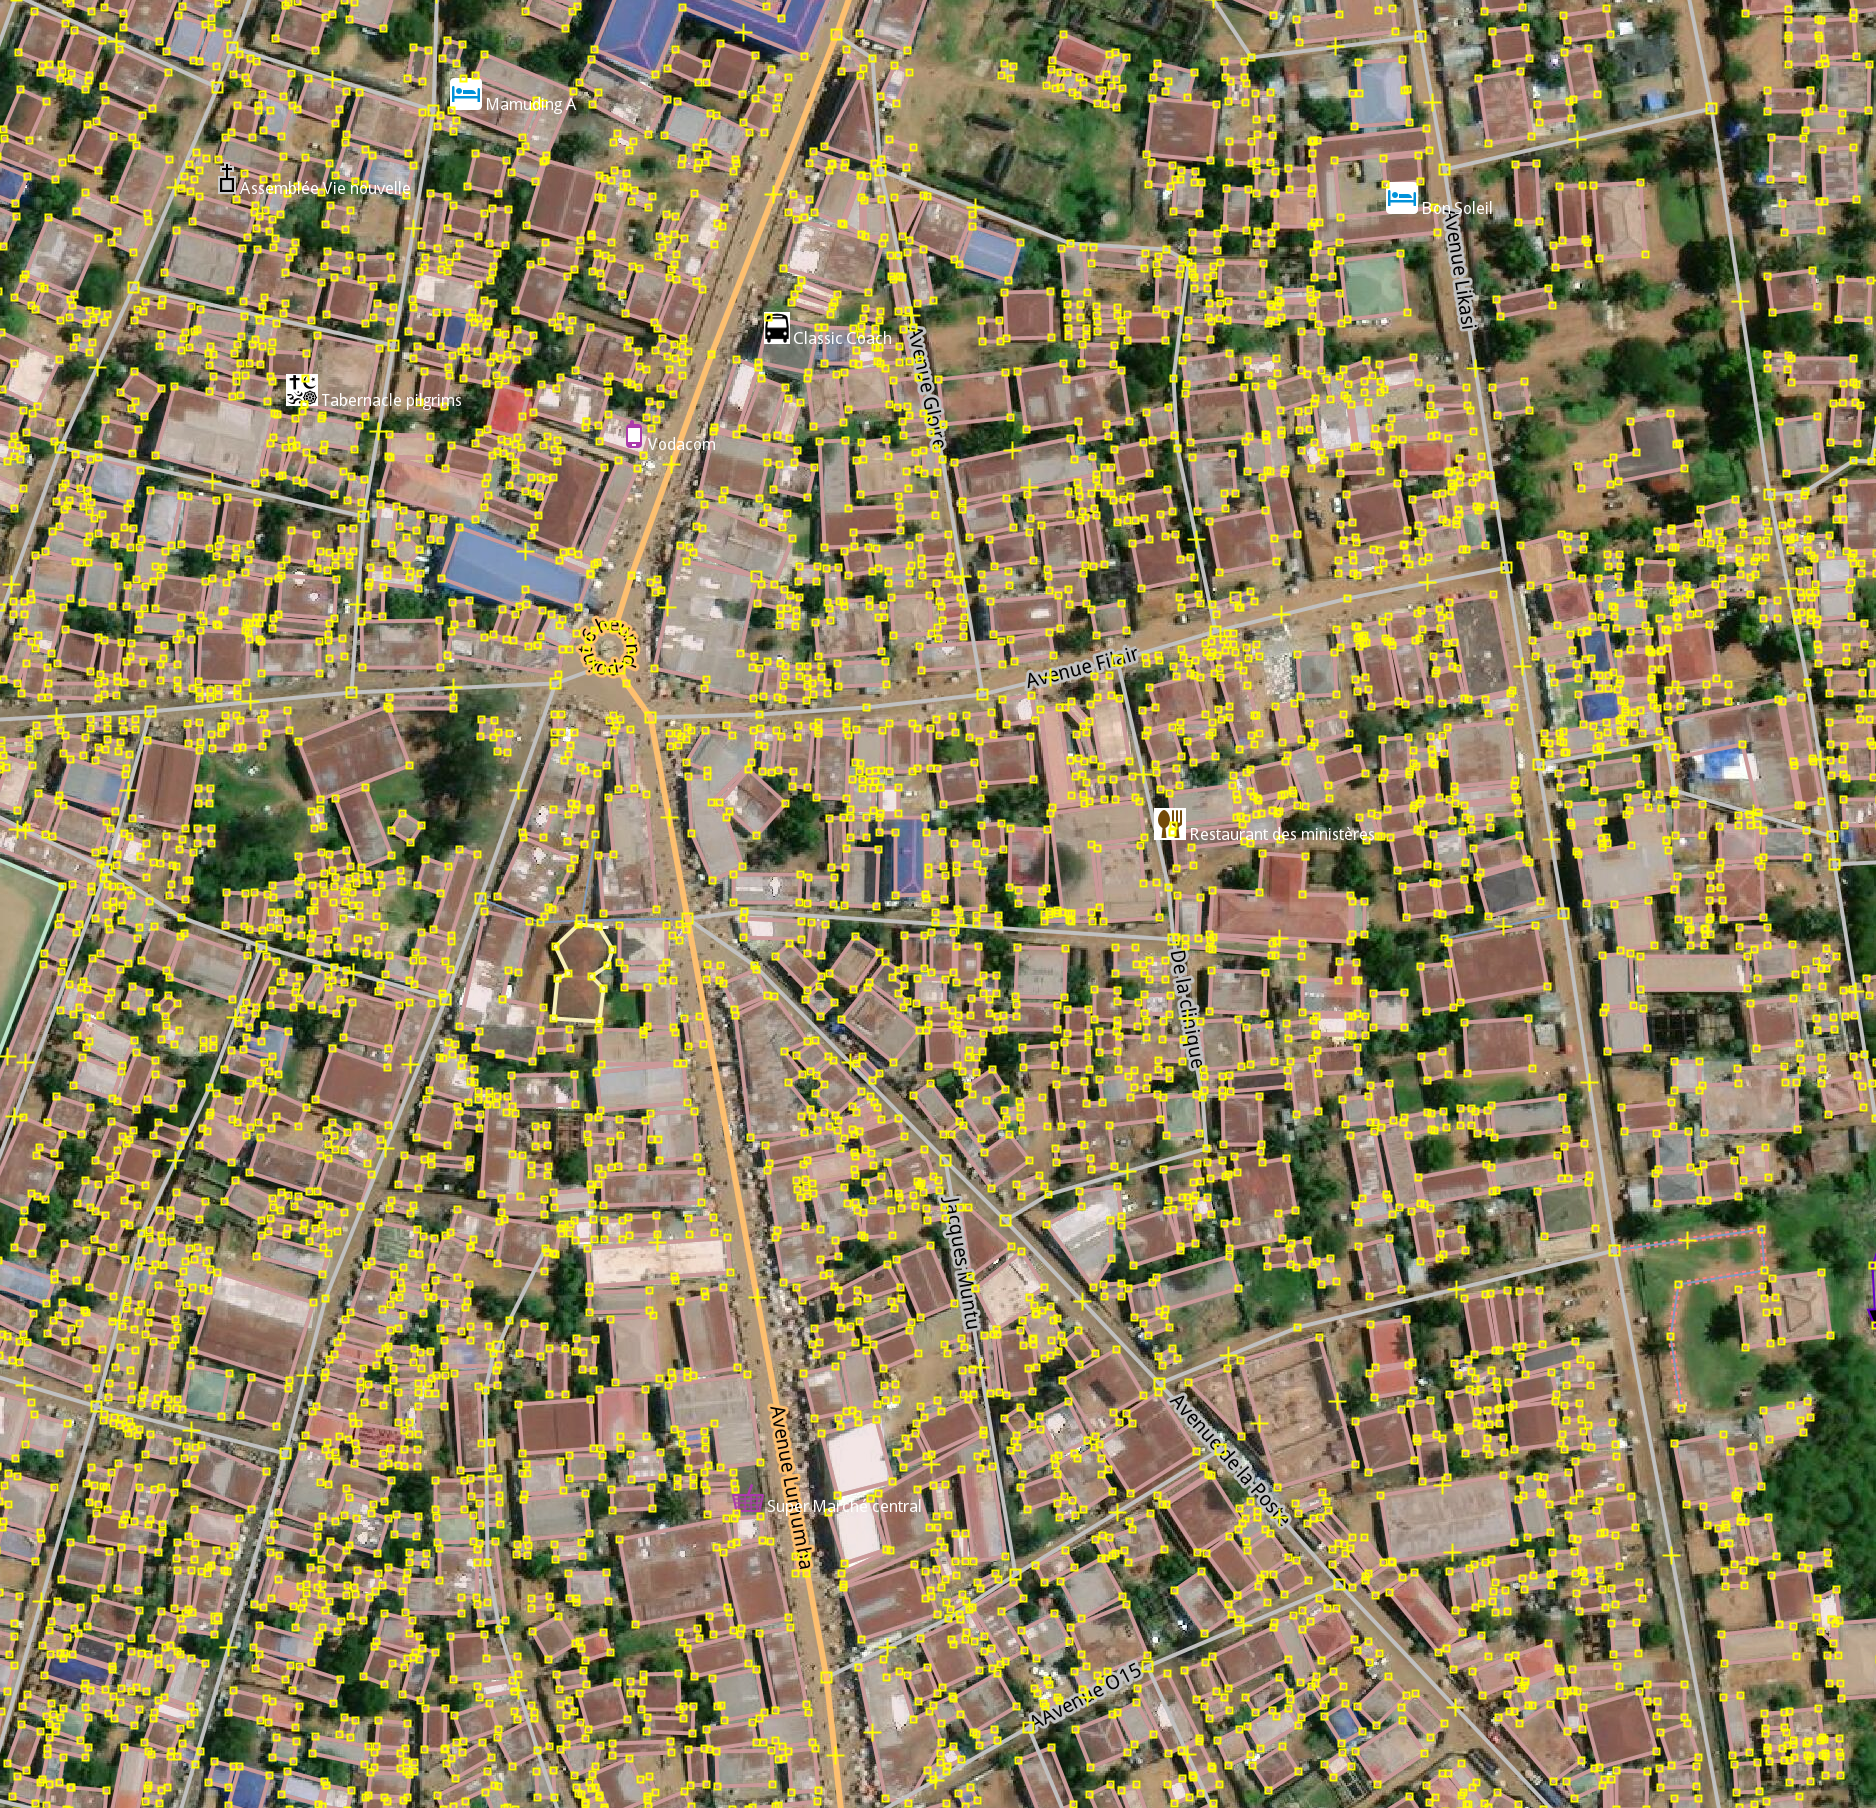
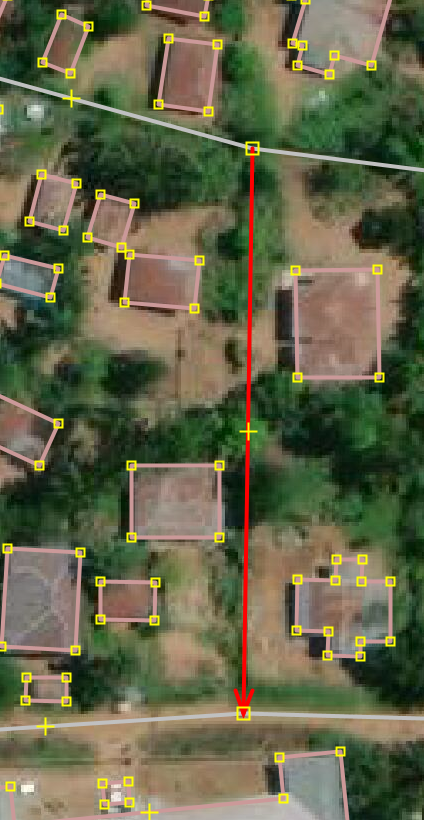
Fig. 19 Example of the map from JOSM with the Maxar Premium imagery of Tshikapa after the map team has added buildings#
Quality and currency of available imagery in base maps#
Levels |
Description |
|---|---|
High |
Imagery does not loses its resolution |
Medium |
Imagery loses its resolution but we can differentiate the buildings and highways for mapping |
Low |
Imagery loses its resolution but is difficult to differentiate the buildings for mapping |
Low to medium#
Prevalent across the health zones; if you circle between Mapbox and Maxar you usually can find a data source that is acceptable for adding buildings. These data make it harder to identify smaller roads.
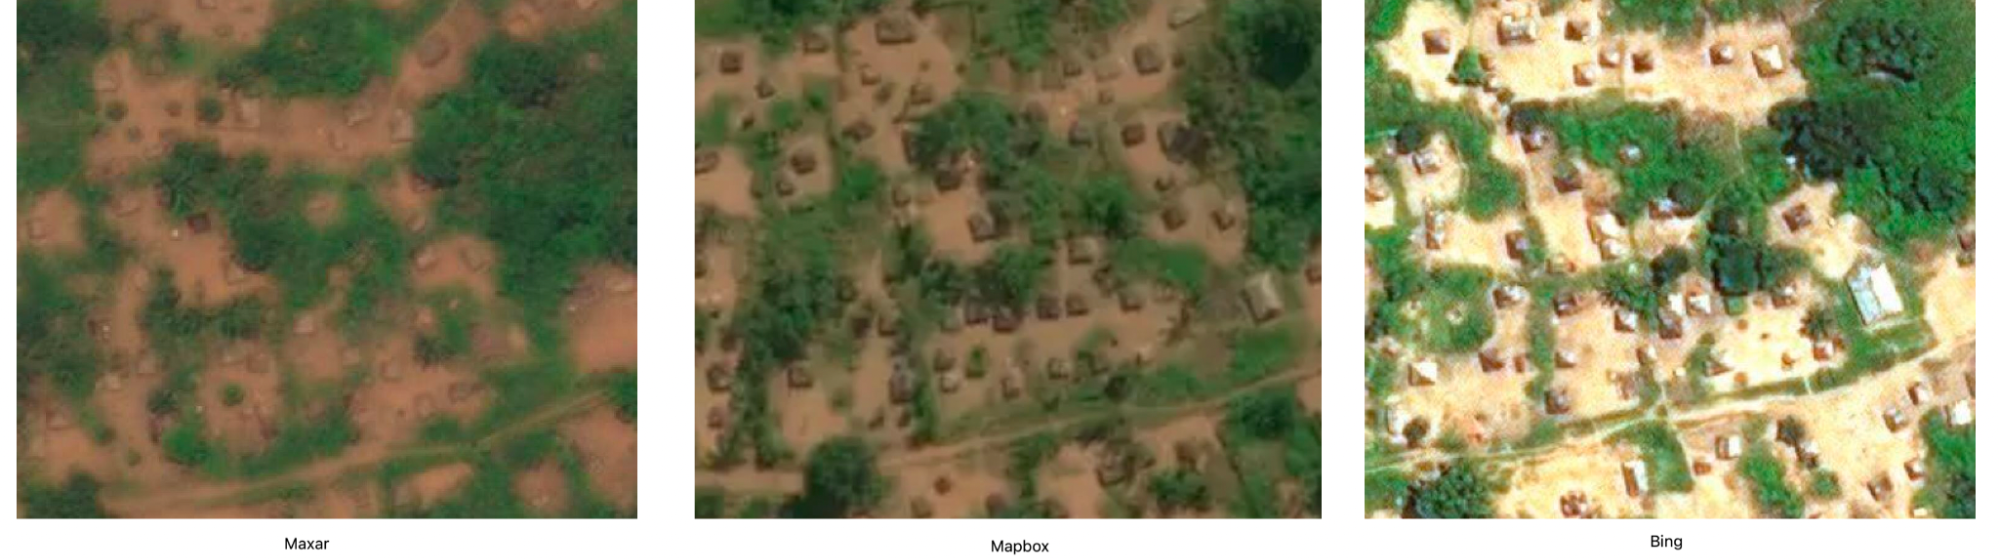
Fig. 20 Comparison of satellite imagery between Maxar, Mapbox, and Bing#
Bing is the most outdated image source in almost all Health Zones.
Lack of seeing the date when the satellite image was made the imagery of Bing, Maxar, Mapbox, or ESRI leads to time wasted trying to obtain the most up-to-date imagery data based on estimates (new buildings in an image compared to another, some forest that appears intact in older images, but is cut in newer images)
The most up-to-date satellite imagery available for the areas seems to be Maxar and Mapbox
Some of the roads needed to be readjusted to the Maxar or Mapbox imagery, they were traced using older Bing images or other sources and did not had GPX tracks to see the real location
Most of the Roads in bigger cities where traced using older imagery or bing maps, I would estimate that almost 10-20% of the roads in the cities could not exists in reality, or are pedestrian only at best. Because of the bad imagery and the lack of details this cannot be inferred just by satellite imagery alone. I would recommend using on the ground volunteers on bikes or cars equipped with a GoPro or a cellphone with Mapillary to capture photos and GPS coordinates that can be then used to find out the roads that actually exists. A bonus of using this method is the fact that you can also capture amenities, house numbers if they exist in the city that can be added by OSM volunteers to the map.
Quality of map edits#
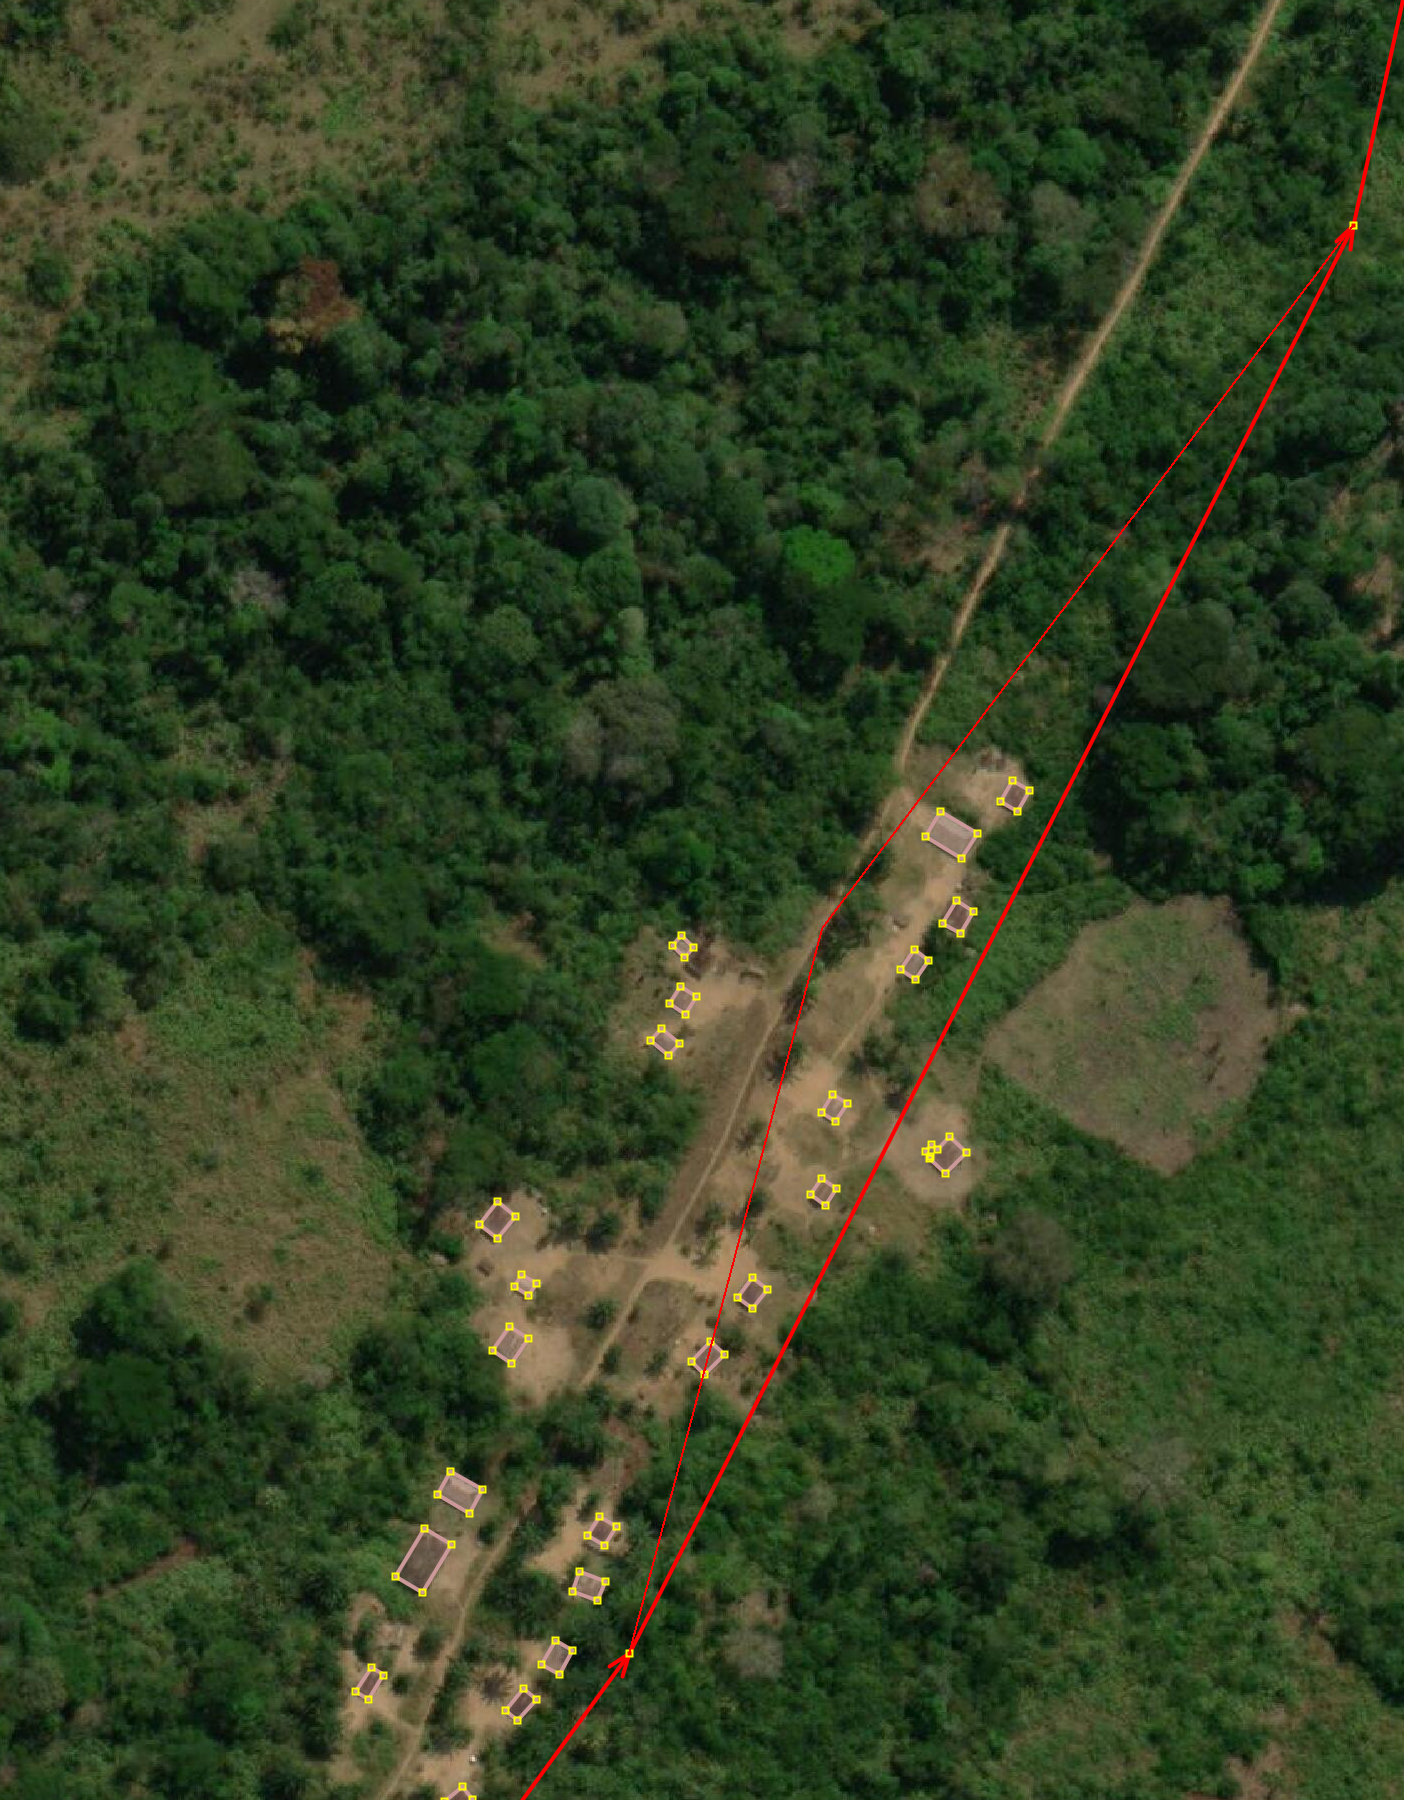
Checked for errors using JOSM editor, and fixed 2663 Crossing building/highway warnings that appeared because of the fact that the original roads were added using bing imagery, and most of the building tracing was done using maxar. Could not identify GPS traces so that we can see what is the real road, so moved the roads to be aligned with the Maxar Imagery.
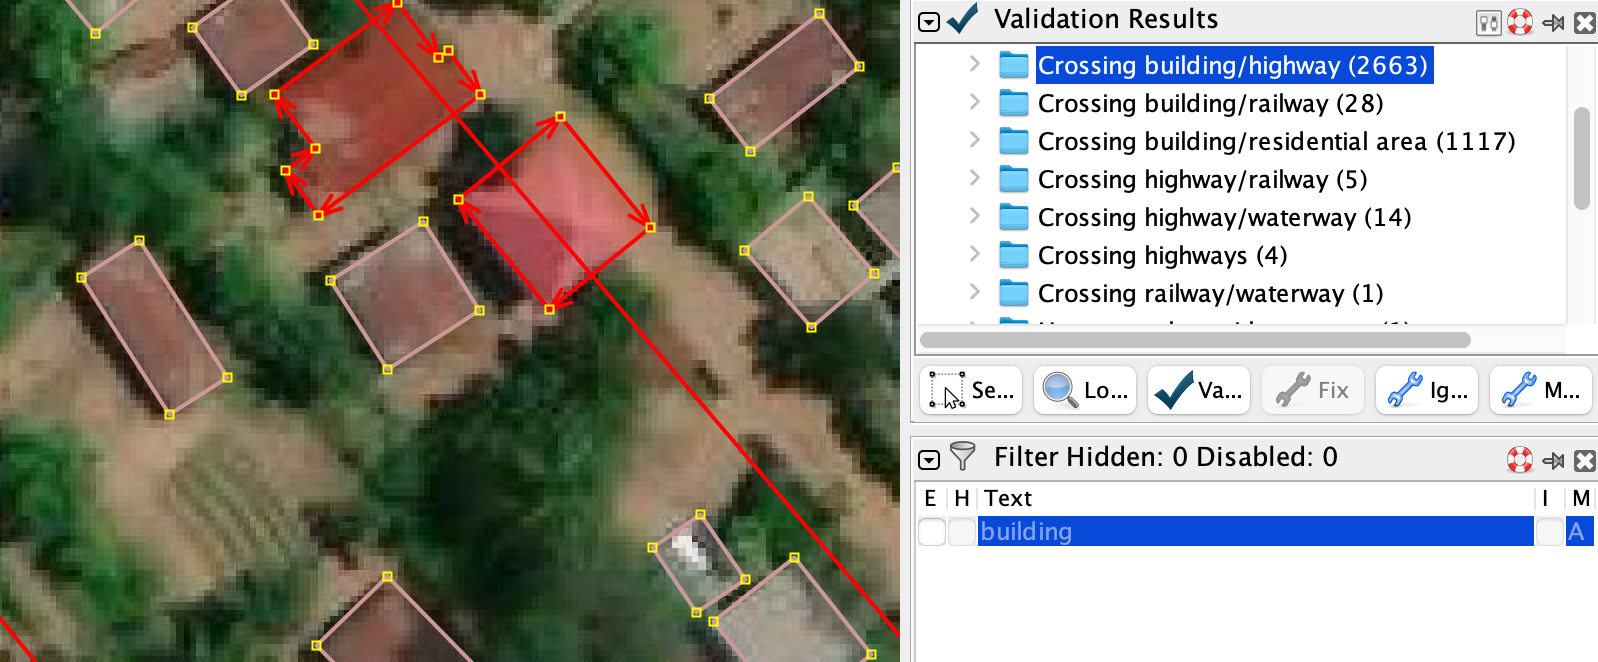
Fig. 25 Example of buildings and road crossing#
In the checking process I have modified or created 2100 ways. Most of them involved moving the road so that the old roads traced using Bing would aling to the Maxar projection, that was the most up to date imagery in most of the mapped areas used by the test while adding buildings.
The data that I got from Overpass API, a tool used to download data from OSM database, did not provided version history for the highway ways, so I used the below function in QGIS
CASE
WHEN length(regexp_replace("id",'way/','')) > 9 THEN 1 ELSE 0
END
Roads added are Yellow color, while in Green color you can see modified ways that have been adjusted. This works by the fact that in OSM, way IDs are auto increment, so the older the ID, the further back in time it was created. The ways I have created had around this value 1088815124, and if we calculate the length of the ID we get 10. The 1 billion node was created 10 months ago, so everything that is in Green is a node created earlier than 10 months ago that was modified in the quality control phase.
There were some node connecting the highway and building errors that were corrected. This happens because of the way JOSM works, if you try to add a node closer than a certain threshold, it will snap it and unite the two nodes. In this case when one of the mapper tried to add the building node it snapped and become united with the road. To fix this you select the building and press G (Unglue Way).
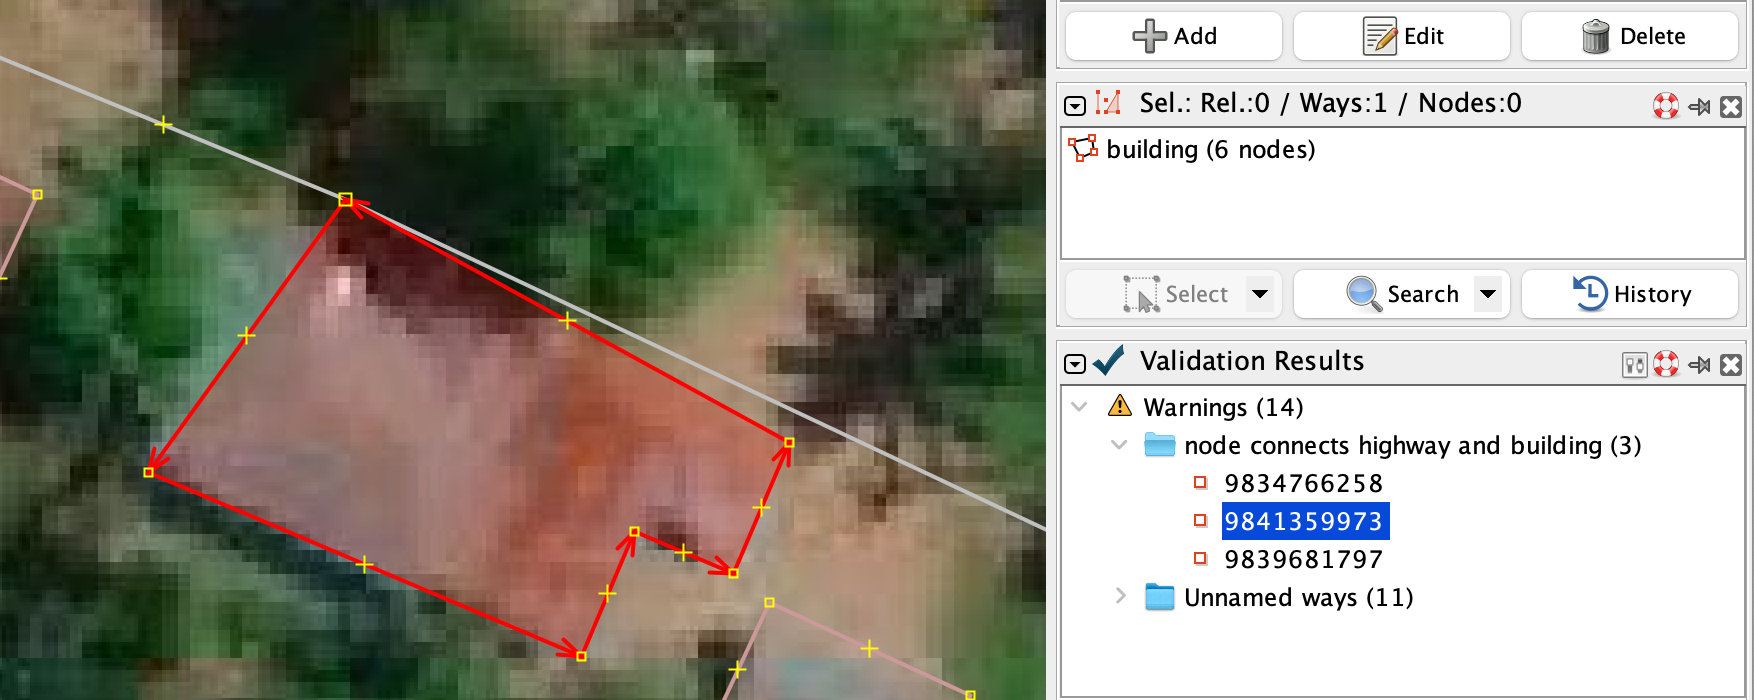
Fig. 28 JOSM example#
Speed of edits#
We will look at the first four mappers who added the most buildings to approximate how many buildings per hour they have added during the project.
The first added 57k buildings in 25 days = A average of 2280 buildings per day, or 285 buildings per hour (8h/day)
The second added 45k buildings in 22 days = A average of 2045 buildings per day, or 255 buildings per hour (8h/day)
The third added 45k buildings in 26 days = A average of 1730 buildings per day, or 216 buildings per hour (8h/day)
The fourth added 19k buildings in 20 days, working 5 hours per day = A average of 950 buildings per day, or 190 buildings per hour (5h/day)
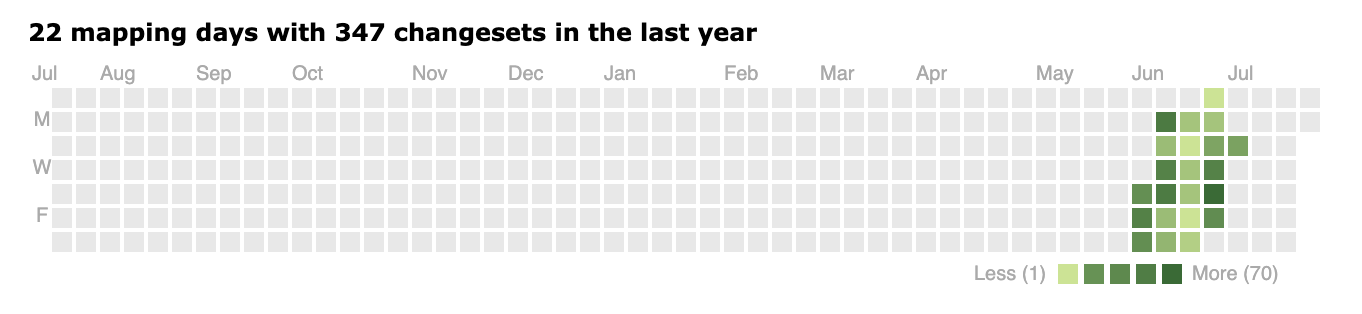
Fig. 29 Mapping speed#
JOSM tips#
Satellite images are sometimes made at an angle, so when drawing buildings from satellite imagery you will create a building that looks like the imagery from the satellite, but this is not an accurate representation of the ground truth.
We draw the building from the perspective that we have, but in the end the building should be drawn as it would look in the building plan. After drawing the buildings, you select it and you press Q to Orthogonalize the building.
When adding buildings from multiple imagery sources, first look and try to identify what imagery source is the most up to date. In most of the western world, we would expect buildings to not disappear so fast, so we can identify newer satellite imagery based on the newer buildings, removed forest in one imagery compared to another, new roads, etc. This is harder to do in Congo in the Kasai Health Zones as building tend to dissapear or be moved much more often.
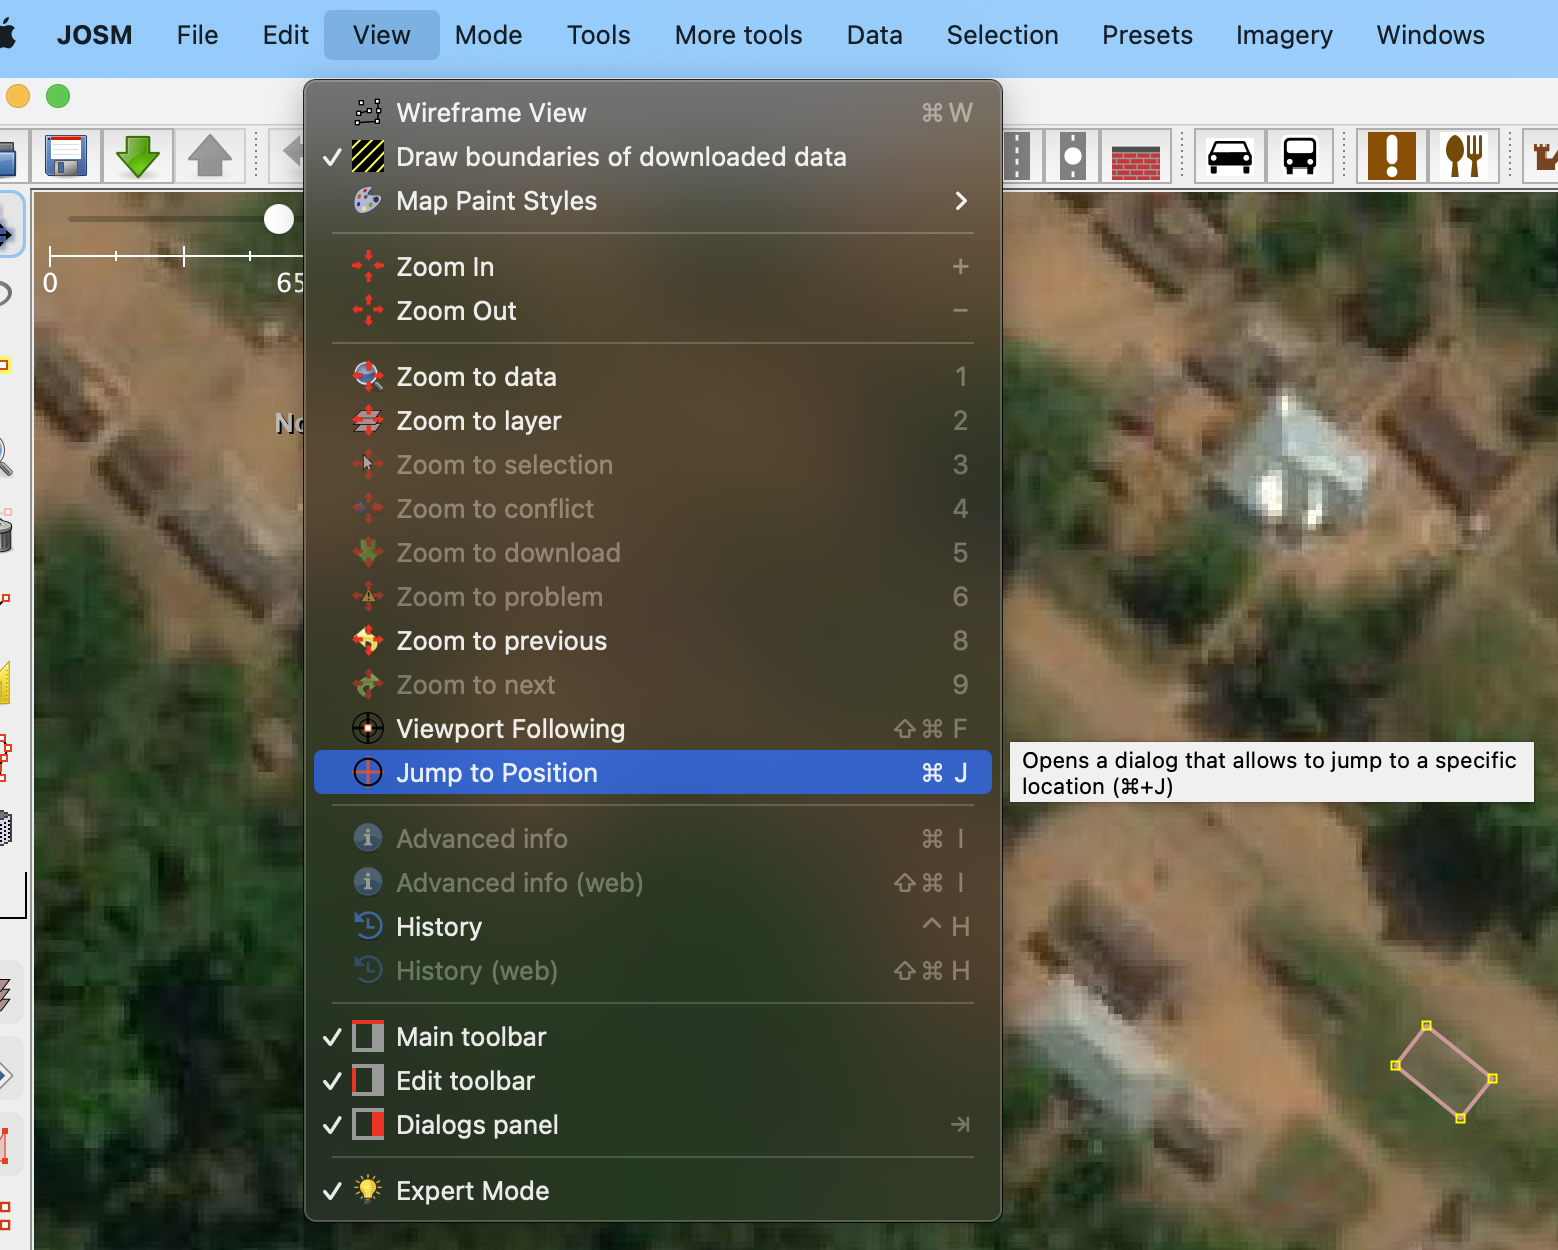
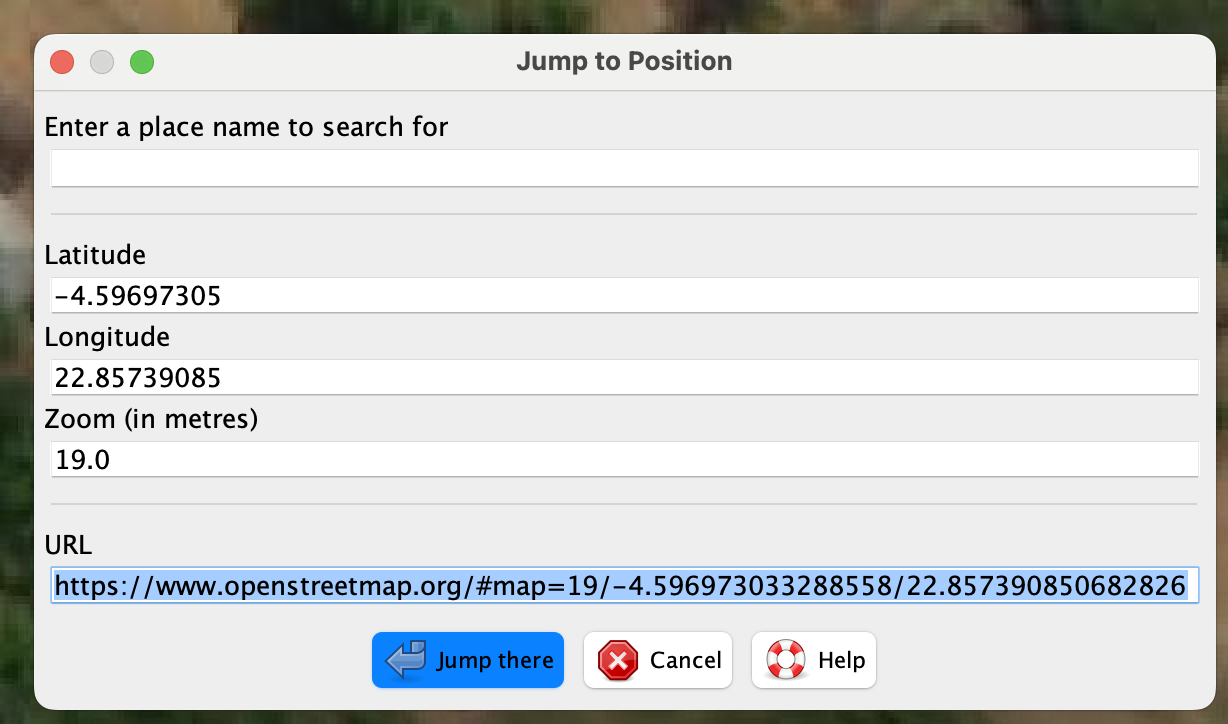
Let’s take this area as an example. To zoom to a specific location in JOSM, one needs to copy the link above and paste it inside the Jump to Position dialog box
We then need to adjust the Imagery offset so that the two different imagery sources are aligned. You do this in JOSM by going to Imagery -> Imagery offset and select to adjust one of the Imagery Layer. In this case, I adjusted the Bing aerial imagery layer.
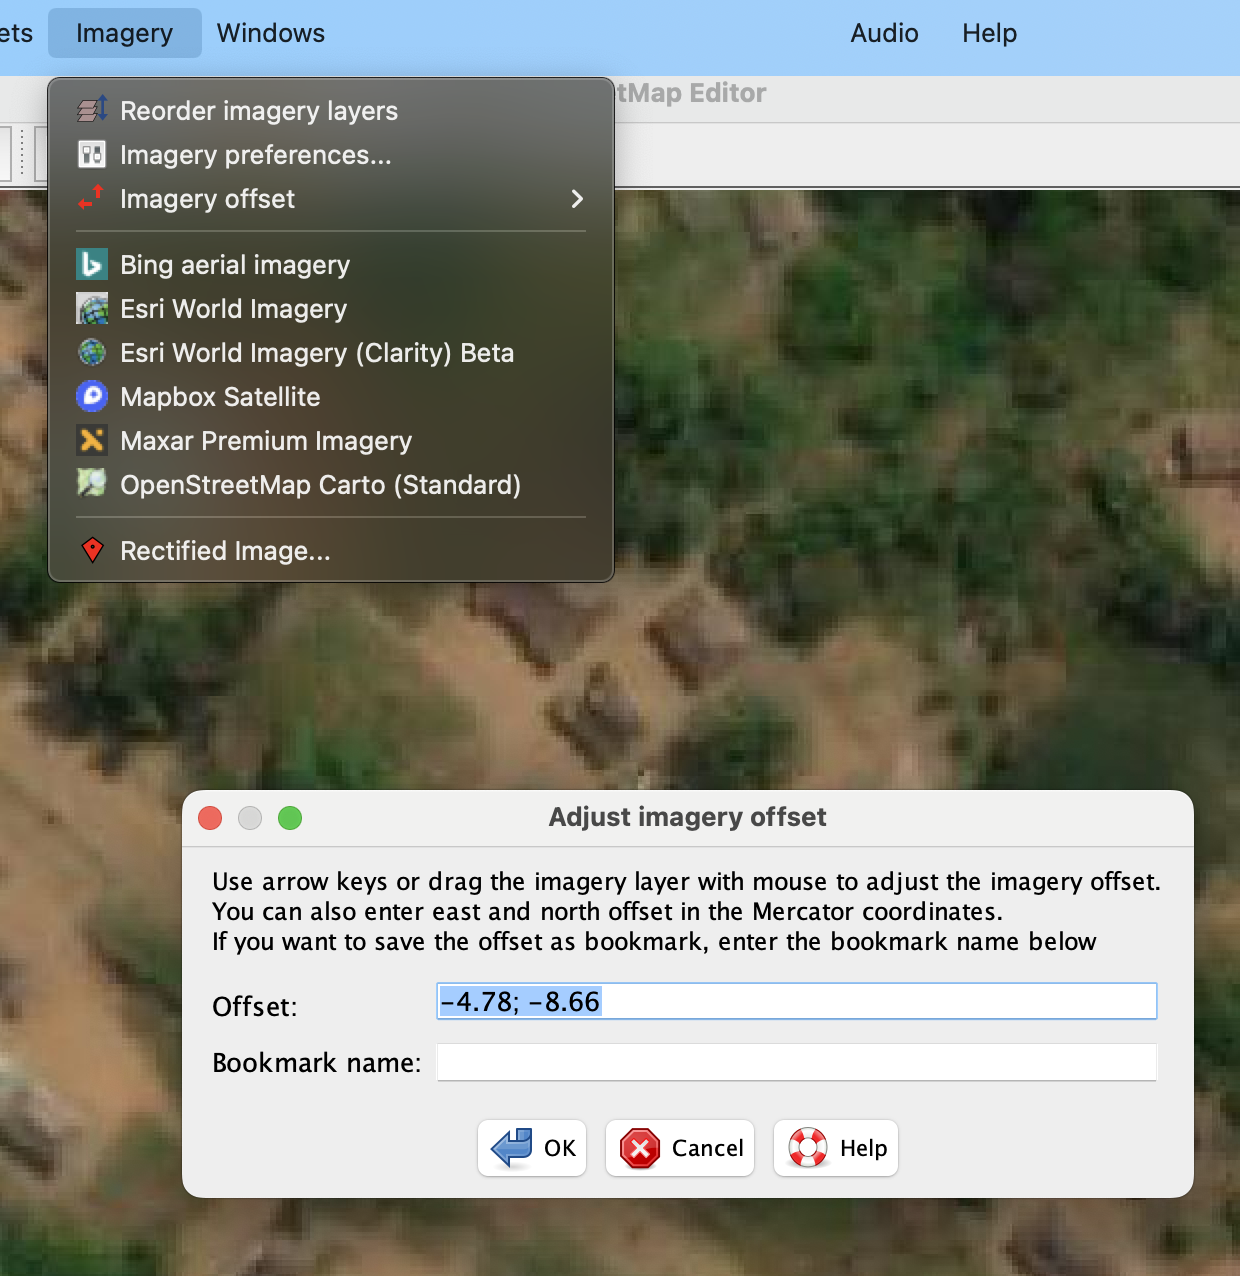
Fig. 34 JOSM example 3#
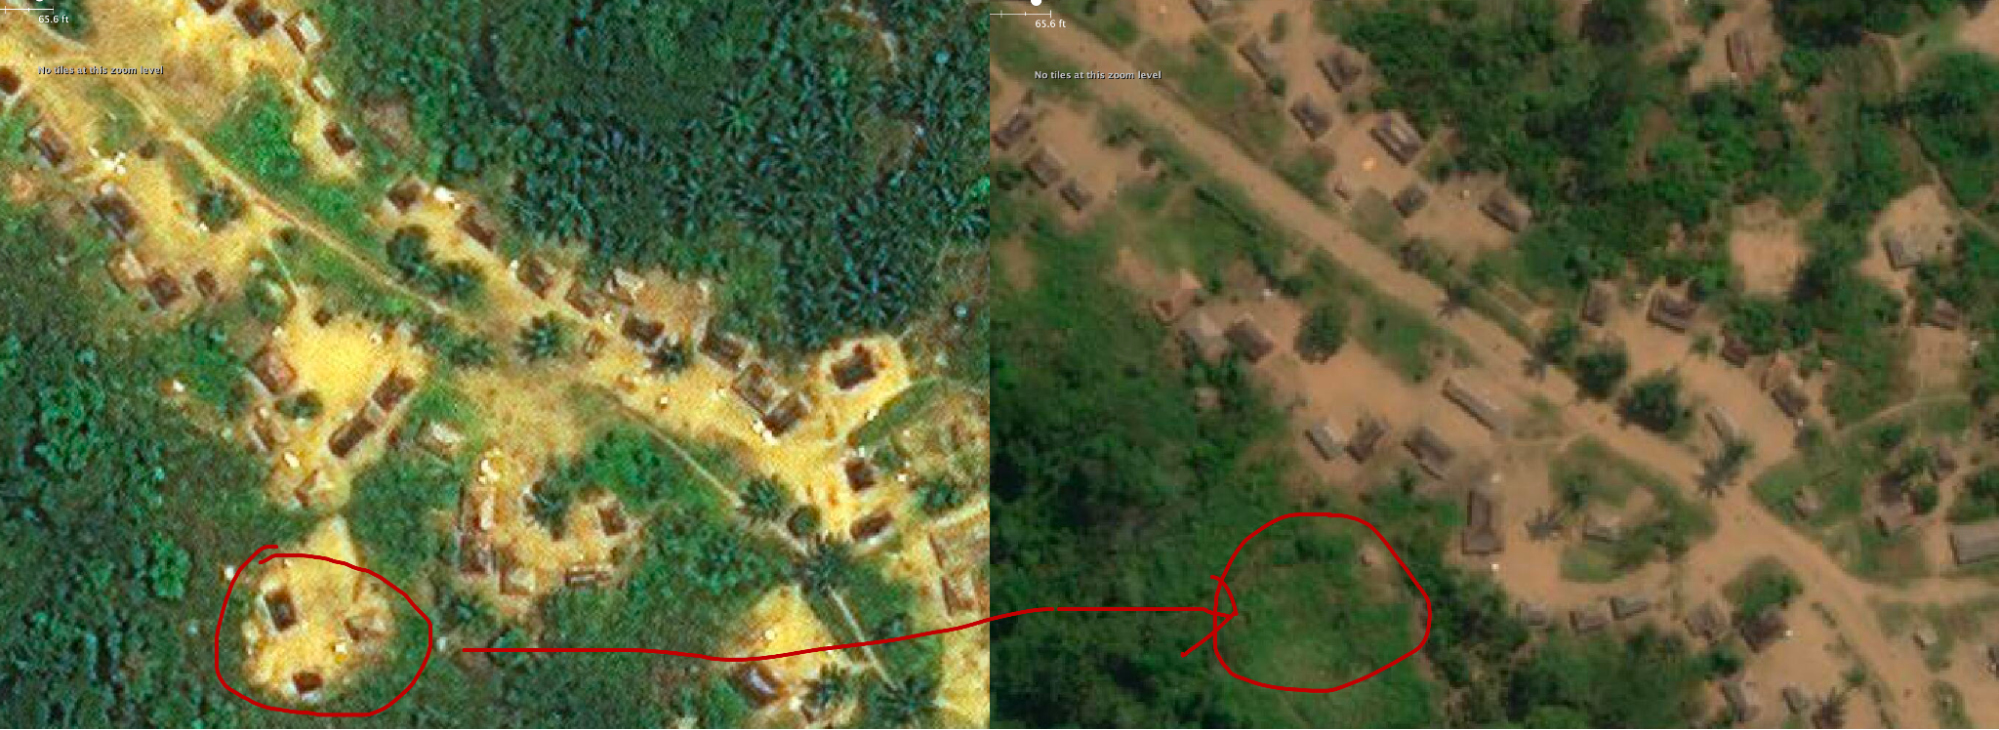
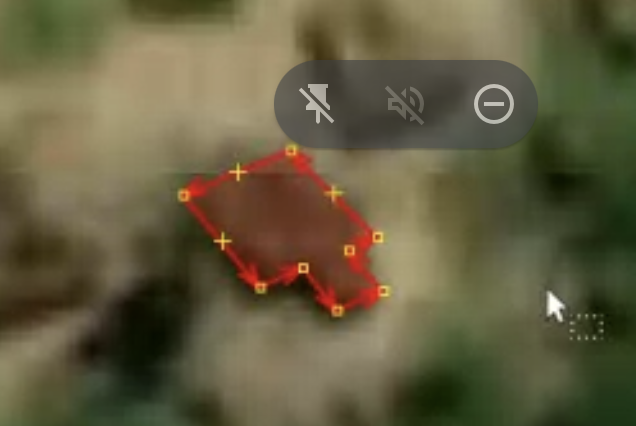
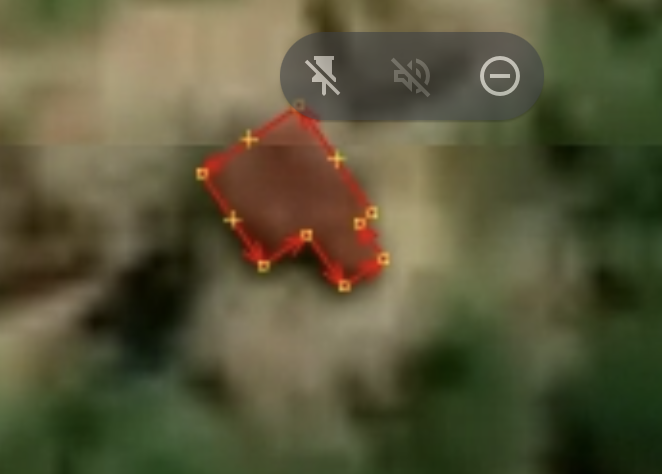
Fig. 35 Example building change#
In the image above, where on the left side we have old Bing Imagery, and on the right we have Maxar Imagery, almost 80% of the buildings have moved, disappeared or were combined in newer structures.
It does not recommend adding mixed buildings from different imagery sets, especially using bing imagery in Africa, it seems that the image is really old and it’s possible that most of the buildings there have disappeared.
When using JOSM and HOT Tasking Manager, check for building duplicates at the margins of tasks, as it is possible that both the persons from the adjacent tasks will draw the same building leading to duplicated buildings.
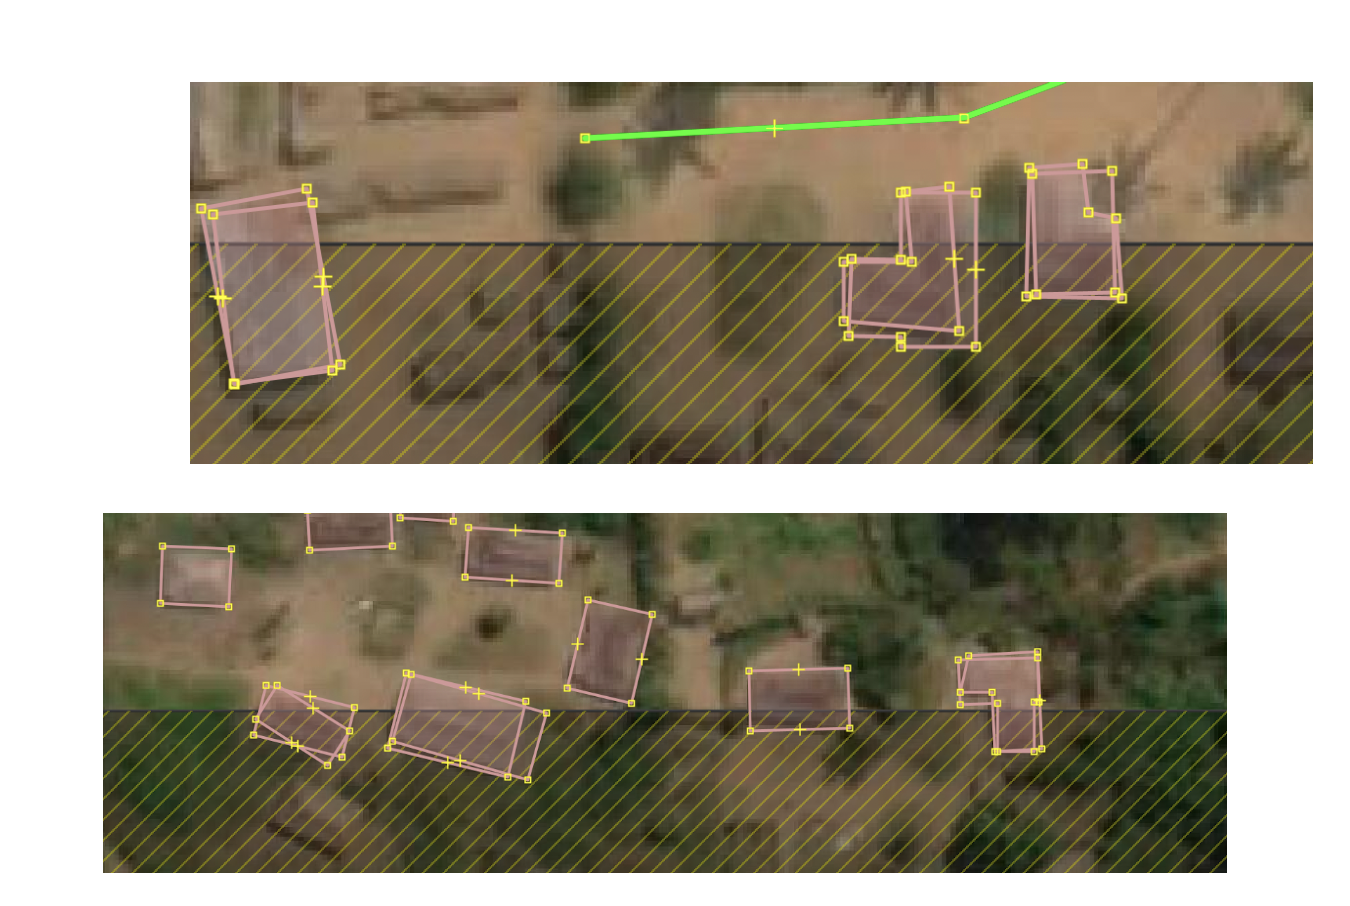
Fig. 36 Tasking manager overlap#
A good strategy recommend is to select “HOT Tasking Manager Tasks” for mapping that are at a distance of two or greater than other Tasks already reserved for editing by someone else, so you do not have common borders.