Urban Activity Dynamics During Republic Day in Istanbul#
In this case study, we apply our methodology to anonymized mobility data from Veraset to assess the impact of a large, planned public event on urban activity patterns. Understanding how populations visit urban areas during such events provides valuable insights for urban planning, infrastructure management, and emergency preparedness. We focus on Republic Day in Istanbul (29 October 2023), a major national holiday in Turkey marked by large public gatherings, celebrations, and increased activity across urban spaces. Using the Urban Space Usage Index, we identify deviations from typical activity patterns and examine how different areas of the city respond to the event.
1. Data#
1.1 Mobility Dataset#
The analysis is based on the Veraset Movement dataset, provided by Veraset as part of the Mobility Data collection from the Development Data Partnership. The dataset consists of anonymized mobile device location pings collected via a network of mobile applications and software development kits (SDKs). Each record includes geographic coordinates, a timestamp, and an anonymized device identifier. These data provide large-scale observations of human mobility, enabling the analysis of spatial and temporal patterns of urban activity.
1.2 Area of Interest (AOI)#
The analysis focuses on Istanbul, Turkey. The study area is defined using an administrative boundary shapefile (Figure 1, source).
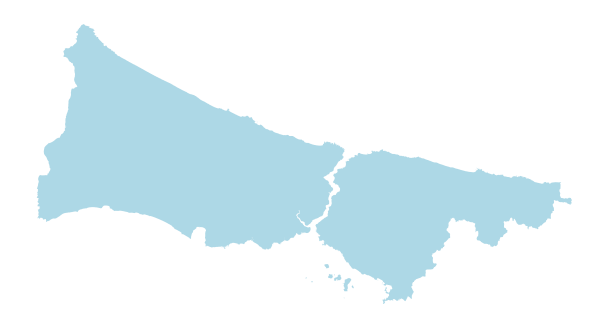
Figure 1. Administrative boundary of Istanbul used to define the area of interest (AOI). All mobility data are spatially clipped to this region and aggregated using the H3 hierarchical grid system.
We spatially discretize the area of interest using the H3 Uber hierarchical indexing at resolution 8. This corresponds to hexagonal cells of approximately 0.737 km². Each H3 cell (or hexagon) represents the spatial unit of the analysis.
1.3 Time window and study periods#
To capture mobility dynamics before, during, and after Republic Day, which occurs from 13.00 on 28 October to all 29 October, we extract data for the period 2 October to 10 November 2023, spatially clipped to the study area (see Figure 2).
We define three analysis periods:
Baseline period: 2-27 October
Event period: 28-29 October
Post-event period: 30 October - 10 November
The extracted dataset consists of approximately 23 million GPS points generated by 242,400 unique users.
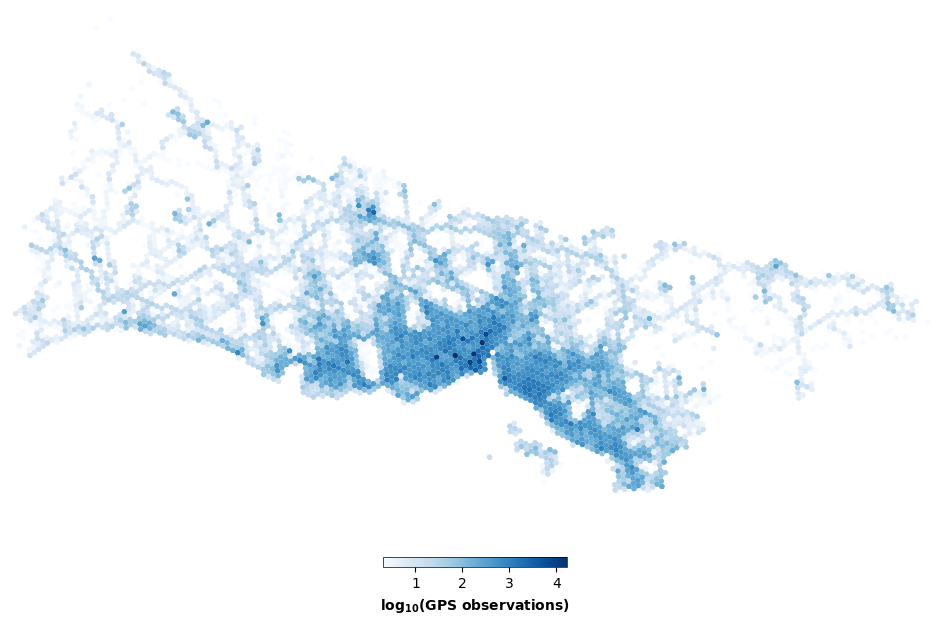
Figure 2. Spatial distribution of GPS observations shown as the average number of records per H3 hexagon (resolution 8). Higher values represent a greater concentration of recorded activity. The color scale is log₁₀-transformed, with darker blue tones indicating areas with more observations.
1.4 Preprocessing and filtering#
To ensure data quality and reduce noise, we apply a set of preprocessing steps. Users with very low daily activity are excluded, as they do not provide reliable information on spatial behavior. In particular, we retain users with at least three recorded points per day. As shown in Figure 3, increasing the minimum points-per-day threshold progressively removes low-activity users and reduces sharp spikes driven by users with only one or very few daily points, while preserving broadly consistent temporal trends across filtering levels.
In addition, H3 hexagons are retained only if they are consistently active throughout the observation period. Hexes with insufficient activity are removed to avoid unstable estimates and inflated Z-scores.
The final dataset consists of approximately 22,336,000 observations from 131,500 users covering 1,784 spatial units.
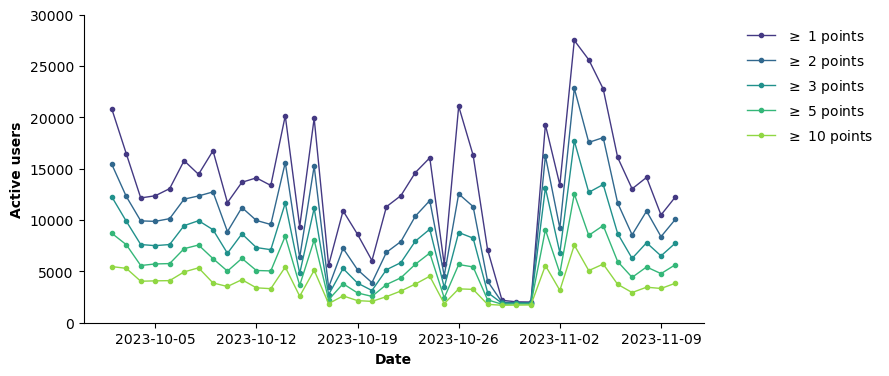
Figure 3. Daily number of active users retained under different minimum points-per-day thresholds (\(\geq\) 1,2,3,5, and 10 points). Increasing the threshold progressively removes low-activity users, reducing sharp spikes driven by users with only one or very few daily points, while preserving temporal trends.
2. Methods#
2.1 Urban Space Usage Index#
To capture spatial activity at a daily resolution, we use the Urban Space Usage Index (\(I\)), defined as the number of unique users visiting each H3 hexagon normalized by the total number of active users on that day:
where \(U_{h,d}\) is the number of unique users in hexagon \(h\) on day \(d\), and \(U_d\) is the total number of active users on day \(d\).
The index can be interpreted as the share of total observed activity occurring in each hexagon. The number of unique users is used as a proxy for human presence, assuming that higher user counts correspond to greater spatial utilization. For more details on the index, please refer to the Methodological Framework.
2.2 Deviation Measurement (Z-score)#
To identify event-driven deviations, we define a baseline period using pre-event days (2-27 October 2023). For each hexagon, we compute the baseline mean and standard deviation of the Urban Space Usage Index.
Deviations from typical conditions are quantified using a Z-score, computed for each hexagon and day as:
where \(\mu_h\) and \(\sigma_h\) are the average and standard deviation of \(I_{h,d}\) during the baseline period, respectively.
The Z-score measures how strongly observed activity deviates from expected baseline levels. Positive values indicate higher-than-expected activity, while negative values indicate lower-than-expected activity relative to baseline conditions. The magnitude (i.e., absolute value) of the Z-score reflects the strength of the deviation, with larger values indicating more pronounced anomalies.
3. Results#
3.1 Temporal evolution of urban activity#
The temporal evolution of the Urban Space Usage Index shows a noticeable shift in urban activity during the event period compared to typical conditions (see Figure 4). Activity levels rise in the days leading up to the event, peak on the event day, and decline shortly thereafter. As expected for a large planned event, this pattern suggests anticipatory and residual mobility effects, likely driven by preparation activities, public gatherings, and increased presence in central areas.
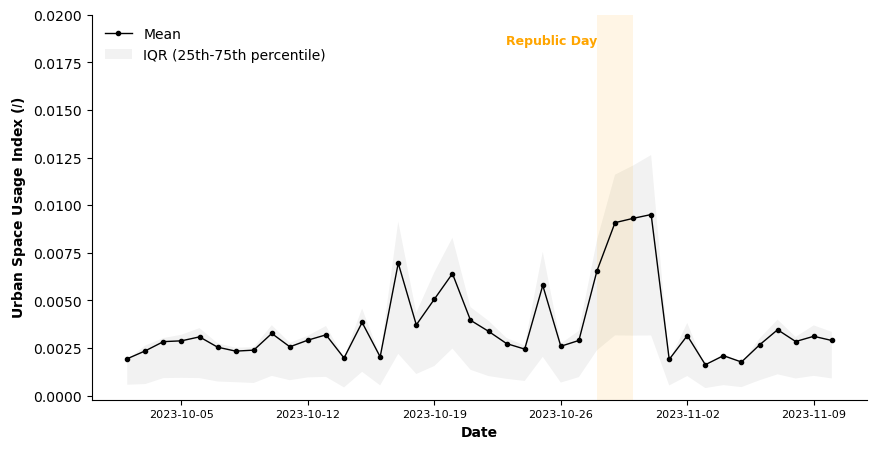
Figure 4. Time series of the average Urban Space Usage Index (I) across all hexagonal cells in Istanbul, with shaded area representing the interquartile range. The highlighted band marks the Republic Day period (28-29 October), during which a clear increase in activity is observed.
3.2 Anomaly detection#
To assess whether changes in activity correspond to statistically significant deviations from typical conditions, we use the Z-score, which measures how many standard deviations observed activity deviates from its baseline.
As shown in Figure 5, during the baseline period, as expected, Z-scores fluctuate around zero, indicating stable activity levels. Two localized positive peaks are observed in mid-October, which may be associated with known protest events and reflect short-lived increases in mobility (see, e.g., EFE, 18 Oct 2023 and Balkan Insight, 20 Oct 2023).
The Republic Day event exhibits a clear increase in Z-score, beginning in the days preceding the event and peaking during the main celebration.
On 28 October, the day preceding the Republic Day main event, the average Z-score rises from -0.2 to 2.13, indicating a positive deviation from baseline conditions and marking the start of increased activity. On the main event day, 29 October (Republic Day), the average Z-score is 4.05, indicating an extreme positive anomaly due to increased activity relative to normal conditions. This peak is markedly higher than all other fluctuations observed in the time series.
On the day following the event, Z-scores remain elevated, likely reflecting continued celebrations extending past midnight and into the following day. After 31 October, the Z-score rapidly declines, returning to values close to zero.
This quick recovery toward typical mobility patterns suggests that the observed temporary disruption is closely associated with the Republic Day event.
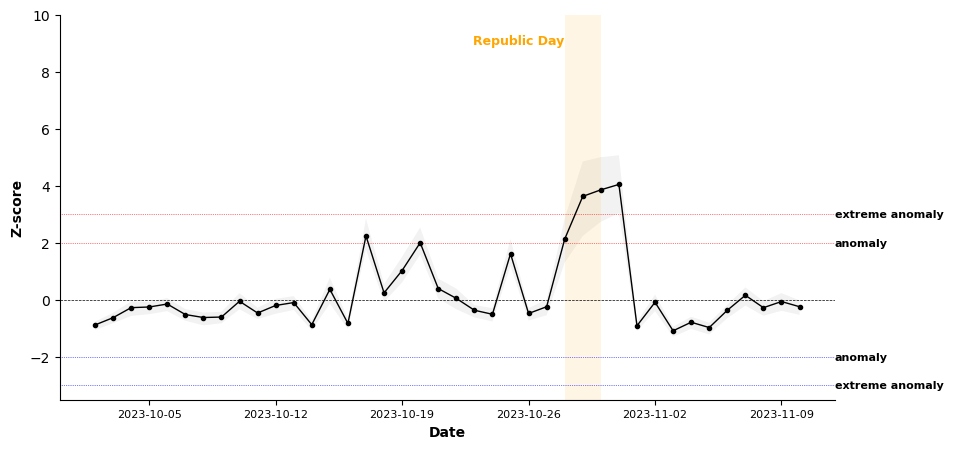
Figure 5. Time series of the average Z-score of the Urban Space Usage Index across hexagons in Istanbul, with shaded area representing the interquartile range. Horizontal dashed lines indicate anomaly thresholds. The highlighted band marks the Republic Day period (28-29 October), during which activity reaches extreme positive deviations.
3.3 Spatial distribution of anomalies#
The map in Figure 6 illustrates the spatial distribution of Z-scores across hexagonal cells on 29 October (Republic Day). It shows that the increase in activity is not confined to specific locations but is instead widely distributed across the metropolitan area of Istanbul, including airport areas and major road infrastructure. This pattern confirms that the anomaly is spatially diffuse, affecting both central areas and peripheral zones.
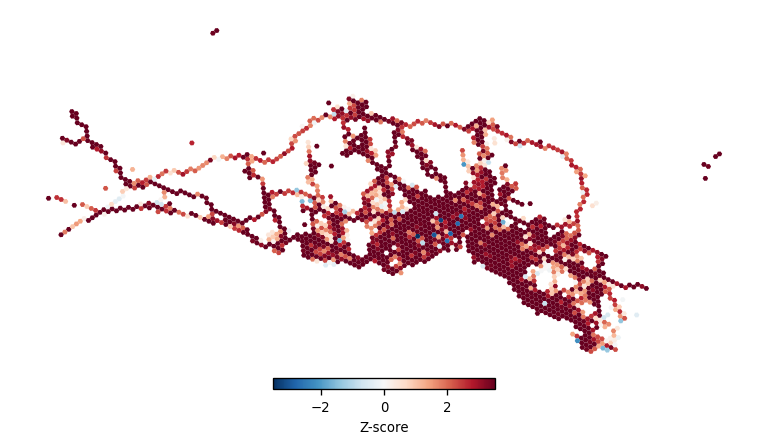
Figure 6. Map of the Z-score of the Urban Space Usage Index across H3 hexagonal cells in Istanbul on 29 October 2023. Warmer colors indicate higher-than-expected activity, showing a widespread increase across the metropolitan area.
We further examine the evolution of Z-scores over the entire observation period. During the baseline phase, Z-scores remain close to zero. On Republic Day, the map becomes uniformly dominated by high values. Following the event, Z-scores rapidly decline, returning to baseline levels consistent with typical mobility patterns (Figure 7).
Figure 7. Interactive map of Z-score of the Urban Space Usage Index across H3 hexagonal cells in Istanbul. The animation shows the day-by-day evolution of activity levels, with colors indicating relative intensity. The play control allows exploration of temporal dynamics before, during, and after Republic Day.
3.4 Spatial and Functional Characterization of Activity#
To interpret the spatial distribution of activity, each hexagonal cell is associated with both land use and functional activity. For land use, we assign each hexagon a dominant category (e.g., residential, commercial, industrial, green areas), capturing the physical organization of urban space. In contrast, the functional layer is derived from POIs: for each hexagon, we count the number of POIs in different activity categories (e.g., schools, hospitals, parks, transport hubs, commercial venues). For more details on the land use and functional activity methodology, refer to Spatial Characterization of Urban Units.
Land-use and POI data are derived from OpenStreetMap (OSM) and accessed via Geofabrik extracts (https://download.geofabrik.de/europe/turkey.html). To ensure temporal consistency with the mobility data, which refer to 2023, we use OSM snapshots from January 2023. © OpenStreetMap contributors, licensed under the Open Database License (ODbL).
Land Use Analysis#
As shown in Figure 8, all categories exhibit a substantial increase in activity during the event, with average Z-scores above 2.45. The simultaneous increase indicates that the anomaly is not localized but affects the entire area of interest.
Construction areas show the strongest deviation (Z = 3.15), followed by residential (Z = 3.04), green spaces and water bodies (Z = 2.98), and commercial areas (Z = 2.92). These results indicate that the impact extends beyond core economic zones to include living environments and open spaces. In contrast, industrial (Z = 2.45) and farmland areas (Z = 2.53) display comparatively lower increases.
These patterns are consistent with changes in absolute Urban Space Usage Index. Commercial areas, for instance, increase markedly (from 0.00907 to 0.01671), while residential areas show a similarly strong relative increase (from 0.00328 to 0.00811), confirming a broad intensification of both social and economic activity.
Overall, this indicates that the event amplifies existing spatial usage patterns rather than fundamentally altering them.
Land Use |
Z-score (event) |
I (event) |
I (baseline) |
|---|---|---|---|
commercial |
2.92 |
0.01671 |
0.00907 |
industrial |
2.45 |
0.00808 |
0.00417 |
construction |
3.15 |
0.01066 |
0.00399 |
green |
2.98 |
0.00863 |
0.00360 |
residential |
3.04 |
0.00811 |
0.00328 |
water |
2.98 |
0.00654 |
0.00250 |
farmland |
2.53 |
0.00511 |
0.00199 |
Figure 8. Time series of the average Z-score of the Urban Space Usage Index for different land-use classes, with horizontal dashed lines indicating anomaly thresholds. The highlighted band marks the Republic Day period (28-29 October), during which all land-use categories exhibit a sharp increase, reaching extreme positive anomaly levels.
Functional (POI-Based) Analysis#
We then examine activity across functional layers derived from POIs. As shown in Figure 9, all categories display consistently high Z-scores (= 2.7-3.5), indicating that the increase in activity spans multiple urban functions and is not concentrated in specific sectors. Transport-related locations show positive deviations, with train stations displaying the highest Z-score among the considered functional areas (Z = 3.46), and airports also showing an increase in mobility flows (Z = 3.08).
Hospitals (Z = 3.37) and tourism-related locations (Z = 3.29) also display strong anomalies. Commercial and social venues (e.g., malls, restaurants, and shops) show Z-scores above 3. Infrastructure elements such as highways (Z = 2.89) exhibit comparatively lower deviations, reflecting their role as transit corridors rather than primary destinations.
These patterns are consistent with changes in the Urban Space Usage Index. Several categories more than double their baseline levels, including train stations (from 0.00597 to 0.01506) and parks (from 0.00359 to 0.00956), highlighting a strong intensification of both mobility and recreational activities.
Overall, the results indicate that the event generates a coordinated increase across mobility, social, and service-related functions, with strong effects in transport hubs and public gathering spaces.
POI layer |
Z-score (event) |
I (event) |
I (baseline) |
|---|---|---|---|
malls |
3.03 |
0.01567 |
0.00980 |
universities |
2.77 |
0.01720 |
0.00970 |
hospitals |
3.37 |
0.01562 |
0.00751 |
tourism |
3.29 |
0.01371 |
0.00626 |
train stations |
3.46 |
0.01506 |
0.00597 |
schools |
3.26 |
0.01247 |
0.00529 |
offices |
3.23 |
0.01203 |
0.00511 |
restaurants |
3.25 |
0.01111 |
0.00497 |
shops |
3.13 |
0.01069 |
0.00470 |
highways |
2.89 |
0.01022 |
0.00406 |
parks |
3.21 |
0.00956 |
0.00359 |
airports |
3.08 |
0.00749 |
0.00274 |
Figure 9. Time series of the average Z-score of the Urban Space Usage Index for different functional layers, with horizontal dashed lines indicating anomaly thresholds. The highlighted band marks the Republic Day period (28-29 October), during which all layers exhibit a sharp increase, reaching extreme positive anomaly levels.
4. Conclusions and Key Findings#
This analysis quantifies the impact of the planned event Republic Day on urban activity patterns in Istanbul using anonymized mobility data and the Urban Space Usage Index.
The main findings are:
1. Urban activity increases in the days leading up to the event, peaks on Republic Day, and rapidly returns to baseline levels, indicating that the observed changes are closely associated with the event.
2. Z-scores reveal a statistically significant increase in activity during the event, with values reaching extreme anomaly levels relative to baseline conditions.
3. The increase in activity is distributed across the metropolitan area and observed across all land use types and functional layers. While some differences emerge, these variations are relatively modest.
Overall, these results demonstrate that the proposed framework can effectively detect and characterize anomalous periods of urban activity.
Policy relevance#
This analysis can support the planning and management of large public events by showing when and where activity increases relative to typical conditions. For Republic Day in Istanbul, the results indicate a strong but temporary increase in activity, peaking on the main event day and remaining elevated the following days before returning to baseline levels. Since the increase is spatially widespread and observed across multiple land-use and functional layers, these results can help anticipate pressure on transport hubs, public spaces, commercial areas, tourism-related locations, and essential services. This information can inform crowd management, public transport planning, pedestrian and road flow control, emergency preparedness, and municipal service allocation.
Limitations#
This analysis is subject to some limitations. Mobility data may not fully represent the entire population, as it depends on smartphone usage and data coverage. In addition, spatial aggregation into H3 cells may smooth local variations.