Spatial Characterization of Urban Units#
The objective of this section is to define a methodology to characterize urban space at the level of spatial units, enabling the analysis of mobility patterns across different urban contexts.
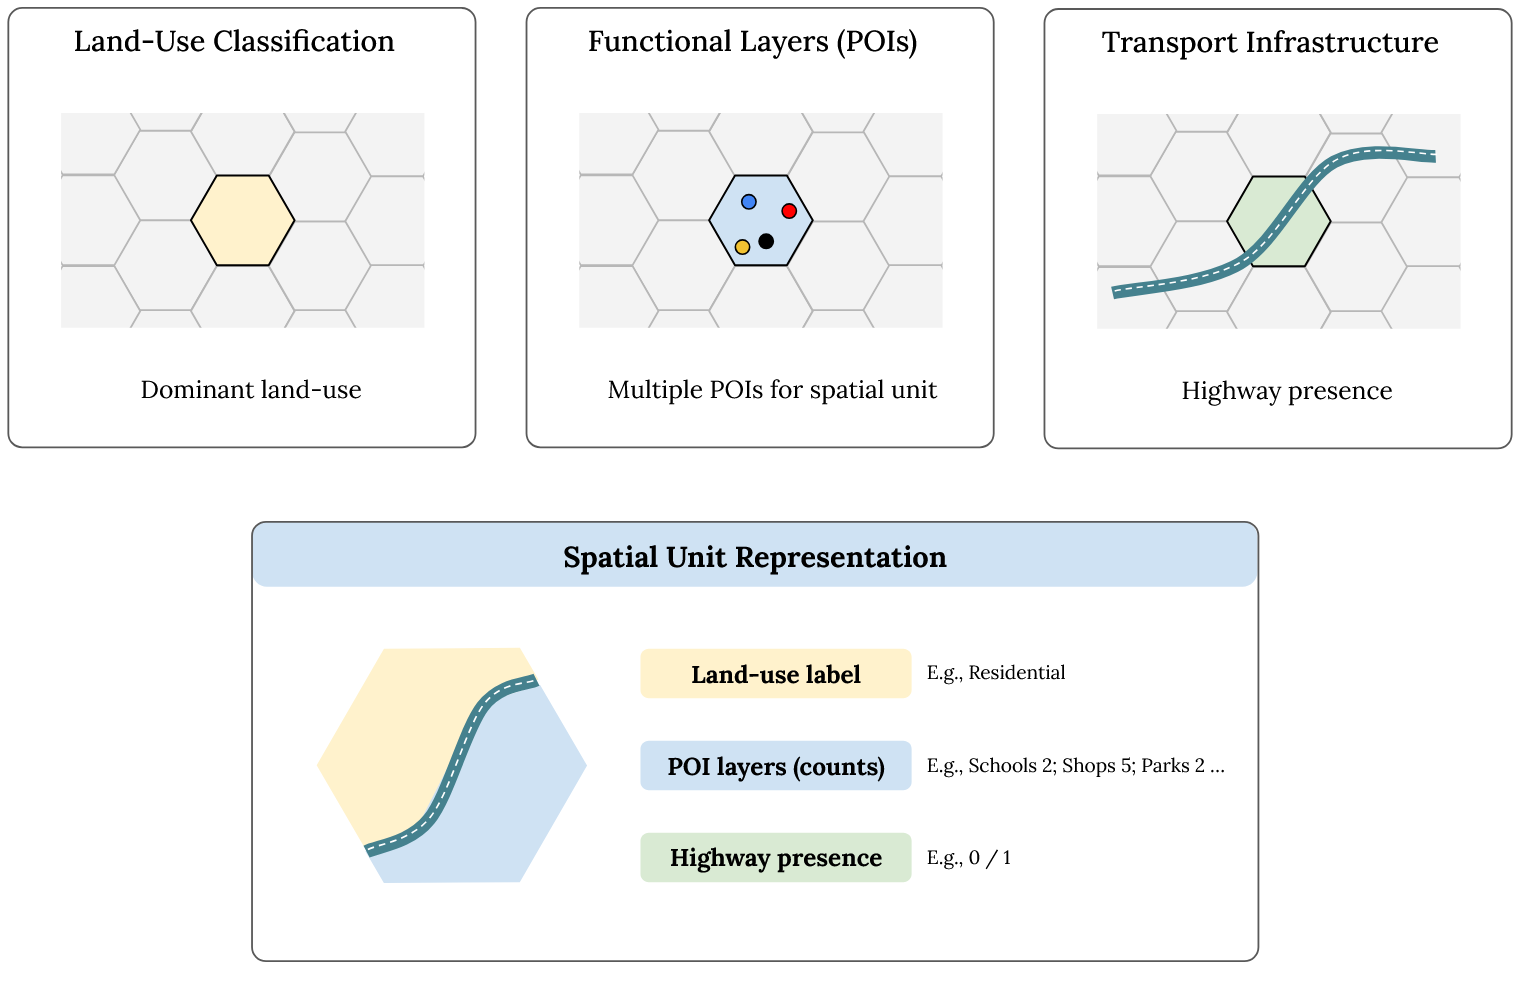
Specifically, the framework aims to: (i) assign a dominant land-use label capturing the physical structure of each spatial unit; (ii) represent urban functions through POI-based layers reflecting the presence of activities; and (iii) incorporate transport infrastructure indicators.
1. Data Source#
To assign land-use and functional layers, we use geospatial data derived from OpenStreetMap (OSM), accessed through Geofabrik extracts. To ensure temporal consistency with the mobility data (year 2023), we rely on OSM snapshots corresponding to January 2023.
The exact extracts used for the analysis covering Istanbul (Turkey) and Manila (Philippines) are accessed via Geofabrik.
We extract three main types of geospatial features: (i) polygonal features (e.g., land-use areas, parks, industrial zones), (ii) building footprints, and (iii) points of interest (POIs) (e.g., hospitals, schools, shops).
© OpenStreetMap contributors, licensed under the Open Database License (ODbL).
2. Methodology#
We assign a semantic interpretation to each spatial unit (e.g., H3 hexagons), enabling the analysis of activity patterns across different types of land use and urban functions.
We distinguish between land use and urban functions, as they capture complementary aspects of the urban environment. Land use describes the physical and structural characteristics of space (e.g., residential, industrial, green areas), while urban functions capture the activities and services present in each location (e.g., healthcare, transport, commerce), reflecting how space is actually used.
2.1 Land-Use Classification of Spatial Units#
Each spatial unit is assigned a dominant land-use label based on its spatial overlap with OSM features.
(i) Polygon-Based Classification We first classify OSM polygons into the following categories: residential, commercial, industrial, construction, farmland, green areas, and water bodies. The classification is based on OSM tags such as landuse, natural, and leisure.
Polygons are then intersected with the spatial units, and for each unit we compute the share of area covered by each land-use class. Each spatial unit is assigned the dominant class, namely the class with the largest intersecting area.
(ii) Building-Based Fallback For spatial units not classified through polygons, building footprints are used as a fallback. Buildings are categorized into industrial (e.g., warehouses) and commercial (e.g., offices, retail) and assigned using the same spatial intersection logic.
(iii) Final Assignment The final land-use label for each spatial unit is defined hierarchically: polygon-based classification (if available), otherwise building-based classification, and otherwise assigned to other.
2.2 Functional Layers (POI-Based Analysis)#
For functional layers, we do not assign a single label to each spatial unit, as multiple activities typically coexist within the same area (e.g., schools, shops, parks). Assigning only one category would therefore be overly restrictive. Instead, we represent urban functions as a set of POI-based layers, allowing multiple functions to be captured within each spatial unit.
(i) POI Classification Each POI is mapped to a functional category using OSM tags such as amenity, shop, office, tourism, railway, and aeroway. The main categories include education (schools, universities), healthcare (hospitals), transport (train stations, airports), commercial (shops, malls), food and social venues (restaurants), workplaces (offices), and tourism and culture (hotels, museums, attractions).
In addition, we include transport infrastructure layers such as highways, which are not represented as POIs but play a key role in shaping mobility patterns. We identify major high-capacity roads using the standard OSM tags motorway and trunk.
(ii) Spatial Aggregation POIs are spatially joined to the spatial units, and for each unit we compute the number of POIs per category. This results in a set of indicators (e.g., number of hospitals, shops, or restaurants per spatial unit), each representing a functional layer corresponding to a specific POI category.
2.3 Output Structure#
Following this process, each spatial unit is characterized by three components:
(i) a dominant land-use label, capturing its primary physical structure;
(ii) a set of POI-based layers, representing the presence and intensity of activities through POI counts across categories;
(iii) a transport infrastructure indicator (e.g., highway presence), capturing accessibility and connectivity.
Together, these components provide a structured representation of urban space, enabling the analysis of mobility patterns across land-use types, functional activities, and transport infrastructure.
2.4 Visualization and Exploration of Spatial Outputs#
We provide, through interactive maps, the output of this process for the three Areas of Interest (AOIs) considered in our case studies:
Istanbul (case study Urban Activity Dynamics During Republic Day in Istanbul).
Ten cities affected by the 2023 Turkey-Syria earthquakes (case study Urban Activity Dynamics During the 2023 Turkey Earthquake). These include Adana, Adıyaman, Antakya, Diyarbakır, Elazığ, Gaziantep, İskenderun, Kahramanmaraş , Malatya, Şanlıurfa.
Metro Manila (case studies Urban Activity Dynamics During 2023 Heatwaves in Manila and Urban Activity Dynamics During Flooding Events in Manila).
Each AOI is associated with a dedicated interactive map, enabling the visualization and inspection of spatial units (H3 hexagons at resolution 8) and their corresponding attributes.
AOI: Istanbul
AOI: ten cities affected by the earthquake
Adana, Adıyaman, Antakya, Diyarbakır, Elazığ, Gaziantep, İskenderun, Kahramanmaraş , Malatya, Şanlıurfa
AOI: Metro Manila
3. Limitations and Assumptions#
The proposed methodology is subject to several limitations.
OpenStreetMap (OSM) dataset completeness and quality may vary across regions, potentially affecting the accuracy of the classification. In addition, historical snapshots may not perfectly represent the urban configuration at a specific point in time.
The assignment of a single dominant land-use class to each spatial unit may oversimplify mixed-use environments, particularly in dense urban areas.
Land-use labels and functional layers capture different dimensions of urban space and may not always align.
Despite these limitations, the methodology offers a robust and reproducible approach for supporting data-driven urban activity analysis.