Urban Activity Dynamics During Flooding Events in Manila#
In this case study, we apply our methodology to anonymized mobility data from Veraset to assess the impact of an extreme weather event on urban activity patterns in Metro Manila. Specifically, we examine intense rainfall and flooding associated with the southwest monsoon (habagat), significantly enhanced by Typhoon Doksuri (locally known as Egay).
Typhoon Doksuri was one of the strongest tropical cyclones of 2023, causing widespread damage across Southeast and East Asia, particularly in the Philippines. In the country, over 2.9 million people were affected and at least 27 deaths were reported, underscoring its significant human and infrastructural impact (Asian Disaster Reduction Center). Although the typhoon did not directly strike Metro Manila, it played a critical role in intensifying the southwest monsoon, resulting in prolonged heavy rainfall, widespread flooding, and major disruptions to mobility and infrastructure in the capital (ReliefWeb).
News reports highlight the severity of the event and its cascading impacts. Heavy rainfall and flooding led to widespread transport disruptions and power outages (Reuters), while tragic incidents such as a boat capsizing near Manila underscored the risks associated with extreme weather conditions (ABC News). Authorities implemented preventive measures including the suspension of work and classes in Metro Manila (ABS-CBN), and flight cancellations and transport disruptions were reported across multiple days (Philstar).
Understanding how populations move and use urban spaces during extreme weather events is essential for informing disaster response, guiding resilient infrastructure design, and mitigating urban climate risk. In particular, flooding events represent a critical stress test for urban systems, as they directly affect accessibility, mobility patterns, and the spatial distribution of human activity.
We focus on the period between July 23 and July 28, 2023. Using the Urban Space Usage Index, we quantify deviations from typical activity patterns and analyze how different parts of the city respond to the evolving impacts of these conditions.
1. Data#
1.1 Mobility Dataset#
The analysis is based on the Veraset Movement dataset, provided by Veraset as part of the Mobility Data collection from the Development Data Partnership. The dataset consists of anonymized mobile device location pings collected via a network of mobile applications and software development kits (SDKs). Each record includes geographic coordinates, a timestamp, and an anonymized device identifier. These data provide large-scale observations of human mobility, enabling the analysis of spatial and temporal patterns of urban activity.
1.2 Area of Interest (AOI)#
The analysis focuses on the metropolitan area of Manila (Metro Manila), the capital region of the Philippines. The study area is defined using administrative boundaries extracted from OpenStreetMap (OSM) (Figure 1).

Figure 1. Administrative boundary of the metropolitan area of Manila (Metro Manila), used to define the area of interest (AOI). All mobility data are spatially clipped to this region and aggregated using the H3 hierarchical grid system.
We spatially discretized the area of interest using the H3 Uber hierarchical indexing at resolution 8, corresponding to hexagonal cells of approximately 0.737 km². Each H3 cell (or hexagon) represents the spatial unit of the analysis.
1.3 Time window and study periods#
To capture mobility and activity dynamics associated with monsoon-driven rainfall and flooding conditions enhanced by Typhoon Doksuri, we extract data covering the period from July 14 to July 28, 2023, spatially restricted to the study area.
The analysis cannot be extended beyond July 28 due to a data quality issue identified in Exploratory Data Analysis and Quality Assessment - Metro Manila. Starting from July 29, there is a marked decline in both the number of GPS observations per hexagon and the number of active users per hexagon, which may affect the reliability of the results. For this reason, the analysis is limited to data up to July 28 to avoid potential misinterpretation.
We define two analysis periods:
Baseline period: July 14-22
Event period: July 24-28
July 23 is excluded from both periods and treated as a buffer day, to avoid contamination from early behavioral responses to the approaching event. The extracted dataset consists of approximately 218 million GPS points generated by 7.5 million unique users.
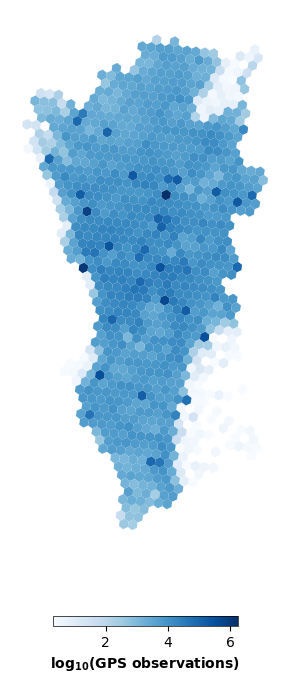
Figure 2. Spatial distribution of GPS observations shown as the average number of records per H3 hexagon (resolution 8). Higher values represent a greater concentration of recorded activity. The color scale is log₁₀-transformed, with darker blue tones indicating areas with more observations.
1.4 Preprocessing and filtering#
To ensure data quality and reduce noise, we apply a set of preprocessing steps. Users with very low daily activity (fewer than eight recorded points per day) are excluded, as they do not provide reliable information on spatial behavior. As shown in Figure 3, increasing the minimum points-per-day threshold progressively removes low-activity users and reduces sharp spikes driven by users with only one or very few daily points, while preserving broadly consistent temporal trends across filtering levels.
In addition, H3 hexagons are retained only if they are consistently active throughout the observation period. Hexes with insufficient activity are removed to avoid unstable estimates and inflated Z-scores.
The final dataset consists of 202,800,033 observations from 4,350,596 users covering 868 spatial units.
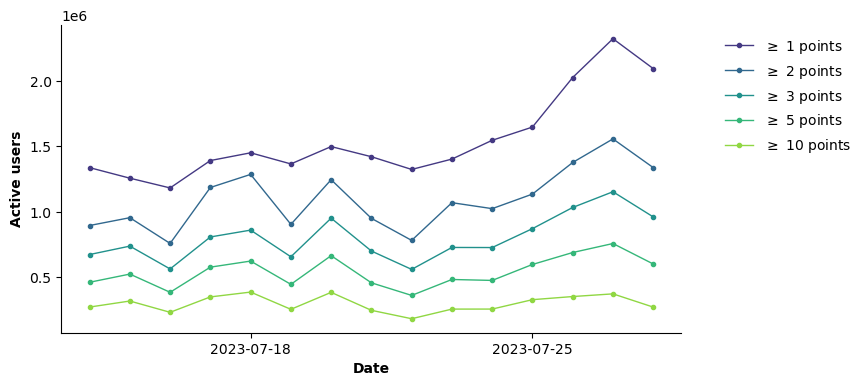
Figure 3. Daily number of active users retained under different minimum points-per-day thresholds (\(\geq\) 1,2,3,5, and 10 points). Increasing the threshold progressively removes low-activity users, reducing sharp spikes driven by users with only one or very few daily points, while preserving temporal trends.
2. Methods#
The analysis follows the methodological framework described in Methodological Framework and applied in the previous case study. In brief, we use the Urban Space Usage Index (\(I\)), defined as the share of unique users visiting each H3 hexagon. The number of unique users is used as a proxy for human presence, under the assumption that higher user counts correspond to greater spatial utilization.
To quantify deviations from typical conditions, we compute Z-scores, which measure how strongly observed activity deviates from baseline levels. Positive values indicate higher activity, while negative values indicate lower activity compared to baseline conditions.
3. Results#
3.1 Temporal evolution of urban activity#
The temporal evolution of the Urban Space Usage Index (\(I\)) shows relatively stable activity levels during the baseline period (July 14-22), with moderate day-to-day variability captured by the interquartile range (Figure 4).
As the event approaches, activity slightly increases during the onset phase (July 24-25), likely reflecting anticipatory behaviors, such as stocking essential goods or short-distance relocation. Starting from July 26, corresponding to the intensification of rainfall and flooding conditions, \(I\) exhibits a marked decline, which continues through July 27-28, indicating a sustained reduction in urban activity. Overall, the temporal pattern reveals a progressive disruption of urban activity, characterized by a brief pre-impact increase followed by a pronounced decrease during the peak flooding phase, when mobility is most constrained.
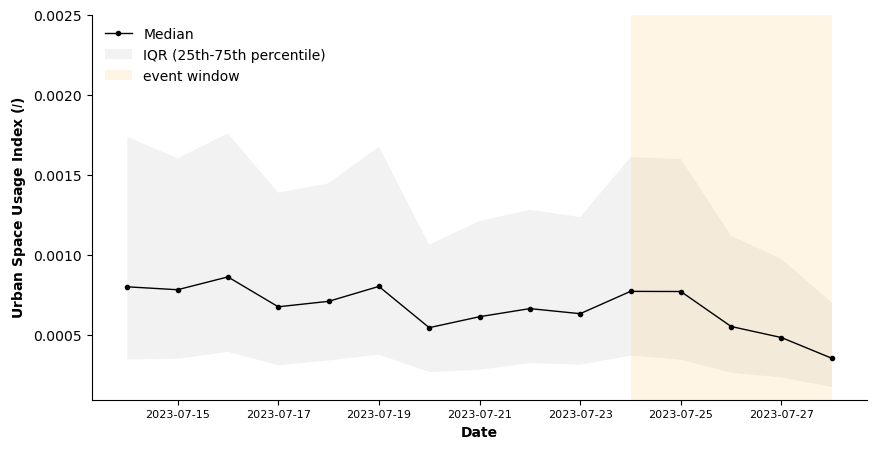
Figure 4. Time series of the median Urban Space Usage Index (\(I\)) across all hexagonal cells in the area of interest, with the shaded area representing the interquartile range. The yellow shaded area highlights the event period associated with monsoon-driven rainfall and flooding conditions.
3.2 Anomaly detection#
Figure 5 presents the temporal evolution of Z-scores, which quantify how many standard deviations observed activity deviates from baseline conditions.
During the baseline period, Z-scores fluctuate around zero, indicating typical levels of activity. However, a negative deviation is observed on July 20. This anomaly likely coincides with an official Thunderstorm Watch issued for the Greater Metro Manila Area, warning of potential severe weather. Such advisories may have triggered precautionary behavioral responses, leading to reduced activity.
As the event approaches (July 24-25), Z-scores become positive (0.58 and 0.43, respectively), indicating a temporary increase in activity relative to baseline levels, consistent with anticipatory behaviors such as stocking or short-distance relocation.
From July 26 onward, corresponding to the intensification of monsoon-driven rainfall and flooding conditions, Z-scores drop to -1.32 on July 26 and -1.91 on July 27, reaching extreme anomaly levels by July 28 (Z = -3.03). This indicates a strong reduction in urban activity, consistent with widespread flooding, infrastructure disruption, and mobility constraints.
Due to data quality issues identified from July 29 onward, the evolution of Z-scores beyond this date cannot be reliably assessed.
Overall, the Z-score dynamics confirm a progressive transition from normal conditions to severe disruption, with an early increase in activity due to precautionary behaviours and a decrease during the most intense phase of the event.
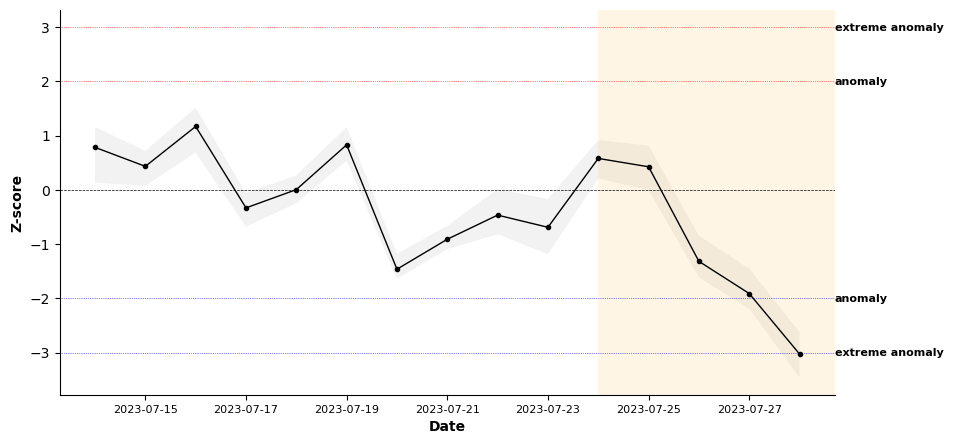
Figure 5. Time series of the average Z-score of the Urban Space Usage Index across hexagons in Metro Manila, with the shaded area representing the interquartile range. Horizontal dashed lines indicate anomaly thresholds. The yellow shaded area highlights the event period associated with monsoon-driven rainfall and flooding conditions.
3.3 Spatial distribution of anomalies#
Figure 6 illustrates the spatial distribution of Z-scores across the study area on July 27, corresponding to the peak flooding phase of the event. The map shows a predominance of negative anomalies, indicating a widespread reduction in urban activity across most spatial units. A limited number of positive anomalies (red hexagons) are scattered across the area of interest. These localized increases in activity may reflect spatial concentration effects, potentially associated with emergency response operations or residential dynamics, where reduced mobility leads to increased presence and device activity in home locations.
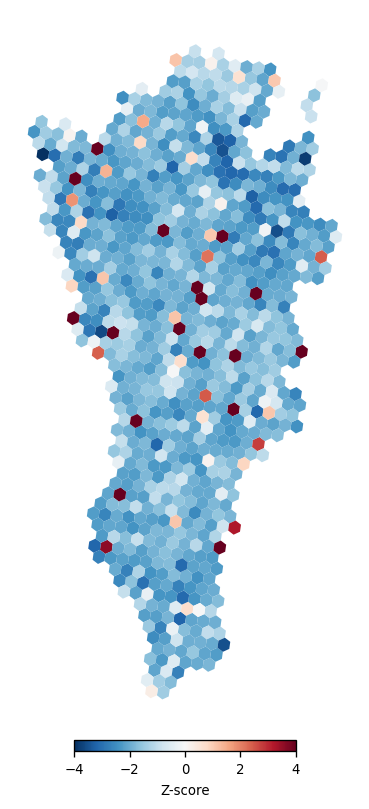
Figure 6. Map of the Z-score of the Urban Space Usage Index across H3 hexagonal cells in Metro Manila on July 27, 2023. Warmer colors indicate higher-than-expected activity, while cooler colors indicate negative anomalies, showing a widespread reduction in activity during peak flooding conditions across the metropolitan area.
The interactive map (Figure 7) allows users to explore the full time series of Z-scores across the study area. This tool enables the examination of temporal dynamics at different locations, providing a more detailed and intuitive understanding of how activity patterns evolve over time.
Figure 7. Interactive map of the Z-score of the Urban Space Usage Index across H3 hexagonal cells in the area of interest. The animation shows the day-by-day evolution of activity levels, with colors indicating relative intensity.
3.4 Spatial and Functional Characterization of Activity#
To interpret the spatial distribution of activity, each hexagonal cell is associated with both land use and functional activity. For land use, we assign each hexagon a dominant category (e.g., residential, commercial, industrial, green areas), capturing the physical organization of urban space. In contrast, the functional layer is derived from POIs: for each hexagon, we count the number of POIs in different activity categories (e.g., schools, hospitals, parks, transport hubs, commercial venues). For more details on the land use and functional activity methodology, refer to Spatial Characterization of Urban Units.
Land-use and POI data are derived from OpenStreetMap (OSM) and accessed via Geofabrik extracts (https://download.geofabrik.de/asia/philippines.html). To ensure temporal consistency with the mobility data, which refer to 2023, we use OSM snapshots from January 2023. © OpenStreetMap contributors, licensed under the Open Database License (ODbL).
Land Use Analysis#
To better understand how the impact of the event varies across the urban environment, we analyze activity patterns by dominant land-use category. Overall, the results indicate a progressive and widespread decline in activity across all land-use types, consistent with the system-wide disruption observed in the aggregate indicators: the Urban Space Usage Index (Figure 4) and the associated Z-scores (Figure 5). However, the magnitude and timing of this decline vary across categories (see Figure 8).
During July 24-25 (the onset phase), all categories exhibit positive Z-scores, indicating a temporary increase in activity. This effect is stronger in green areas (Z = 1.06 on July 24) and in commercial and construction areas (Z = 0.6-0.7), suggesting increased mobility associated with anticipatory behaviors. In contrast, farmland and water-related areas show only minimal deviations. From July 26 onward, corresponding to the intensification of monsoon-driven rainfall and flooding conditions, all land-use categories display negative Z-scores, indicating a significant reduction in activity. The decline becomes more pronounced over time, reaching extreme anomaly levels by July 28 in several categories. The strongest reductions are observed in construction (Z = -3.28), green areas (Z = -2.73), and farmland (Z = -2.61), likely reflecting both reduced accessibility and higher exposure to flooding.
Z-score (agg) |
Z-score (07-24) |
Z-score (07-25) |
Z-score (07-26) |
Z-score (07-27) |
Z-score (07-28) |
|
|---|---|---|---|---|---|---|
commercial |
-0.57 |
0.67 |
0.72 |
-0.85 |
-1.23 |
-2.17 |
construction |
-0.96 |
0.73 |
0.61 |
-0.96 |
-1.89 |
-3.28 |
farmland |
-1.06 |
0.05 |
0.10 |
-1.15 |
-1.68 |
-2.61 |
green |
-0.65 |
1.06 |
0.88 |
-0.86 |
-1.61 |
-2.73 |
industrial |
-0.77 |
0.50 |
0.42 |
-0.94 |
-1.35 |
-2.51 |
residential |
-0.07 |
0.65 |
0.39 |
-0.49 |
0.08 |
-1.00 |
water |
-0.94 |
0.45 |
0.10 |
-1.19 |
-1.55 |
-2.52 |
Figure 8. Time series of the average Z-score of the Urban Space Usage Index for different land-use classes, with horizontal dashed lines indicating anomaly thresholds.
Functional (POI-Based) Analysis#
We then examine activity across functional layers derived from points of interest (POIs), capturing how different types of urban services and destinations are affected by monsoon-driven flooding conditions. Overall, the results reveal a short increase in activity during the onset phase, followed by a sharp decline during peak impact. The magnitude of these changes varies across functional categories (see Figure 9).
During the onset phase (July 24-25), all categories exhibit positive Z-scores, indicating increased activity relative to baseline levels. The strongest increases are observed in airports (Z = 1.54), parks (Z = 0.96), and train stations (Z = 0.81), likely associated with anticipatory behaviors, such as travel adjustments, relocation, or temporary displacement.
From July 26 onward, corresponding to the intensification of flooding and mobility constraints, all categories exhibit a reduction in activity, as reflected by negative Z-scores. The decline intensifies over time, reaching extreme anomaly levels by July 28 in several categories. The most affected functions include airports (Z = -3.35), schools (Z = -2.87), highways (Z = -2.85), and train stations (Z = -2.79), indicating disruption to road networks and public services. These patterns are consistent with reported disruptions during the same period, including widespread flight cancellations (July 24-26) and continued service interruptions in the following days. In addition, authorities announced the suspension of work and schools in Metro Manila (official advisory), further confirming the scale of disruption. These external signals align closely with the observed decline in activity, supporting the interpretation that flooding led to widespread reductions in mobility and accessibility.
Z-score (agg) |
Z-score (07-24) |
Z-score (07-25) |
Z-score (07-26) |
Z-score (07-27) |
Z-score (07-28) |
|
|---|---|---|---|---|---|---|
highways |
-0.97 |
0.61 |
0.57 |
-1.30 |
-1.88 |
-2.85 |
airports |
-0.68 |
1.54 |
1.41 |
-1.06 |
-1.92 |
-3.35 |
hospitals |
-0.15 |
0.76 |
0.45 |
-0.72 |
-0.25 |
-0.97 |
malls |
-0.86 |
0.68 |
0.54 |
-1.19 |
-1.61 |
-2.74 |
offices |
0 |
0.66 |
0.50 |
-0.44 |
0.17 |
-0.88 |
restaurants |
-0.82 |
0.68 |
0.48 |
-1.10 |
-1.54 |
-2.61 |
schools |
-0.94 |
0.65 |
0.39 |
-1.16 |
-1.69 |
-2.87 |
shops |
-0.28 |
0.65 |
0.43 |
-0.67 |
-0.37 |
-1.44 |
tourism |
-0.86 |
0.68 |
0.54 |
-1.10 |
-1.66 |
-2.76 |
train_stations |
-0.81 |
0.81 |
0.76 |
-1.18 |
-1.67 |
-2.79 |
universities |
-0.44 |
0.77 |
0.78 |
-0.69 |
-1.07 |
-1.97 |
parks |
-0.61 |
0.96 |
0.86 |
-0.79 |
-1.63 |
-2.47 |
Figure 9. Time series of the average Z-score of the Urban Space Usage Index for different functional layers, with horizontal dashed lines indicating anomaly thresholds.
4. Conclusions and Key Findings#
This analysis quantifies the impact of monsoon-driven flooding, amplified by Typhoon Doksuri, on urban activity patterns in Metro Manila using anonymized mobility data and the Urban Space Usage Index.
The main findings are:
1. Activity levels initially increase during the onset phase, reflecting anticipatory behaviors such as stocking, relocation, and travel adjustments. This is followed by a sharp and sustained decline as rainfall intensifies and flooding conditions emerge.
2. Flooding generates a strong system-wide disruption of urban activity, leading to extreme negative anomalies.
3. The impact is heterogeneous across land-use and functional categories, with transport infrastructure, construction areas, and exposed land uses (e.g., green and agricultural areas) which exhibit the strongest reductions.
Overall, these results demonstrate that the proposed framework and the Urban Space Usage Index are effective in detecting and characterizing the impact of flooding events.
Policy relevance#
This analysis can support flood preparedness and urban resilience planning by showing how activity changes before and during severe rainfall and flooding conditions. For the Manila flooding events amplified by Typhoon Doksuri, the results indicate an initial increase in activity during the onset phase, followed by a sharp and sustained decline as flooding intensified. Since the strongest reductions are observed in transport infrastructure, construction areas, exposed land uses, and several public-service locations, these results can inform early evacuation planning, warning strategies, transport and road management, and the allocation of response resources during severe flooding events.
Limitations#
This analysis is subject to some limitations. Mobility data may not fully represent the entire population, as it depends on smartphone usage and data coverage. In addition, spatial aggregation into H3 cells may smooth local variations.
A further limitation relates to data quality over time. Starting from July 29, a marked decline is observed in both the number of GPS observations and the number of active users, which may affect the reliability of the results. For this reason, the analysis is restricted to the period up to July 28, and the evolution of urban activity beyond this date cannot be reliably assessed.