Urban Activity Dynamics During the 2023 Turkey Earthquake#
In this case study, we apply our methodology to anonymized mobility data from Veraset to assess the impact of a major natural disaster on urban activity and mobility patterns. Understanding how populations use and move through urban areas during such shocks provides valuable insights for disaster response, infrastructure resilience, and emergency preparedness.
We focus on the 2023 Turkey-Syria earthquakes. On 6 February 2023, a sequence of high-magnitude seismic events caused widespread damage and disruption across the region. The first earthquake (Mw 7.8) struck southern Turkey in the early morning, followed by a second major event (Mw 7.5) later the same day. Due to data availability, the analysis focuses on the affected regions within Turkey.
Using the Urban Space Usage Index, we quantify deviations from typical activity patterns and examine how patterns of human presence are redistributed in response to a large-scale and unexpected shock.
1. Data#
1.1 Mobility Dataset#
The analysis is based on the Veraset Movement dataset, provided by Veraset as part of the Mobility Data collection from the Development Data Partnership. The dataset consists of anonymized mobile device location pings collected via a network of mobile applications and software development kits (SDKs). Each record includes geographic coordinates, a timestamp, and an anonymized device identifier. These data provide large-scale observations of human mobility, enabling the analysis of spatial and temporal patterns of urban activity.
1.2 Area of Interest (AOI)#
The analysis focuses on the 11 regions most affected by the earthquake, as identified in the official emergency report (ReliefWeb, 2023): Kahramanmaraş, Adıyaman, Kilis, Osmaniye, Gaziantep, Malatya, Şanlıurfa, Diyarbakır, Adana, Hatay, and Elazığ.
Figure 1 shows the study area, defined as the union of these regions using administrative boundary shapefiles from the Humanitarian Data Exchange (HDX). We spatially discretized the area of interest using the H3 Uber hierarchical indexing at resolution 8, corresponding to hexagonal cells of approximately 0.737 km². Each H3 cell (or hexagon) represents the spatial unit of the analysis.
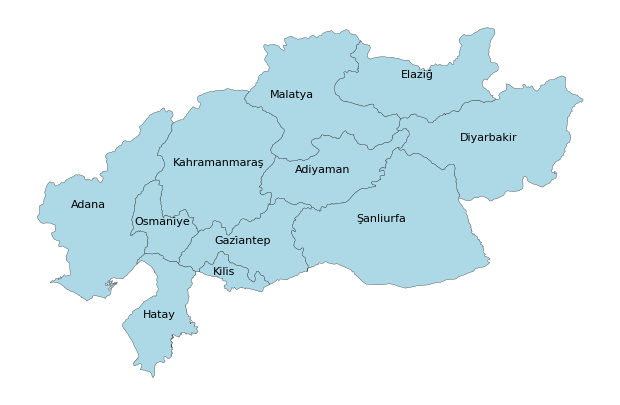
Figure 1. Administrative boundaries of the 11 regions most affected by the 2023 Turkey-Syria earthquakes, used to define the area of interest (AOI). All mobility data are spatially clipped to this region and aggregated using the H3 hierarchical grid system.
1.3 Time window and study periods#
To capture mobility dynamics before, during, and after the earthquake (which occurred on 6 February 2023), we extract data for the period 2 January to 30 March 2023, spatially clipped to the study area. We define three analysis periods:
Baseline period: 2 January - 5 February
Event period: 6 February
Post-event period: 7 February - 10 March
The extracted dataset consists of approximately 13.8 million GPS points generated by 1.7 million unique users.
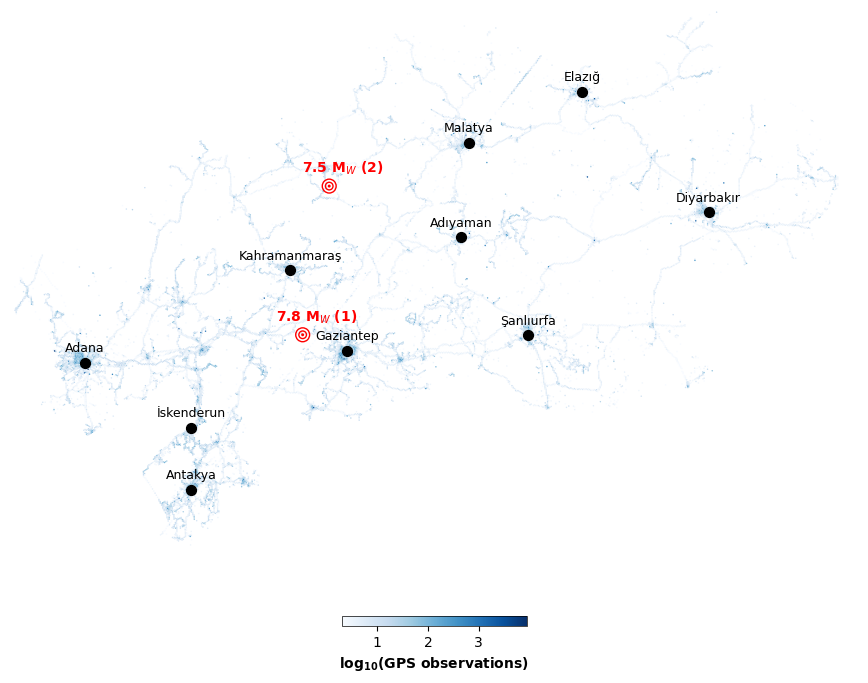
Figure 2. Spatial distribution of GPS observations, shown as the average number of records per H3 hexagon (resolution 8). Higher values represent a greater concentration of recorded activity. The color scale is log₁₀-transformed, with darker blue tones indicating areas with more observations. The locations of the two earthquake epicenters are highlighted with red concentric circles.
1.4 Preprocessing and filtering#
To ensure data quality and reduce noise, we apply a set of preprocessing steps. Users with very low daily activity (fewer than two recorded points per day) are excluded, as they do not provide reliable information on spatial behavior. As shown in Figure 3, increasing the minimum points-per-day threshold progressively removes low-activity users and reduces sharp spikes driven by users with only one or very few daily points, while preserving broadly consistent temporal trends across filtering levels.
In addition, H3 hexagons are retained only if they are consistently active throughout the observation period. Hexagons with insufficient activity are removed to avoid unstable estimates and inflated Z-scores. The final dataset consists of approximately 11 millions observations from 1,191,076 users covering 1,525 spatial units.
As observed in the data (and discussed in Exploratory Data Analysis and Quality Assessment - Turkey), mobility observations are spatially concentrated in major urban centers and along primary transportation corridors. For this reason, subsequent analyses (in particular those related to land use and functional characterization) will focus on these areas.
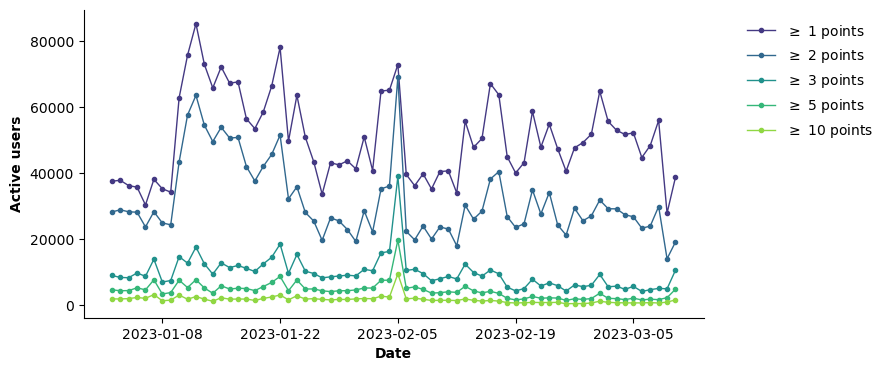
Figure 3. Daily number of active users retained under different minimum points-per-day thresholds (\(\geq\) 1,2,3,5, and 10 points). Increasing the threshold progressively removes low-activity users, reducing sharp spikes driven by users with only one or very few daily points, while preserving temporal trends.
2. Methods#
The analysis follows the methodological framework described in Methodological Framework and applied in the previous case study. In brief, we use the Urban Space Usage Index (\(I\)), defined as the share of unique users visiting each H3 hexagon. The number of unique users is used as a proxy for human presence, under the assumption that higher user counts correspond to greater spatial utilization.
To quantify deviations from typical conditions, we compute Z-scores, which measure how strongly observed activity deviates from baseline levels. Positive values indicate higher activity, while negative values indicate lower activity compared to baseline conditions.
3. Results#
3.1 Temporal evolution of urban activity#
The temporal evolution of the Urban Space Usage Index reveals a clear increase in activity on the day of the earthquake (6 February 2023) and in the following days (Figure 4).
Activity levels increase during the event and remain elevated in the following days before gradually returning toward baseline conditions. This pattern is consistent with the dynamics of an unexpected natural disaster, where increased activity is indicative of coordinated response and displacement.
Overall, the time series highlights a clear shift in urban activity during the event period compared to typical conditions, demonstrating the ability of the index to capture large-scale behavioral responses to sudden shocks.
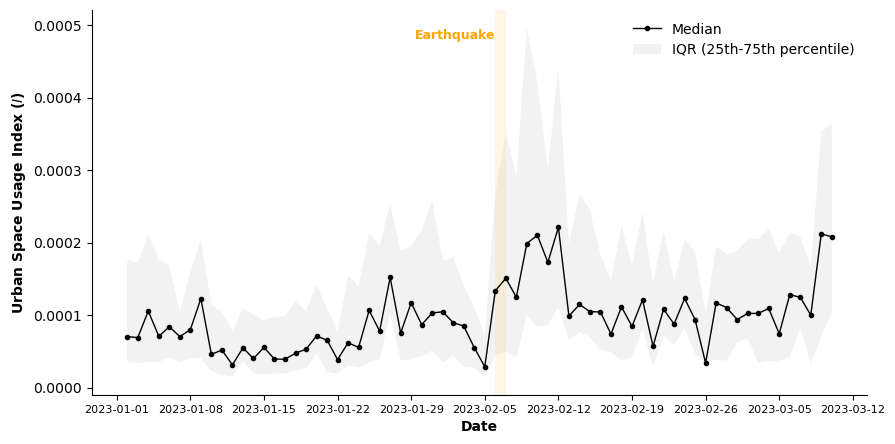
Figure 4. Time series of the median Urban Space Usage Index (I) across all hexagonal cells in the area of interest, with the shaded area representing the interquartile range. The highlighted band marks the earthquake (6 February 2023), after which a clear increase in observed activity is observed.
3.2 Anomaly detection#
To assess whether observed changes correspond to statistically significant deviations from typical conditions, we use the Z-score, which measures how many standard deviations observed activity deviates from its baseline.
As shown in Figure 5, during the baseline period, Z-scores fluctuate around zero, indicating stable and expected conditions. On 6 February, the median Z-score exhibits a sharp increase (from -0.75 on 5 February to 1.36 on 6 February), marking the start of an extreme positive anomaly due to increased activity relative to normal conditions.
In the days following the earthquake, Z-scores continue to rise, reaching a median value close to 4 on 9 February, three days after the event. This lagged response is consistent with the progressive mobilization of emergency services, delayed evacuations, and ongoing humanitarian activities.
From approximately 13 February onward, Z-scores gradually decrease, approaching a new steady state that remains slightly above baseline levels, likely reflecting continued recovery operations, debris removal, and reconstruction activities.
The sharp increase in Z-scores coinciding with the earthquake strongly suggests that the observed disruptions in mobility are directly associated with the event.
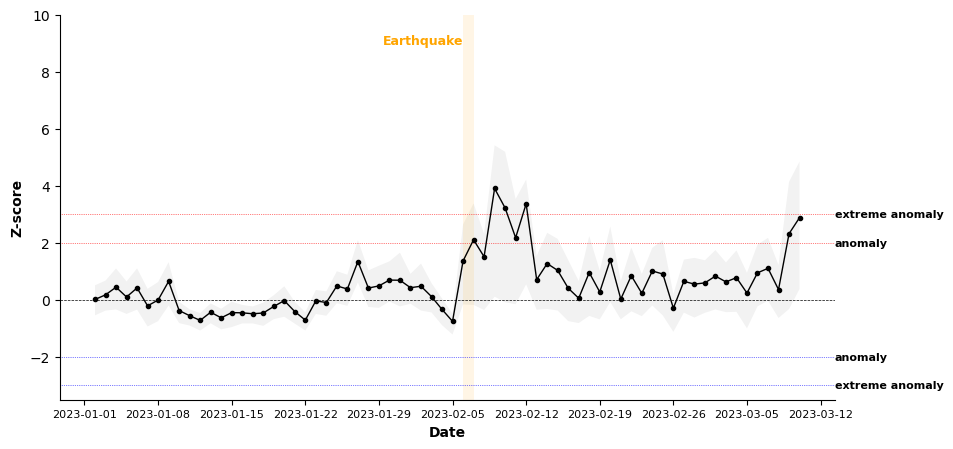
Figure 5. Time series of the average Z-score of the Urban Space Usage Index across hexagons in the area of interest, with the shaded area representing the interquartile range. Horizontal dashed lines indicate anomaly thresholds. The highlighted band marks the earthquake (6 February 2023).
3.3 Spatial distribution of anomalies#
The spatial distribution of Z-scores on 6 February (Figure 6) reveals how the earthquake affects different parts of the region. As expected from the dataset characteristics, spatial coverage is sparse and concentrated in approximately 10 major urban centers, as well as along key transportation corridors.
Urban areas exhibit positive anomalies, reflecting the concentration of emergency response efforts, humanitarian assistance, and population movements. Similarly, major road networks show high levels of observed mobility, likely associated with evacuations, the movement of rescue teams, and the delivery of aid.
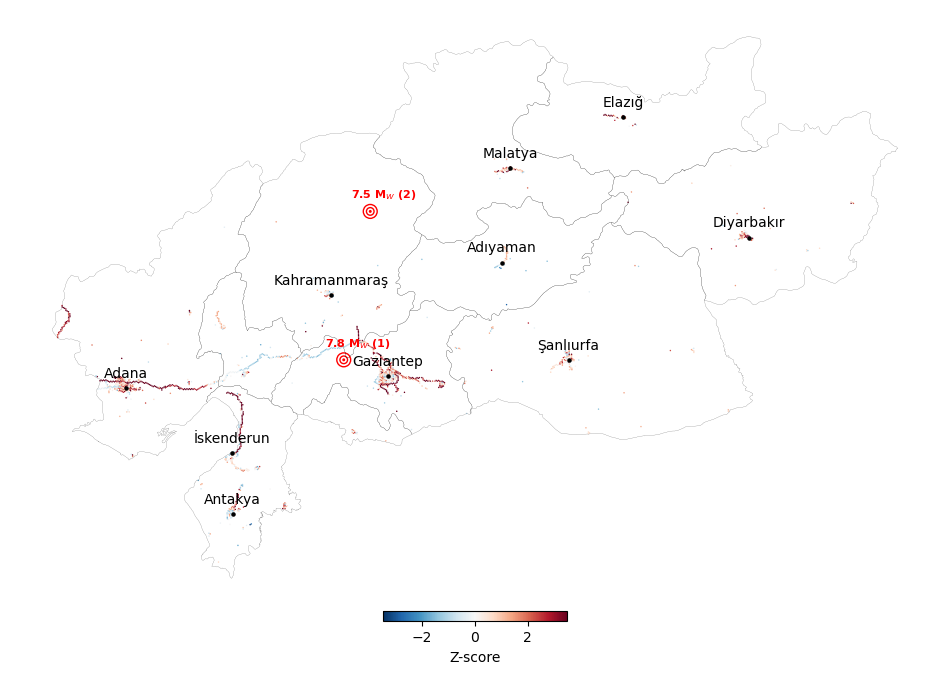
Figure 6. Map of the Z-score of the Urban Space Usage Index across H3 hexagonal cells in the area of interest on 6 February 2023. Warmer colors indicate higher-than-expected activity, highlighting spatial heterogeneity with stronger anomalies concentrated in urban areas and along major transportation corridors.
At the regional (province) level, the intensity of anomalies varies substantially. Hatay (Z = 4.25) and Adana (Z = 3.63) exhibit the strongest increases, indicating particularly intense mobility responses. Osmaniye (Z = 1.83), Kahramanmaraş (Z = 1.52), and Elazığ (Z = 1.33) also show notable positive anomalies, while regions such as Gaziantep, Kilis, and Diyarbakır display more moderate increases. By contrast, Adıyaman exhibits a negative anomaly (Z = -0.88), suggesting reduced observed activity. This may reflect severe local disruption, limited mobility, or data sparsity in the immediate aftermath of the earthquake. Figure 7 shows an interactive plot of the time series of Z-score for each region.
Hatay |
Adana |
Osmani̇ye |
Kahramanmaraş |
Elaziğ |
Ki̇li̇s |
Gazi̇antep |
Di̇yarbakir |
Malatya |
Şanliurfa |
Adiyaman |
|
|---|---|---|---|---|---|---|---|---|---|---|---|
Z-score |
4.25 |
3.63 |
1.83 |
1.52 |
1.33 |
1.23 |
1.21 |
0.91 |
0.89 |
0.79 |
-0.88 |
Notably, Hatay, the province with the highest Z-score, also records the highest number of deaths and injuries. However, the relationship between mobility anomalies and casualty severity is not systematic: Adıyaman and Adana represent opposite exceptions. This suggests that Z-scores capture not only direct damage, but also post-earthquake mobility dynamics, such as displacement, accessibility, and the use of Adana as a road corridor or support area.
Province |
Deaths* |
Injuries* |
|---|---|---|
Hatay |
24,147 |
30,762 |
Kahramanmaraş |
12,713 |
9,243 |
Adıyaman |
8,387 |
17,499 |
Gaziantep |
3,904 |
13,325 |
Malatya |
1,393 |
6,444 |
Osmaniye |
1,010 |
2,606 |
Adana |
454 |
7,450 |
Diyarbakır |
414 |
902 |
Şanlıurfa |
340 |
8,919 |
*Data from Wikipedia: 2023 Turkey-Syria earthquakes
Figure 7. Time series of the Z-score of the Urban Space Usage Index for each region in the area of interest. The highlighted band marks the earthquake (6 February 2023).
The interactive map in Figure 8 allows exploration of the full time series of Z-scores. Deviations from baseline conditions remain close to zero during the baseline period, increase sharply on the event day, and remain elevated for several days before gradually declining toward baseline levels.
Figure 8. Interactive map of the Z-score of the Urban Space Usage Index across H3 hexagonal cells in the area of interest. The animation shows the day-by-day evolution of activity levels, with colors indicating relative intensity. The play control allows exploration of temporal dynamics before, during, and after the earthquake.
3.4 Spatial and Functional Characterization of Activity#
To interpret the spatial distribution of activity, each hexagonal cell is associated with both land use and functional activity. For land use, we assign each hexagon a dominant category (e.g., residential, commercial, industrial, green areas), capturing the physical organization of urban space. In contrast, the functional layer is derived from POIs: for each hexagon, we count the number of POIs in different activity categories (e.g., schools, hospitals, parks, transport hubs, commercial venues). For more details on the land use and functional activity methodology, refer to Spatial Characterization of Urban Units.
Given that observations are concentrated in a limited number of urban areas, the analysis focuses on the 10 major cities identified in the dataset, both individually and in aggregate. The 10 selected cities are: Adana, Adiyaman, Antakya, Diyarbakir, Elazig, Gaziantep, Iskenderun, Kahramanmaras, Malatya, Sanliurfa.
Land-use and POI data are derived from OpenStreetMap (OSM) and accessed via Geofabrik extracts (https://download.geofabrik.de/europe/turkey.html). To ensure temporal consistency with the mobility data, which refer to 2023, we use OSM snapshots from January 2023. © OpenStreetMap contributors, licensed under the Open Database License (ODbL).
Land Use Analysis#
Aggregate Analysis.
We analyze how different types of urban space responded to the earthquake and its immediate aftermath (6-8 February) by examining activity patterns aggregated across the 10 selected cities (see Figure 9). All land-use categories exhibit positive anomalies, indicating a generalized increase in activity across the area of interest. However, the magnitude of these increases varies across land-use types.
The strongest deviations are observed in industrial (Z = 1.28) and farmland areas (Z = 1.21). The increase in industrial zones is consistent with intensified logistics, supply distribution, and emergency operations. Similarly, the strong anomaly in farmland areas suggests a shift of activity toward peri-urban and rural environments, possibly reflecting displacement dynamics or the use of less dense areas during the response phase.
Commercial areas also show a positive anomaly (Z = 0.94), indicating increased activity near economic and service hubs. However, given the disruption caused by the earthquake, this increase likely reflects pass-through movement or temporary congregation rather than normal commercial activity. Residential areas exhibit an increase (Z = 0.85), suggesting that activity within urban neighborhoods rises but less sharply than in more dynamic or transitional spaces. In contrast, green areas show a weak deviation from baseline conditions (Z = 0.22), indicating that open spaces do not exhibit a strong response. As shown in the next sub-section, these values vary substantially across cities.
Overall, the results indicate an increase in activity, with a shift toward logistical and peri-urban spaces.
Z-score (event) |
I (event) |
I (baseline) |
|
|---|---|---|---|
residential |
0.85 |
0.00020 |
0.00012 |
green |
0.22 |
0.00013 |
0.00010 |
commercial |
0.94 |
0.00018 |
0.00009 |
farmland |
1.21 |
0.00018 |
0.00006 |
industrial |
1.28 |
0.00010 |
0.00005 |
Figure 9. Time series of the average Z-score of the Urban Space Usage Index for different land-use classes, with horizontal dashed lines indicating anomaly thresholds. The highlighted band marks the earthquake period.
City-Level Analysis.
Land-use patterns at the city level reveal substantial heterogeneity across locations (see Figure 10). Industrial and commercial areas are associated with the strongest anomalies. For instance, İskenderun shows a strong increase in industrial activity (Z = 6.20), while Kahramanmaraş in commercial areas (Z = 10.25). Residential areas also display strong increases in several cities, particularly in İskenderun (Z = 4.63) and Adana (Z = 2.03), reflecting population concentration or displacement. In contrast, Adıyaman shows a negative anomaly in residential areas (Z = -0.58), likely reflecting severe disruption or reduced data coverage in the most affected locations. Farmland areas exhibit heterogeneous patterns. While several cities show strong positive anomalies, such as Antakya (Z = 3.38) and Adana (Z = 2.03), others, such İskenderun, display negative values (Z = -1.09).
Green areas also vary substantially across cities. Some locations show notable increases, such as Kahramanmaraş (Z = 3.68) and İskenderun (Z = 1.98), while others exhibit weak or negative anomalies (e.g., Adıyaman, Z = -1.30). This variability explains the relatively weak aggregate signal observed for green spaces.
Overall, the city-level analysis shows that responses across land-use types are highly city-dependent, with extreme effects concentrated in specific locations and categories.
city |
Adana |
Adıyaman |
Antakya |
Diyarbakır |
Elazığ |
Gaziantep |
İskenderun |
Kahramanmaraş |
Malatya |
Şanlıurfa |
|---|---|---|---|---|---|---|---|---|---|---|
commercial |
1.12 |
- |
0.34 |
1.22 |
- |
- |
- |
10.25 |
- |
- |
farmland |
2.03 |
- |
3.38 |
1.70 |
- |
1.56 |
-1.09 |
- |
1.10 |
1.94 |
green |
-0.06 |
-1.30 |
-0.34 |
0.90 |
- |
1.17 |
1.98 |
3.68 |
0.44 |
1.32 |
industrial |
1.18 |
- |
1.02 |
3.28 |
1.63 |
1.00 |
6.20 |
- |
- |
1.60 |
residential |
2.03 |
-0.58 |
0.22 |
0.68 |
0.42 |
1.00 |
4.63 |
1.42 |
0.86 |
0.30 |
Figure 10. City-by-city time series of the average Z-score of the Urban Space Usage Index for different land-use classes, shown in separate tabs. Horizontal dashed lines indicate anomaly thresholds, while the highlighted band marks the earthquake period.
Functional (POI-Based) Analysis#
We then examine activity across functional layers derived from POIs.
Aggregate Analysis.
We analyze activity anomalies across functional layers by aggregating results across the 10 selected cities (see Figure 11).
The strongest anomalies are observed in transport infrastructure and commercial hubs, particularly highways (Z = 2.52), malls (Z = 3.02), and airports (Z = 1.70). This indicates increased movement along key transport corridors and around central locations, likely driven by evacuations, emergency response operations, and the distribution of aid.
Several service and commercial functions show clear positive anomalies, including train stations (Z = 1.39), schools (Z = 1.46), shops (Z = 1.09), offices (Z = 1.07), and restaurants (Z = 1.08). With the exception of transport-related infrastructure, many of these activities were likely disrupted during the earthquake; therefore, the observed increases are unlikely to reflect normal usage, but rather pass-through movement or temporary congregation near accessible and central locations. Notably, the increased activity for schools may reflect their use as temporary shelters during the emergency response.
Hospitals (Z = 0.91) and parks (Z = 0.97) also show positive anomalies, though less pronounced. Increased activity near hospitals is consistent with emergency healthcare demand, while activity near parks may reflect localized use of open spaces. However, these effects appear less consistent across cities.
In contrast, tourism locations (Z = 0.79) and universities (Z = 0.13) show limited or negligible deviations from baseline conditions, suggesting a marginal role during the response phase.
Z-score (event) |
I (event) |
I (baseline) |
|
|---|---|---|---|
parks |
0.89 |
0.00386 |
0.00293 |
malls |
1.05 |
0.00284 |
0.00264 |
offices |
1.33 |
0.00219 |
0.00189 |
tourism |
0.96 |
0.00180 |
0.00169 |
restaurants |
1.35 |
0.00150 |
0.00125 |
train stations |
1.28 |
0.00162 |
0.00101 |
shops |
1.19 |
0.00113 |
0.00097 |
schools |
1.10 |
0.00114 |
0.00084 |
hospitals |
1.13 |
0.00086 |
0.00061 |
highways |
2.37 |
0.00047 |
0.00039 |
universities |
1.36 |
0.00026 |
0.00016 |
airports |
3.12 |
0.00035 |
0.00014 |
Figure 11. Time series of the average Z-score of the Urban Space Usage Index for different functional layers, with horizontal dashed lines indicating anomaly thresholds. The highlighted band marks the earthquake period.
City-Level Analysis.
We further examine POI-based activity at the city level to capture local variation in functional responses to the earthquake (see Figure 12).
The results show heterogeneity across cities. Adana exhibits the strongest and most consistent increase in activity across multiple functional layers, while Adıyaman shows the weakest signal, with several weak or negative anomalies, likely reflecting severe disruption or limited data coverage.
The strongest increases are observed in transport infrastructure, particularly highways. Very high anomalies are recorded in İskenderun (Z = 6.31), Kahramanmaraş (Z = 3.98), Adana (Z = 3.72), and Antakya (Z = 3.19), highlighting the role of road networks and highways in evacuation and emergency response.
Service and commercial functions show positive anomalies across cities, including shops, offices, and restaurants. These increases likely reflect pass-through movement or temporary congregation rather than normal activity.
Schools show consistent positive values in multiple cities, such as Adana (Z = 2.29) and Diyarbakır (Z = 1.39), highlighting their possible use as temporary shelters or coordination points during the emergency.
Other POI-layers show more variability. For example, hospitals and parks exhibit mixed patterns across cities, while some extreme localized anomalies emerge, such as tourism-related locations in Diyarbakır (Z = 8.08).
While activity increases across the area of interest, its functional distribution is strongly city-dependent.
city |
Adana |
Adıyaman |
Antakya |
Diyarbakır |
Elazığ |
Gaziantep |
İskenderun |
Kahramanmaraş |
Malatya |
Şanlıurfa |
|---|---|---|---|---|---|---|---|---|---|---|
highways |
3.72 |
-0.05 |
3.19 |
1.06 |
1.55 |
1.18 |
6.31 |
3.98 |
1.07 |
0.86 |
airports |
3.12 |
- |
- |
- |
- |
- |
- |
- |
- |
0.28 |
hospitals |
1.77 |
-1.02 |
0.34 |
- |
- |
-0.21 |
- |
0.83 |
1.02 |
- |
malls |
3.57 |
- |
- |
- |
- |
- |
- |
- |
- |
0.80 |
offices |
1.85 |
-0.31 |
0.41 |
1.83 |
1.84 |
0.33 |
-0.35 |
1.77 |
1.06 |
0.19 |
restaurants |
2.02 |
-0.08 |
0.00 |
1.09 |
-0.26 |
0.82 |
1.62 |
0.82 |
0.06 |
0.07 |
schools |
2.29 |
-0.12 |
0.20 |
1.39 |
- |
0.76 |
1.09 |
1.20 |
0.39 |
1.38 |
shops |
1.55 |
-0.07 |
0.69 |
0.97 |
0.59 |
0.92 |
1.42 |
1.18 |
0.96 |
0.44 |
tourism |
1.10 |
-0.62 |
0.18 |
8.08 |
1.16 |
0.43 |
0.05 |
0.94 |
0.13 |
0.60 |
train stations |
1.77 |
- |
- |
1.65 |
0.44 |
1.00 |
1.90 |
- |
0.93 |
- |
universities |
0.85 |
- |
- |
- |
- |
-0.20 |
- |
-0.27 |
- |
- |
parks |
2.27 |
- |
-1.24 |
0.98 |
-0.60 |
0.72 |
-1.01 |
0.16 |
0.88 |
-0.03 |
Figure 12. City-by-city time series of the average Z-score of the Urban Space Usage Index for different functional layer, shown in separate tabs. Horizontal dashed lines indicate anomaly thresholds, while the highlighted band marks the earthquake period.
4. Conclusions and Key Findings#
This analysis quantifies the impact of the 2023 Turkey-Syria earthquakes on urban activity patterns using anonymized mobility data and the Urban Space Usage Index.
The main findings are:
1. Observed activity increases on the day of the earthquake and peaks in the following days, reflecting a delayed response. This pattern is consistent with emergency response dynamics, including the mobilization of rescue operations, evacuations, and humanitarian assistance.
2. Z-scores reveal a statistically significant increase in activity during the event, with values reaching extreme anomaly levels relative to baseline conditions.
3. The spatial and functional distribution of activity is heterogeneous, with stronger anomalies in urban areas and transport infrastructure.
Overall, these results show that the proposed framework can effectively detect, quantify, and spatially characterize mobility responses to large-scale shocks, providing actionable insights for disaster response and urban resilience planning.
Policy relevance#
This analysis can support disaster response and urban resilience planning by showing how activity changes during and after a major shock. For the 2023 Turkey-Syria earthquakes, the results indicate a sharp increase in observed activity on the event day, followed by a delayed peak over the following days, consistent with evacuations, rescue operations, and humanitarian response. Since anomalies are concentrated in urban areas, transport corridors, and key service locations, these results can inform emergency logistics, transport and road management, shelter planning, healthcare access, and the allocation of response resources during the immediate aftermath of large-scale disasters.
Limitations#
This analysis is subject to some limitations. Mobility data may not fully represent the entire population, as it depends on smartphone usage and data coverage. In addition, spatial aggregation into H3 cells may smooth local variations. In disaster contexts, mobility data may be further biased by infrastructure disruptions (e.g., network outages or power loss), which can reduce observed activity in the most severely affected areas.