Software Setup
Minimum requirements for this course
- Stata 19+ MP installed and licensed
- Positron (latest version)
- R (4.5.3+)
- Python (3.13+)
uvenvironment manager for Python- Quarto (1.9+)
- Git (2.52+)
Note: This software stack powers the AI-assisted coding workflow used throughout the course and beyond.
Step 1: Install software from the Software Center
- Restart your computer to ensure pending updates are applied.
- Open Software Center and install the items in Table 1 in order.
- If any program does not appear in the Software Center, submit a Software Installation Request or contact ITHelp@worldbankgroup.org.
If you have previously installed any of the software manually (or using an admin password), contact ITHelp@worldbankgroup.org to remove it first, then install from the Software Center.
If you have Python already installed for some times, install new python from the software center (AWBG10201.4) because it has broader permissions. Then set the Python path, so that any program sees your new python as the main one. You can set the path by running command
python set exec "C:\WBG\Python313\python.exe", permanentlyand restart the positron.

Download and install each tool from the links in Table 1.
| Software | WB Laptop (Software Center) | Private Laptop |
|---|---|---|
| Stata (19+ MP) |  |
|
| Positron (latest) |  |
positron.posit.co |
| Quarto (1.9+) |  |
quarto.org |
| R (4.5.3+) |  |
cran.r-project.org |
| Python (3.13+) |  |
python.org |
uv Python package manager |
See below | See below |
| Git (2.52+) |  |
git-scm.com |
Step 2: Python: check latest version
There could be many python installed on your computer. For the Positron Stata extension to work, you need to use the most recent one installed from the Software Center (AWBG10201.4 or later).
Any program must use python from the path C:\WBG\Python313\python.exe . If not, you might encounter issues running Stata code in Positron.
To check which python you are using do one of the following:
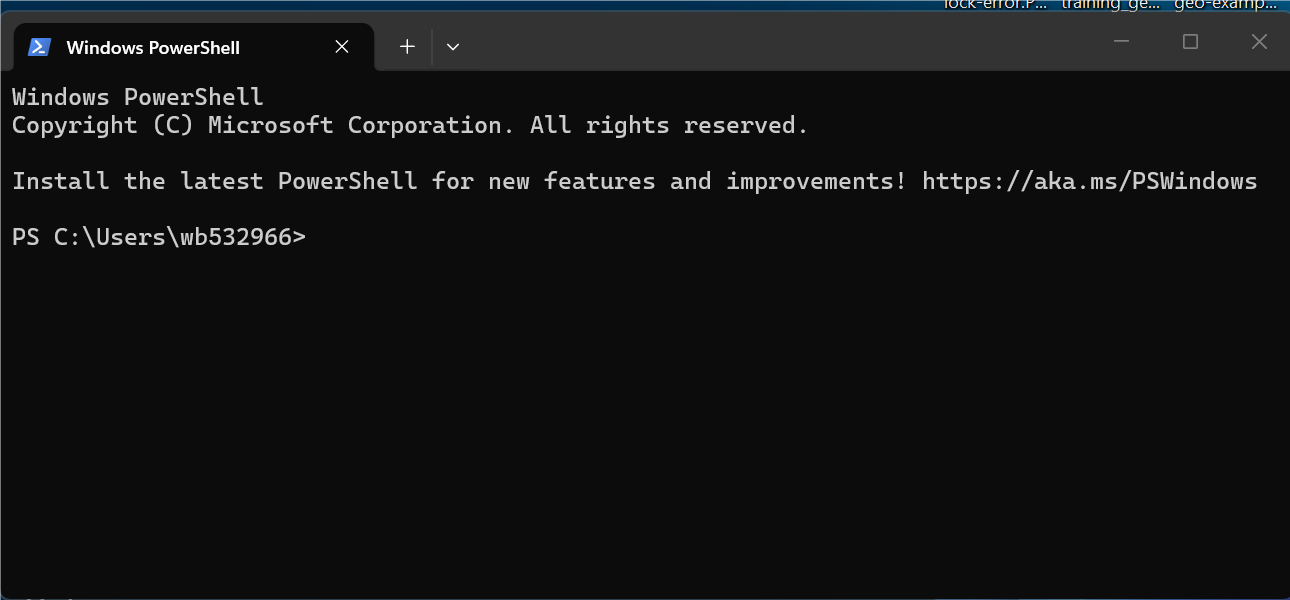
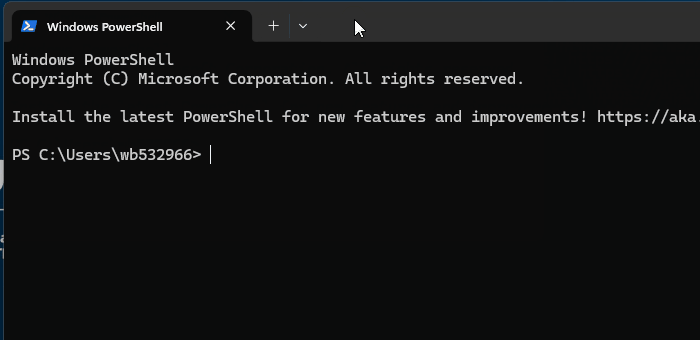
Open PowerShell: keyboard Windows > type “PowerShell” > hit Enter
You must see:
- a path like
C:\WBG\Python313\python.exeand - a Python version 3.13.
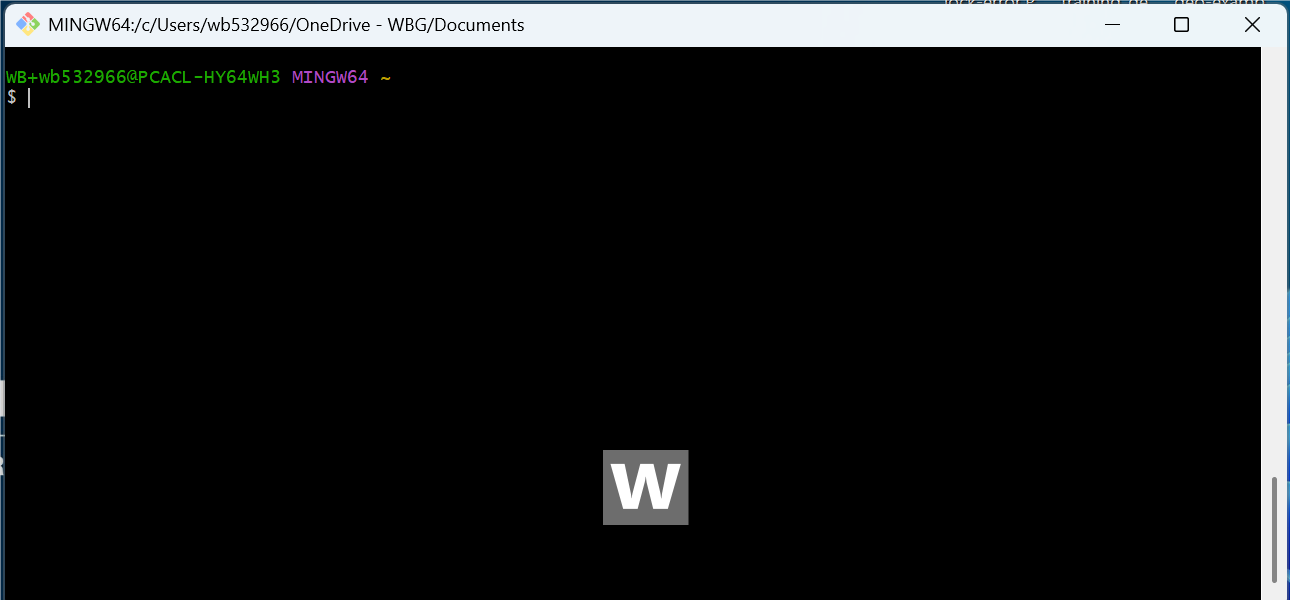
Open Git Bash: keyboard Windows > type “git bash” > hit Enter
You must see: - a path like /c/WBG/Python313/python.exe and - a Python version 3.13 or later.
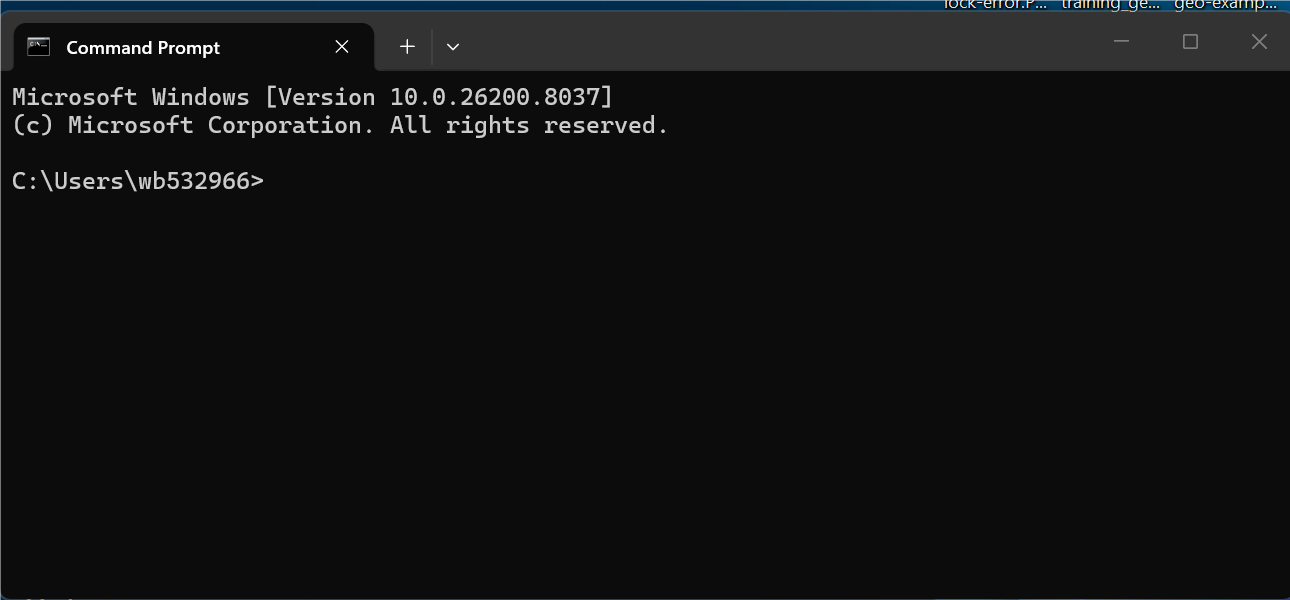
Open Command Prompt (cmd): keyboard Windows > type “cmd” > hit Enter
You must see: - a path like C:\WBG\Python313\python.exe at the top. - There might be other paths listed below, but the top one is the one being used by default. - a Python version 3.13 or later.
Step 3: uv (Python package manager)
This is very important for using Stata in Positron. Because UV is used for package management in the Positron Stata extension, if it’s not installed correctly, you won’t be able to run Stata code in Positron.
If it did not work as explained below:
- contact ITHelp@worldbank.org for assistance.
- check eservices KB: KB0114399 (WB VPN required to access)
To install and verify uv:
- Open PowerShell: keyboard
Windows> type “PowerShell” > hitEnter - Run:
You should see:
- Installation progress and completions
- a version number printed
- Open Git Bash: keyboard
Windows> type “git bash” > hitEnter - Run:
In success case, you would see the same as in power shell, but with different formatting.
Step 4: Verify software works
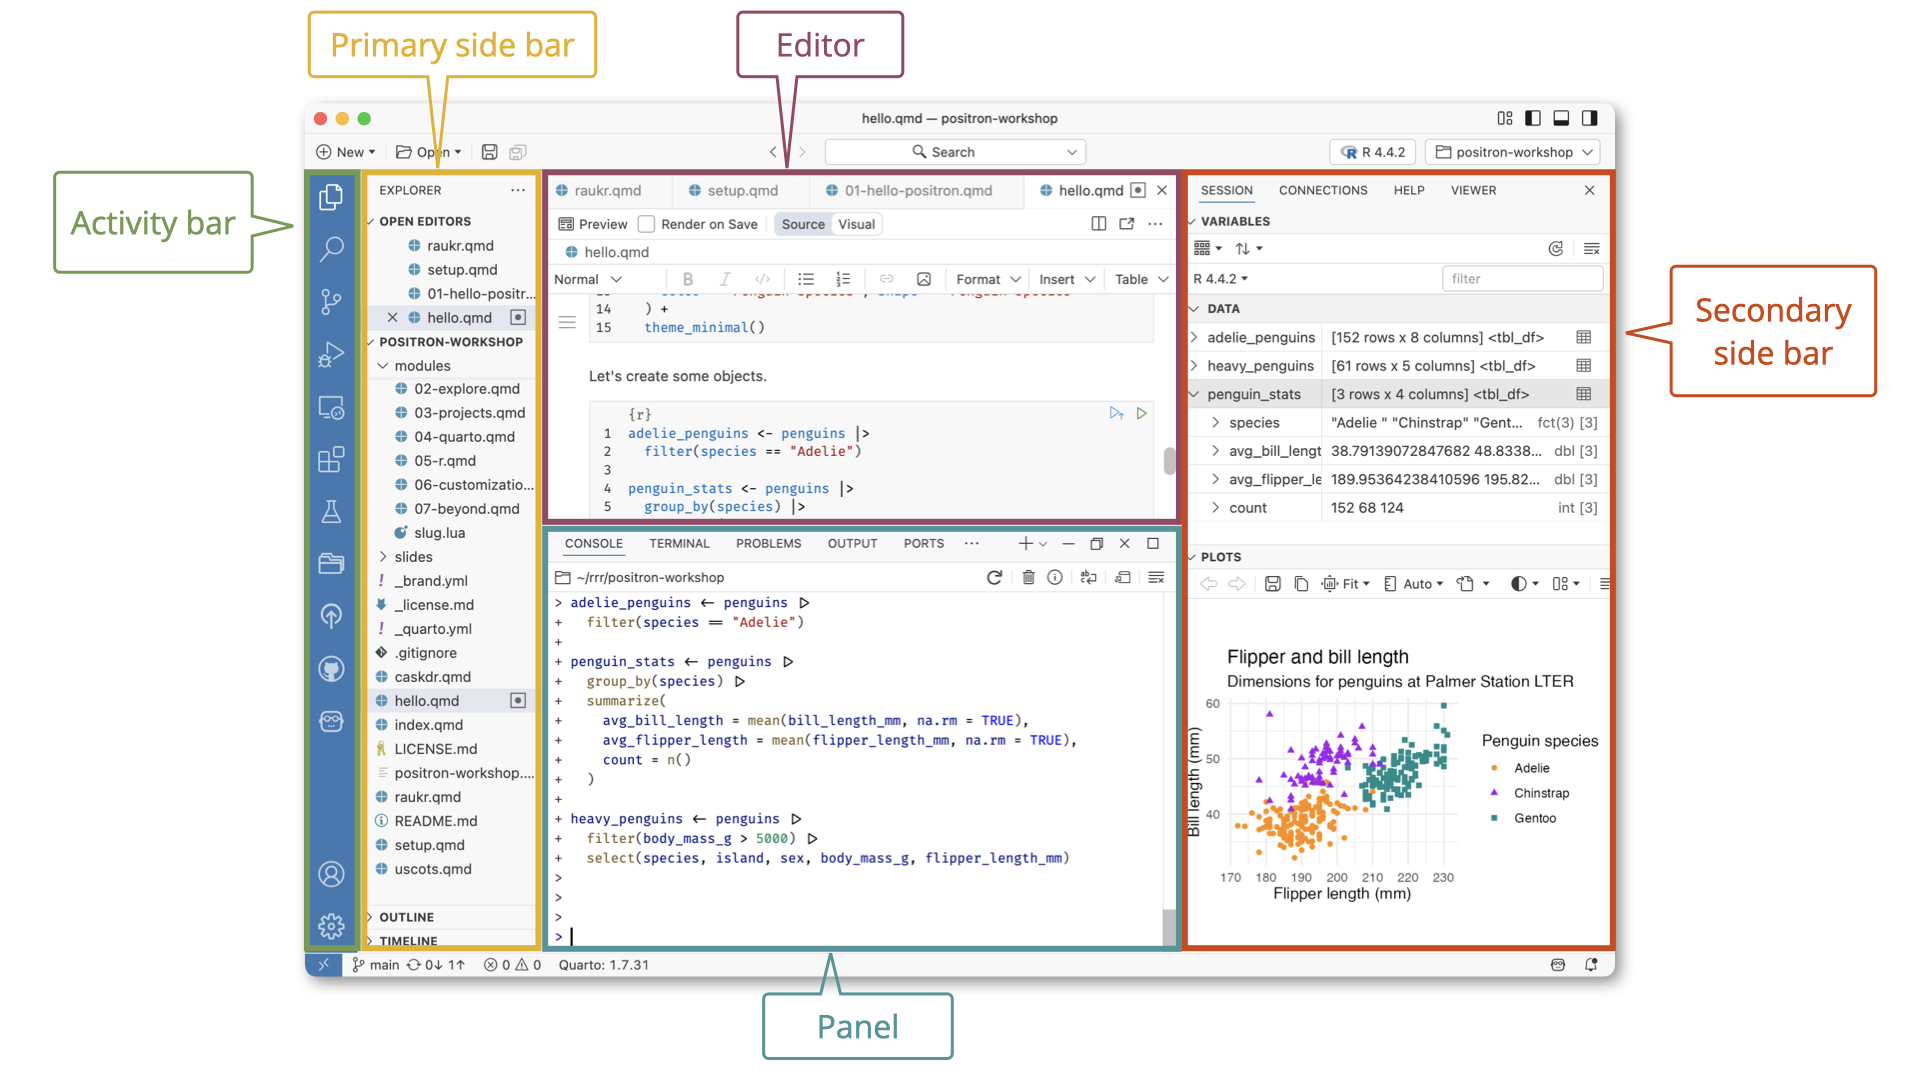
Positron
Open Positron — if it launches, it’s working.
- See Positron Overview for a tour of the layout.
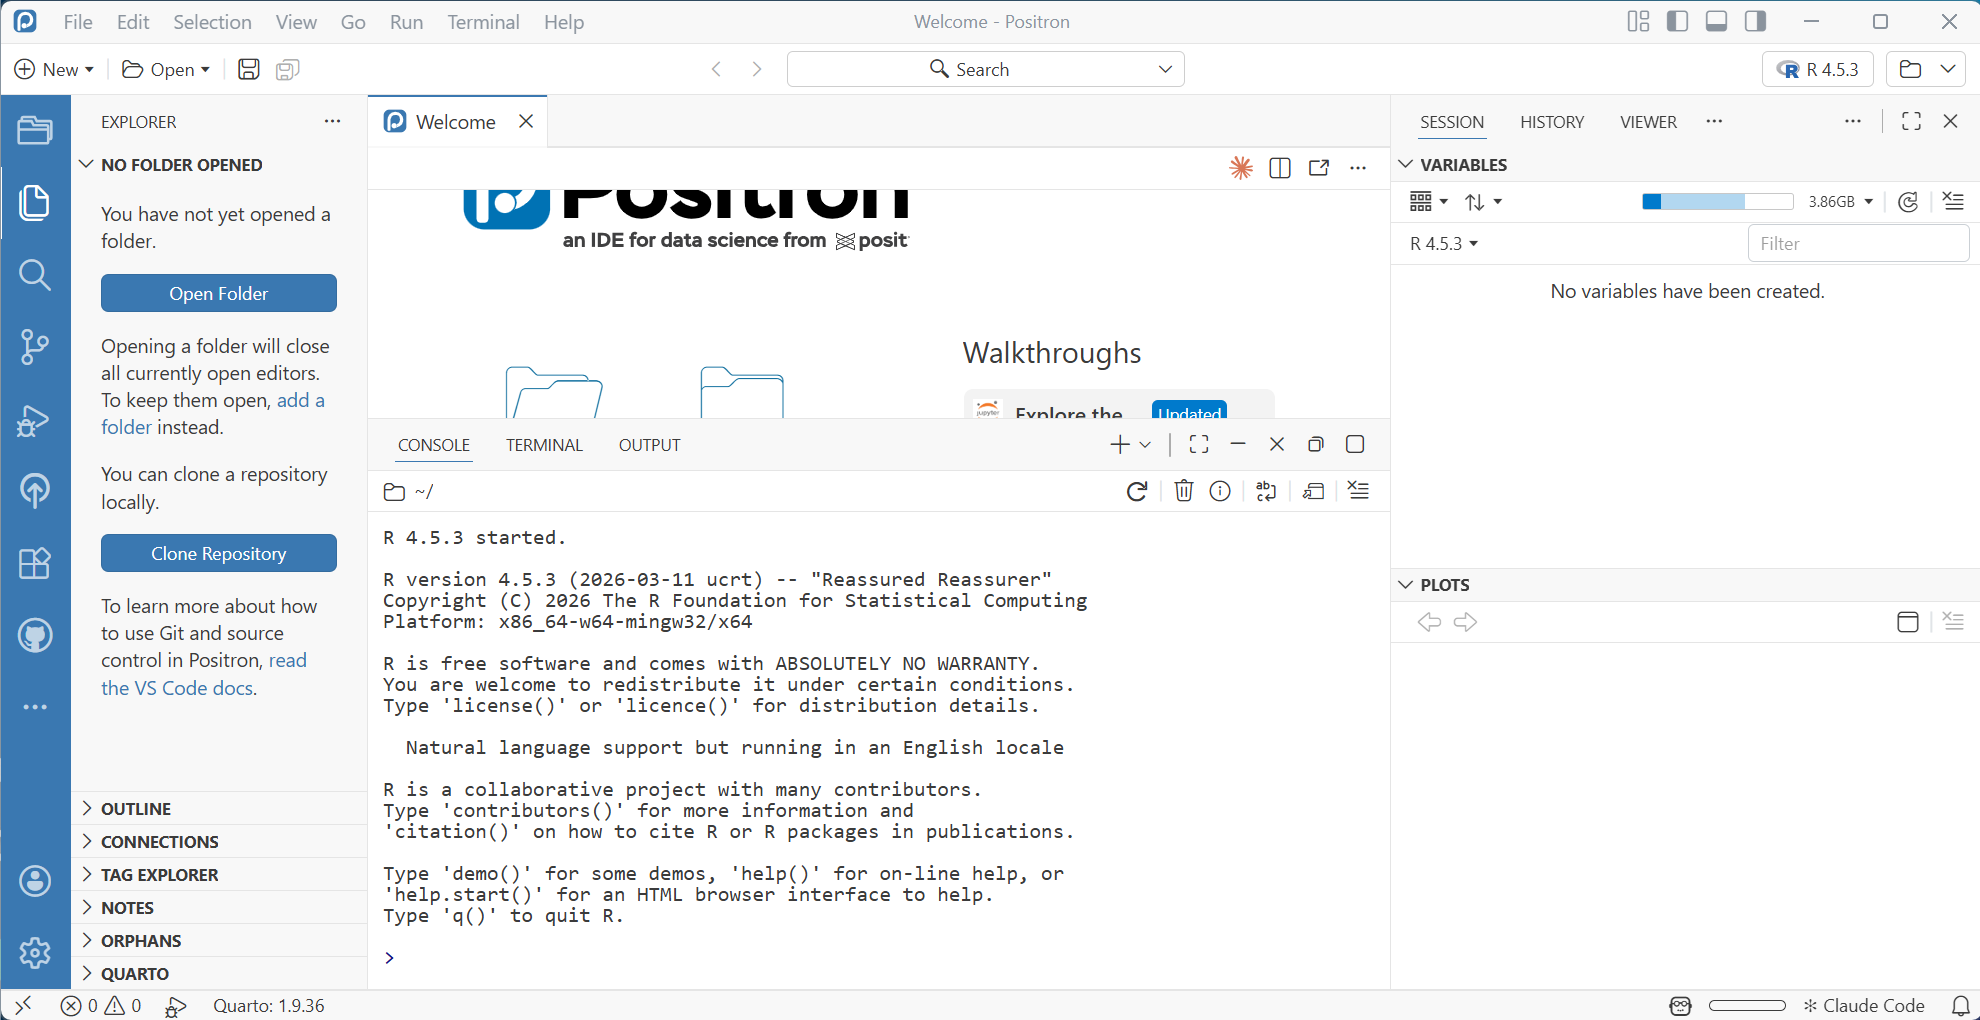
R
In Positron, open the Console (Ctrl+Shift+P → “Console: Focus on Console”).
- You should see an R interpreter.
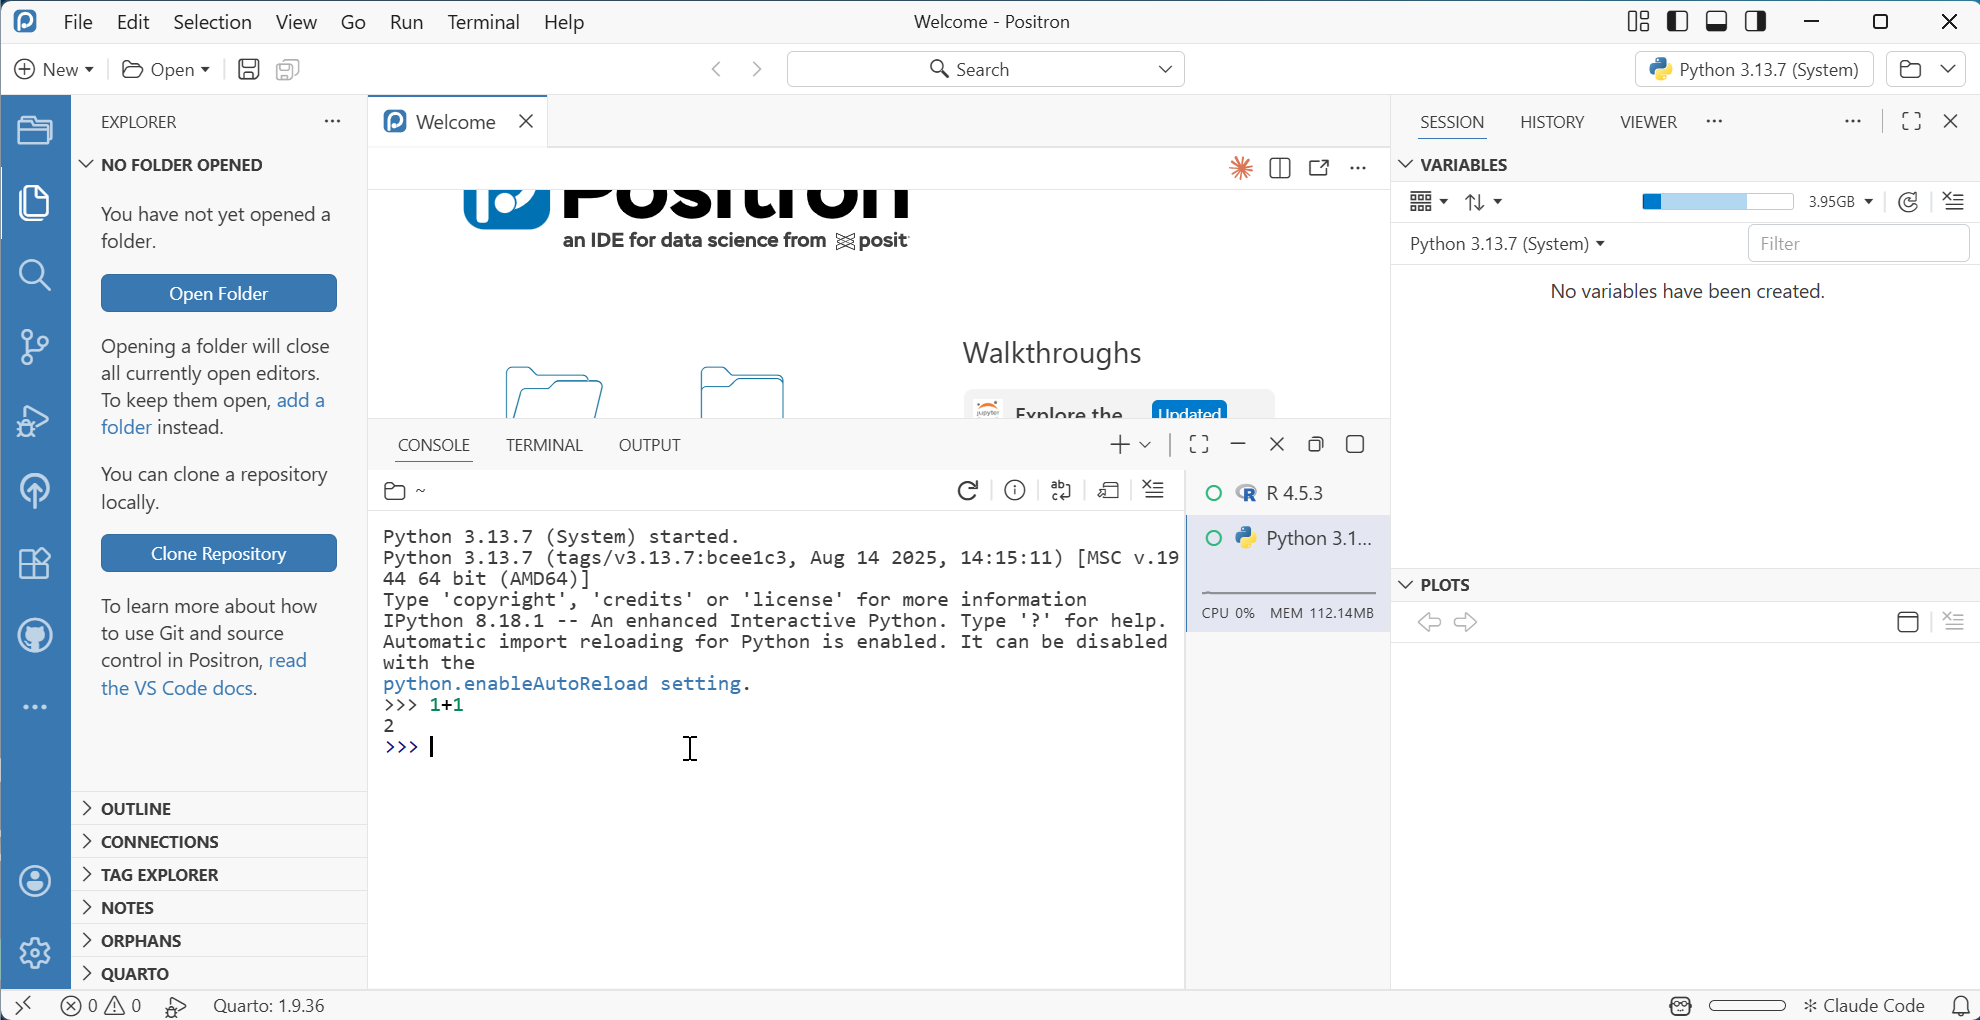
Python in Positron Console
Python in Positron Terminal
In Positron, open the Terminal (Ctrl+Shift+P → “Terminal: Create New Terminal”).
You should see the Python version and a list of installed packages.
uv in Positron Terminal
In the Terminal, run:
You should see a version number.

Quarto
In the Terminal, run:
You should see a version number and a passing check.
Step 5: Running R Python code in Positron
Follow instructions based on the language you want to run:
- Open a new file (
Ctrl+N), save it astest.R(Ctrl+S). - Copy-paste the following code:
# test-r.R
# Verify R is working: package management, palmerpenguins data,
# visualisations (scatter, histogram, box, facets), and regression.

# -------------------------------------------------------
# 1. Package check + install
# -------------------------------------------------------
required_pkgs <- c("tidyverse", "ggplot2", "palmerpenguins")

missing_pkgs <- required_pkgs[
  !sapply(required_pkgs, requireNamespace, quietly = TRUE)
]

if (length(missing_pkgs) > 0) {
  message("Installing missing packages: ", paste(missing_pkgs, collapse = ", "))
  install.packages(missing_pkgs, repos = "https://cloud.r-project.org")
} else {
  message("All required packages are already installed.")
}

library(tidyverse)
library(palmerpenguins)

# -------------------------------------------------------
# 2. Data overview
# -------------------------------------------------------
glimpse(penguins)

penguins_clean <- penguins |> drop_na()
cat(sprintf(
  "\nRows after dropping NAs: %d (removed %d)\n",
  nrow(penguins_clean),
  nrow(penguins) - nrow(penguins_clean)
))

# -------------------------------------------------------
# 3. Figure 1 — Scatter: bill dimensions coloured by species
# -------------------------------------------------------
fig_scatter <- ggplot(
  penguins_clean,
  aes(x = bill_length_mm, y = bill_depth_mm, colour = species, shape = species)
) +
  geom_point(alpha = 0.7, size = 2.5) +
  geom_smooth(method = "lm", se = FALSE, linewidth = 0.9) +
  scale_colour_manual(values = c("darkorange", "purple", "cyan4")) +
  scale_shape_manual(values = c(16, 17, 15)) +
  labs(
    title = "Bill length vs. bill depth",
    subtitle = "Linear fit per species",
    x = "Bill length (mm)",
    y = "Bill depth (mm)",
    colour = "Species",
    shape = "Species"
  ) +
  theme_minimal(base_size = 13)

print(fig_scatter)

# -------------------------------------------------------
# 4. Figure 2 — Histogram: flipper length by species (overlaid)
# -------------------------------------------------------
fig_hist <- ggplot(
  penguins_clean,
  aes(x = flipper_length_mm, fill = species)
) +
  geom_histogram(
    alpha = 0.6,
    binwidth = 5,
    position = "identity",
    colour = "white"
  ) +
  scale_fill_manual(values = c("darkorange", "purple", "cyan4")) +
  labs(
    title = "Flipper length distribution",
    x = "Flipper length (mm)",
    y = "Count",
    fill = "Species"
  ) +
  theme_minimal(base_size = 13)

print(fig_hist)

# -------------------------------------------------------
# 5. Figure 3 — Box plots: body mass by species and sex
# -------------------------------------------------------
fig_box <- ggplot(
  penguins_clean,
  aes(x = species, y = body_mass_g, fill = sex)
) +
  geom_boxplot(alpha = 0.7, outlier.shape = 21, outlier.size = 2) +
  scale_fill_manual(values = c("steelblue", "tomato")) +
  labs(
    title = "Body mass by species and sex",
    x = "Species",
    y = "Body mass (g)",
    fill = "Sex"
  ) +
  theme_minimal(base_size = 13) +
  theme(legend.position = "top")

print(fig_box)

# -------------------------------------------------------
# 6. Figure 4 — Faceted scatter: bill dimensions faceted by island
# -------------------------------------------------------
fig_facet <- ggplot(
  penguins_clean,
  aes(x = bill_length_mm, y = bill_depth_mm, colour = species, shape = species)
) +
  geom_point(alpha = 0.7, size = 2) +
  facet_wrap(~island, nrow = 1) +
  scale_colour_manual(values = c("darkorange", "purple", "cyan4")) +
  scale_shape_manual(values = c(16, 17, 15)) +
  labs(
    title = "Bill dimensions by island",
    subtitle = "Faceted by island of observation",
    x = "Bill length (mm)",
    y = "Bill depth (mm)",
    colour = "Species",
    shape = "Species"
  ) +
  theme_minimal(base_size = 13) +
  theme(
    panel.spacing = unit(1, "lines"),
    strip.text = element_text(face = "bold")
  )

print(fig_facet)

# -------------------------------------------------------
# 7. Regression: body mass ~ flipper length + bill length + species
# -------------------------------------------------------
model <- lm(
  body_mass_g ~ flipper_length_mm + bill_length_mm + bill_depth_mm + species,
  data = penguins_clean
)

cat("\n---- OLS Regression: Body mass ----\n")
print(summary(model))

# Tidy coefficient table
cat("\n---- Tidy coefficients ----\n")
coef_tbl <- broom::tidy(model, conf.int = TRUE) |>
  mutate(across(where(is.numeric), \(x) round(x, 3)))
print(coef_tbl)

cat(sprintf(
  "\nAdjusted R²: %.4f | Residual std. error: %.1f g\n",
  summary(model)$adj.r.squared,
  summary(model)$sigma
))- Open a new file (
Ctrl+N), save it astest.py(Ctrl+S). - Copy-paste the following code:
# test-python.py
# Verify Python is working: package management, palmerpenguins data,
# visualisations (violin, pairplot, bar + CI, KDE heatmap), and regression.

# -------------------------------------------------------
# 1. Package check + install
# -------------------------------------------------------
import importlib
import subprocess
import sys

required = ["palmerpenguins", "pandas", "matplotlib", "seaborn", "statsmodels", "scikit-learn"]

missing = [pkg for pkg in required if importlib.util.find_spec(pkg) is None]
if missing:
    print(f"Installing missing packages: {', '.join(missing)}")
    subprocess.check_call([sys.executable, "-m", "pip", "install", *missing])
else:
    print("All required packages are already installed.")

# -------------------------------------------------------
# 2. Imports and data loading
# -------------------------------------------------------
import pandas as pd
import matplotlib.pyplot as plt
import seaborn as sns
from palmerpenguins import load_penguins
import statsmodels.formula.api as smf
from sklearn.preprocessing import LabelEncoder

sns.set_theme(style="whitegrid", palette="colorblind")
SPECIES_PALETTE = {"Adelie": "#FF8C00", "Chinstrap": "#9400D3", "Gentoo": "#008B8B"}

# -------------------------------------------------------
# 3. Data loading
# -------------------------------------------------------
penguins = load_penguins()
penguins_clean = penguins.dropna().copy()

print(f"Total rows: {len(penguins)} | After dropping NAs: {len(penguins_clean)}")
print(penguins_clean.describe().round(2))

# -------------------------------------------------------
# 4. Figure 1 — Violin plots: body mass by species and sex
# -------------------------------------------------------
fig, ax = plt.subplots(figsize=(9, 5))
sns.violinplot(
    data=penguins_clean,
    x="species", y="body_mass_g",
    hue="sex", split=True,
    palette={"male": "steelblue", "female": "tomato"},
    inner="quartile", linewidth=1.2,
    ax=ax,
)
ax.set_title("Body mass distribution by species and sex", fontsize=14)
ax.set_xlabel("Species")
ax.set_ylabel("Body mass (g)")
plt.tight_layout()
plt.show()

# -------------------------------------------------------
# 5. Figure 2 — Pair plot of all numeric morphometrics
# -------------------------------------------------------
numeric_cols = ["bill_length_mm", "bill_depth_mm", "flipper_length_mm", "body_mass_g"]
pair_data = penguins_clean[numeric_cols + ["species"]]

pg = sns.pairplot(
    pair_data,
    hue="species",
    palette=SPECIES_PALETTE,
    diag_kind="kde",
    plot_kws={"alpha": 0.6, "s": 30},
)
pg.figure.suptitle("Pairwise relationships — all morphometric variables", y=1.02, fontsize=13)
plt.show()

# -------------------------------------------------------
# 5. Figure 3 — Mean flipper length per species × island (bar + CI)
# -------------------------------------------------------
summary = (
    penguins_clean
    .groupby(["island", "species"])["flipper_length_mm"]
    .agg(["mean", "sem"])
    .reset_index()
    .rename(columns={"mean": "mean_flipper", "sem": "se_flipper"})
)

fig, ax = plt.subplots(figsize=(9, 5))
sns.barplot(
    data=penguins_clean,
    x="island", y="flipper_length_mm",
    hue="species",
    palette=SPECIES_PALETTE,
    errorbar="se", capsize=0.08,
    ax=ax,
)
ax.set_title("Mean flipper length by island and species (±SE)", fontsize=14)
ax.set_xlabel("Island")
ax.set_ylabel("Flipper length (mm)")
ax.legend(title="Species", loc="lower right")
plt.tight_layout()
plt.show()

# -------------------------------------------------------
# 6. Figure 4 — KDE + rug: bill length by species
# -------------------------------------------------------
fig, ax = plt.subplots(figsize=(9, 5))
for species, colour in SPECIES_PALETTE.items():
    subset = penguins_clean.loc[penguins_clean["species"] == species, "bill_length_mm"]
    sns.kdeplot(subset, ax=ax, label=species, color=colour, linewidth=2, fill=True, alpha=0.15)
    ax.plot(subset, [-0.002] * len(subset), "|", color=colour, alpha=0.5, markersize=8)

ax.set_title("Kernel density of bill length by species (with rug)", fontsize=14)
ax.set_xlabel("Bill length (mm)")
ax.set_ylabel("Density")
ax.legend(title="Species")
plt.tight_layout()
plt.show()

# -------------------------------------------------------
# 7. OLS regression: body mass ~ morphometrics + species
# -------------------------------------------------------
formula = "body_mass_g ~ flipper_length_mm + bill_length_mm + bill_depth_mm + C(species)"
model = smf.ols(formula, data=penguins_clean).fit()

print("\n" + "=" * 60)
print("OLS Regression: body mass ~ morphometrics + species")
print("=" * 60)
print(model.summary())
print(f"\nN = {int(model.nobs)}  |  Adj. R² = {model.rsquared_adj:.4f}  |  RMSE = {model.mse_resid**0.5:.1f} g")
Step 6: Troubleshooting
Positron deinstalling itself after shutdown/restart
This is an irregular issue. It may be linked to:
ITS updated positron on the osftware center, which may have caused some conflicts with the previous version and deinstalled it.
Your laptop requires maintenance. Contact ITHelp@worldbankgroup.org for assistance.
Positron not launching after installation
Restart your computer.
Hit
Windows> type “ED Version” > hitEnterFind Positron in the list and uninstall it.
Restart your computer again.
Install Positron again from the Software Center.
Python not found
Make sure you have installed Python from the Software Center (AWBG10201.4 or later).
Check if your Python path is set to the new installation
If your python is not in
C:\WBG\Python313\python.exe, then do the following:
Contact ITHelp@worldbankgroup.org for assistance and tell them that you need to set the default python to the one installed from the software center (AWBG10201.4 or later). Currently when your computer uses python it uses an old installaiton of python that has limitations.
Python does not start
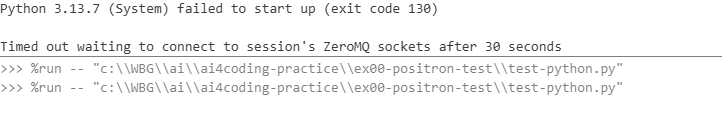
This may happend. WB laptops have many security layers and sometimes they block some functionalities of the software or it just taking longer to laod.
Chck that the latest python is installed and the path is correct (see Python check).
Start a new console for python and see if it works.
Restart your computer and try again.
uv is installed but does not work
For example:
Running
pip install uvfails, oruv --versionreturnscommand not found/not recognisedafter installation.uvinstalls but does not work in the terminal or Positron, or you see an error likeThe system cannot find the file specifiedwhen runninguv.
Reach out to ITHelp@worldbankgroup.org for assistance.
Is the Stata available at the software center?
Stata must be requested. Make a Software Installation Request or use R/Python instead.
Software does not install from the Software Center
Restart your computer and try again. If it still doesn’t work, this is not normal and your PC requires a maintanance. Contact ITHelp@worldbankgroup.org for assistance.
Cannot create folder in C:\WBG\
Thi is not normal and your PC requires a maintanance. Contact ITHelp@worldbankgroup.org for assistance.
If I’m using STATA, do I need R or Python?
You need Python to use Stata in Positron, but you don’t need R. However, we recommend installing R as well to have the full AI-assisted coding experience in Positron.
Quarto
Quarto is not found after installation: contact ITHelp@worldbankgroup.org for assistance setting up the Quarto path in your user environment variables.
When Quarto renders fail with an error like access denied or permission denied, you might be using a wrong path for your Quarto executable or may not have installed Quarto from the Software Center. Contact ITHelp@worldbankgroup.org for assistance.
Do we need to install Quarto too?
See Software installation above.
Licences
| Tool | Licence |
|---|---|
| Stata | Commercial |
| R | Free and Open Source |
| Python | Free and Open Source |
| Positron | Elastic License 2.0 - Source code available, built by Posit |
| Quarto | MIT - Free and open source, built by Posit |
| Git | Free and Open Source |
| Stata MCP extension | MIT - Free, open source |
| Positron Stata extension | Not-clear… |