Chapter 3 Poverty measures in South Asia
The World Bank set a target of reducing global extreme poverty to less than 3 percent by 2030 and to ensure continued focus and steady progress toward this goal.2 Progress towards this goal is measured by monitoring the share of the global population living below the international poverty line, currently set at US$1.90 in 2011 purchasing power parity (PPP) dollars. With the exception of Afghanistan, countries in South Asia measure the international extreme poverty status of an individual by comparing consumption expenditures per capita against this poverty line.
Even as much of the region leaves extreme poverty behind, poverty is becoming more entrenched and harder to root out in certain areas, particularly in countries burdened by violent conflict and weak institutions. Nepal experienced devastating earthquakes in 2015 and remains predominantly rural, with the highest share of labor force in agriculture (73%) in the region as of 2016. The Maldives were devastated by the 2004 tsunami while its tourism industry is seriously threatened by climate change. Even though the international poverty line cannot be used in Afghanistan, official poverty rates present a steady increase as violence continues to affect the security of livelihoods and economic activity in the country.
In this chapter, we will present two World Bank sources for poverty measures: the Poverty and Shared Prosperity Report and PovcalNet.
3.1 Poverty and shared prosperity report
According to the Poverty and Shared Prosperity Report (2018), the number of extreme poor in South Asia dropped to 216 million people in 2015, compared to half a billion in 1990, and Nigeria may already have overtaken India as the country with the most extreme poor in the world. Still, to achieve the Sustainable Development Goals, progress in poverty reduction needs to continue in India and the rest of South Asia.
Figure 3.1 presents the latest extreme poverty headcounts available in the Poverty and Shared Prosperity Report.

Figure 3.1: Poverty and Shared Prosperity Report (2018)
The latest poverty measures from the Poverty and Shared Prosperity Report (2018) are also shown in Table 3.1:
| Country | Survey year(s) | Population | Number of poor (millions) | Poverty rate (%) | Poverty gap (%) | Poverty gap/rate (%) |
|---|---|---|---|---|---|---|
| India | 2011.5 | 1311.19 | 175.7 | 13.42 | 2.4 | 17.7 |
| Bangladesh | 2010 and 2016 | 160.53 | 24.4 | 15.16 | 2.8 | 18.1 |
| Pakistan | 2013.5 and 2015.5 | 190.38 | 9.9 | 5.23 | 0.7 | 13.2 |
| Nepal | 2010.17 | 28.57 | 2.0 | 7.03 | 1.4 | 19.8 |
| Sri Lanka | 2012.5 and 2016 | 25.00 | 0.2 | 0.77 | 0.1 | 11.7 |
| Bhutan | 2012 and 2017 | 0.81 | 0.0 | 1.66 | 0.3 | 16.3 |
| Maldives | 2009.5 | 0.37 | 0.0 | 4.08 | 0.8 | 20.3 |
| Afghanistan | NA | 35.53 | NA | NA | NA | NA |
As expected, larger countries have a larger number of poor. However, note how Figure 3.2 clearly shows that Pakistan, which has a larger population than Bangladesh, proportionally has a smaller amount of extreme poor.
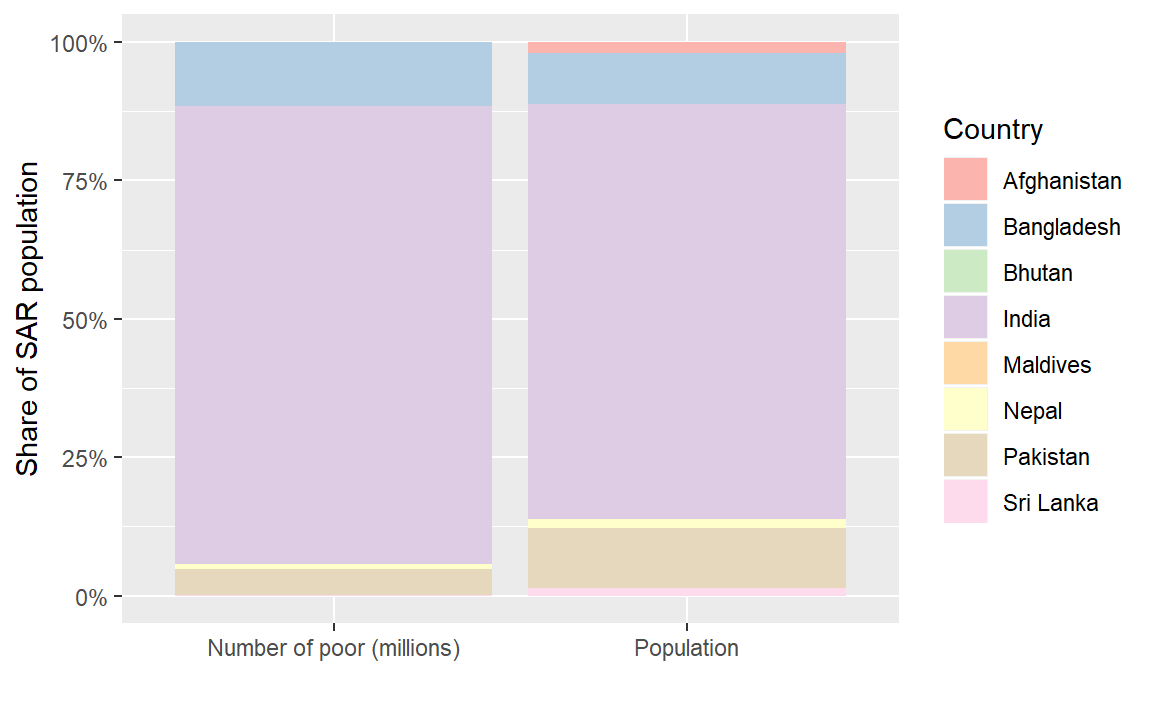
Figure 3.2: South Asia region shares of poor and total population by country
Based on the Poverty and Shared Prosperity Report (2018), we can provide the following highlights circa 2015:
- South Asia accounted for 29% of the people living in extreme poverty worldwide (216 million extreme poor in South Asia out of the estimated 736 million extreme poor worldwide).
- Four out of five extreme poor in the South Asia region resided in India. Despite a poverty rate of 13.42 percent, India’s large population of 1.3 billion results in a high absolute number of poor (175.7 million poor people).
- Bangladesh has made remarkable progress in reducing poverty, but its large population still maintained it in second place within the region in terms of absolute number of poor (24.4 million extreme poor).
- The third place is Pakistan, which has a larger population than Bangladesh, but a smaller amount of extreme poor (9.9 million extreme poor). Pakistan has seen a consistent and significant decline in poverty over the 14 years from 2001 to 2015.
- Bhutan and Sri Lanka are considered development success stories where extreme poverty has become rare, although a large share of the population subsists on slightly more than the extreme poverty line.
- In the Maldives, extreme poverty is nearly nonexistent according to the latest survey data.
3.2 PovcalNet
As explained in the official website, PovcalNet is an interactive computational tool that allows the user to replicate the calculations made by the World Bank’s researchers in estimating the extent of absolute poverty in the world. PovcalNet also allows you to calculate the poverty measures under different assumptions and to assemble the estimates using alternative economy groupings or for any set of individual economies of the user’s choosing. PovcalNet is self-contained; it has reliable built-in software that quickly does the relevant calculations for the user from the built-in database. SARMD is the underlying data used in PovcalNet for the South Asia Region. The poverty and inequality measures provided by PovcalNet for South Asia are described in Table 3.2 and may be accessed by interacting with Figure 3.3:
Figure 3.3: PovcalNet poverty and inequality measures
| Measure | Description |
|---|---|
| Gini | A measure of inequality between 0 (everyone has the same income) and 100 (richest person has all the income). |
| Headcount | % of population living in households with consumption per person below the poverty line. |
| Mean | Average monthly household per capita consumption expenditure from the survey in 2011 PPP. |
| Median | Median of monthly household per capita consumption expenditure from the survey in 2011 PPP. |
| MLD | Mean log deviation is an index of inequality, given by the mean across the population of the log of the overall mean divided by individual income. |
| Population | Country’s population in millions. |
| Povgap | The mean shortfall of income from the poverty line. The mean is based on the entire population treating the nonpoor as having a shortfall of zero, and the shortfall is expressed as a proportion of the poverty line. |
| Povline | Poverty line in 2011 PPP per day. The default poverty line is $1.90 per day. |
| Squared | The mean squared shortfall of income from the poverty line. The mean is based on the entire population treating the nonpoor as having a shortfall of zero, and the shortfall is expressed as a proportion of the poverty line (and then squared). |
| Watts | This is the mean across the population of the proportionate poverty gaps, as measured by the log of the ratio of the poverty line to income, where the mean is formed over the whole population, counting the nonpoor as having a zero poverty gap. |
The World Bank also set an interim target of 9 percent by 2020.↩