Chapter 19 Welfare and Emplomeny by Industry
Harmonized data for Bangladesh, Bhutan, and Pakistan have indicators for labor markets including industry category, industry, and labor force status, lstatus, and welfare aggregates, allowing for comparing welfare level by different industry groups.
Services and manufacturing industry have consistently favored non-poor households. Figure below shows that service industry, followed by manufacturing, pays higher income and thus leads to more consumption among households. In Bhutan and Pakistan, the welfare average in service industry is about two times as much as the one in agriculture. This difference of welfare level among sectors has been also widened over time.
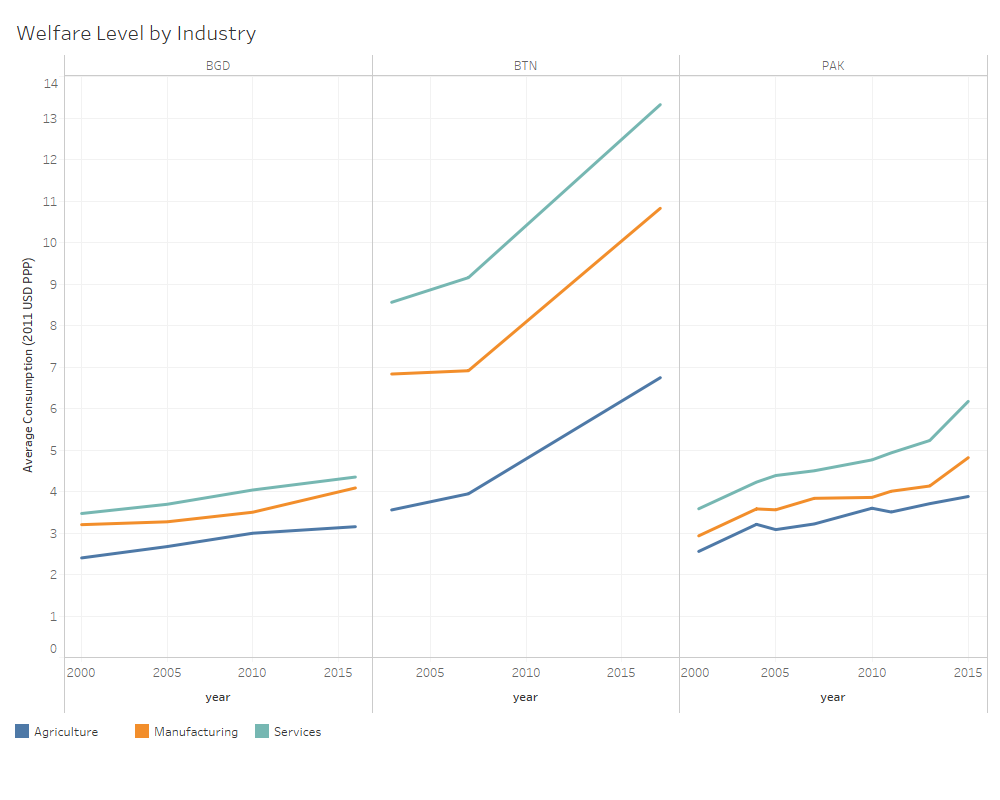
Figure 19.1: Welfare by Industry over time
When the industrial composition of employment is compared at different income levels, majority of households in the bottom quintile rely on agriculture whereas richest households work in either service or manufacturing sector. In Bhutan, about 90 percent of households in the bottom quintile belong to agriculture and more than 40 percent of the top 20 households earn their income from service industry.
Despite such difference of the reliance on agriculture between poor and non-poor groups, the share of agriculture employment has declined over time more evidently among bottom 20 groups. More than half of the poorest households depended on agriculture about 20 years ago in Bangladesh and Bhutan, but they moved to different sectors pursuing better income, lowering the overall share by about 7 and 40 percent respectively. Pakistan is an exception where the share of agriculture employment among poor households increased from 44.7 percent in 2010 to 58.2 percent in 2015.
The employment share in the manufacturing sector increased modestly in Bhutan and Pakistan, but a large increase occurred in the service sector. In Bangladesh with a large growth in garment industry, the percent of employment in manufacturing has risen to 24 percent and 31.4 percent in the bottom and top quintile groups.

Figure 19.2: Employment by Industry and Year
Overall, the trends in employment share by industry and income level emphasize the growth of service sector in the region. Unlike traditional expectation that globalization will lead developing countries to specialize in primary industry, service sector has gradually expanded in these countries regardless of income levels.
The prevalence of agriculture workers among poor households implies the importance of productivity improvement in the agriculture sector. Compared to service and manufacturing industry, agriculture workers have enjoyed small growth in welfare aggregate. Government policies and business development to increase its productivity will facilitate reducing poverty in the region (Irz et al. 2001; Janvry and Sadoulet 2010).
Figure 19.3: Employment by Industry and Year
You may access our full Stata do-file by accessing the following link. Our work consists of running the following command for each dataset and saving the results in order to export to Tableau.
Reference
Irz, X., Lin, L., Thirtle, C., & Wiggins, S. (2001). Agricultural productivity growth and poverty alleviation. Development policy review, 19(4), 449-466.
De Janvry, A., & Sadoulet, E. (2009). Agricultural growth and poverty reduction: Additional evidence. The World Bank Research Observer, 25(1), 1-20.
References
Irz, Xavier, Lin Lin, Colin Thirtle, and Steve Wiggins. 2001. “Agricultural Productivity Growth and Poverty Alleviation.” Development Policy Review 19 (4): 449–66. https://doi.org/10.1111/1467-7679.00144.
Janvry, Alain de, and Elisabeth Sadoulet. 2010. “Agricultural Growth and Poverty Reduction: Additional Evidence.” The World Bank Research Observer 25 (1): 1–20. https://doi.org/10.1093/wbro/lkp015.