Accessibility#
The Accessibility Dimension evaluates women’s daily mobility by examining their access to essential services. Levels of enablement for work access in this dimension are determined by service areas, which represent the geographic zones that facilities like childcare, supermarkets, universities, banks, and clinics can serve based on proximity. The nearer these facilities are to where women live, the more supportive and enabling the environment becomes for their participation in the workforce. For more information on data input used from open sources, please refer to the Data Collection section.
General Overview#
This tool evaluates how easily women can access essential services and amenities, considering their caregiving roles and daily travel needs. It uses geospatial area analysis with OpenStreetMap (OSM) data to measure accessibility for several factors, including:
Women’s Travel Patterns: Access to everyday services like pharmacies, markets, supermarkets, childcare centers, schools and parks.
Access to Public Transport: Proximity to bus stops, train stations and other transport facilities.
Health Facilities: Availability of clinics, hospitals and other healthcare services.
Education and Training Facilities: Distance to colleges, universities and other training centers.
Financial Facilities: Access to banks and financial support institutions.
Travel mode: The user can select walking or driving as a travel mode, and it is recommended that the same travel mode should be selected for all accessibility factors. The default travel mode is walking due to its inclusive nature.
Measurement: The default measurement for travel is distance in meters, which is most appropriate for walking. These thresholds are based on evidence from the literature at the factor level and are designed to provide consistency across analyses. If driving is selected as a travel mode, time in minutes is a more appropriate measurement.
Thresholds: They can be adjusted depending on the scope of the analysis—whether it is conducted at a broader scale, such as the national level, or focused on a more localized context, such as urban or regional areas.
💡 Tip: If evidence from the local context suggests alternative thresholds and increments are more appropriate, the user can alter these increments. If the selected travel mode is driving, the equivalent measurement increments should be in minutes and informed by the local context (for example, if evidence suggests the maximum time that women spend driving is 30 minutes, the increments could be 6, 12, 18, 24, 30).
Output: The process generates zones around these amenities, showing how far women can travel on foot or by car within increasing distances or times. Each zone is assigned a score from 5 (high accessibility) to 0 (no accessibility), reflecting decreasing accessibility as distance or travel time increases.
Input Accessibility factors#
Women’s Travel Patterns (WTP)#
Women’s Travel Patterns (WTP) refer to the unique travel behaviors of women, often involving multiple stops for household or caregiving tasks, making proximity to essential services like markets, supermarkets, childcare centers, primary schools, pharmacies and green spaces crucial. This factor is composed by 5 subfactors which provide additional granularity: kindergartens/childcare | primary schools | groceries | pharmacies | green spaces.
Locate Women’s Travel Patterns Section
🖱️🖱️ Double-click on the Women’s Travel Patterns section to open the pop-up.
📝 In the Input field, you can select layers already loaded in the QGIS Layer Panel from the dropdown menu or manually enter the file path for the shapefiles (point features) corresponding to the indicators by clicking the three-dot button.
🔧 Travel mode (optional): Change the travel mode from walking to driving and the measurements from meters to minutes and amend the default thresholds if local context suggests more appropriate increments.
⚖️ Assign Weights: Assign appropriate weights to reflect the relative importance of each factor in the analysis. Ensure these values are consistent with your project objectives, accurately represent the significance of each factor and add up to 1 for a balanced evaluation.
🚫 Exclude Unused Factors (optional): If a specific factor is not intended to be included in the process, uncheck the Use button associated with it.
🔄 Readjust Weights: After excluding any factors, make sure to Balance Weights of the remaining factors. This step ensures the weight distribution remains balanced and totals correctly, preserving the integrity of the analysis.
✅ Finalize: Once all settings are configured, click OK to confirm and proceed to the next step.
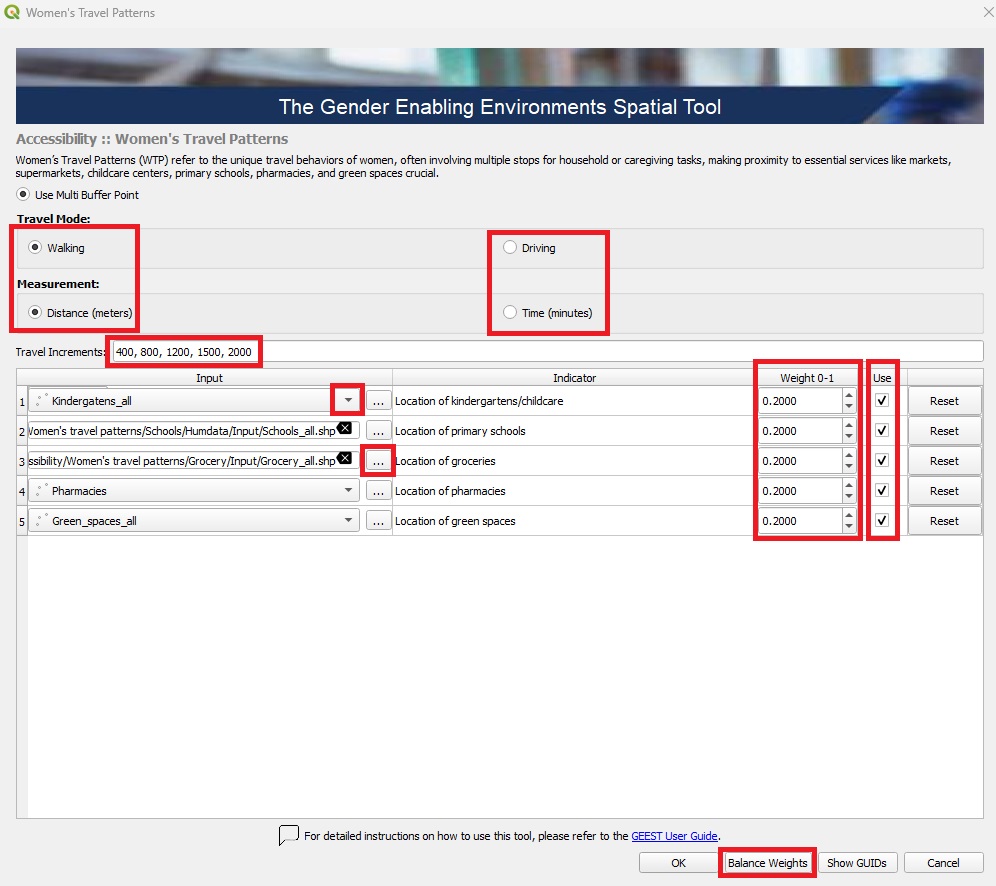
Default Women’s Travel Patterns thresholds:
| Distance to Facilities (meters) (National Level Analysis) |
Score | Distance to Facilities (meters) (Local Level Analysis) |
Score |
|---|---|---|---|
| 0 - 400 | 5 | 0 - 300 | 5 |
| 401 - 800 | 4 | 301 - 800 | 4 |
| 801 - 1,200 | 3 | 801 - 1,000 | 3 |
| 1,201 - 1,500 | 2 | 1,001 - 1,300 | 2 |
| 1,501 - 2,000 | 1 | 1,301 - 1,500 | 1 |
| Over 2,000 | 0 | Over 1,500 | 0 |
Process Women’s Travel Patterns factors
Back in the Data Processing Interface:
🖱️ Right-click on Women’s Travel Patterns.
▶️ Select “Run Item Workflow” from the context menu to initiate the process.

The successful completion of the process is indicated by the green checkmark widgets:

Access to Public Transport#
Access to Public Transport focuses on the availability and proximity of public transportation stops, which is crucial for women, especially those who rely on buses, trains, or trams to access jobs, education, and essential services.
Locate Access to Public Transport Section
🖱️🖱️ Double-click on the Access to Public Transport section to open the pop-up.
📝 In the Input field, you can select layers already loaded in the QGIS Layer Panel from the dropdown menu or manually enter the file path for the shapefile (point features) corresponding to the Location of public transportation stops, including maritime by clicking the three-dot button.
🔧 Travel mode (optional): Change the travel mode from walking to driving and the measurements from meters to minutes and amend the default thresholds if local context suggests more appropriate increments.
🚫 Exclude Factor (optional): If this factor is not intended to be included in the process, uncheck the Use button associated with it.
✅ Finalize: Once all settings are configured, click OK to confirm and proceed to the next step.
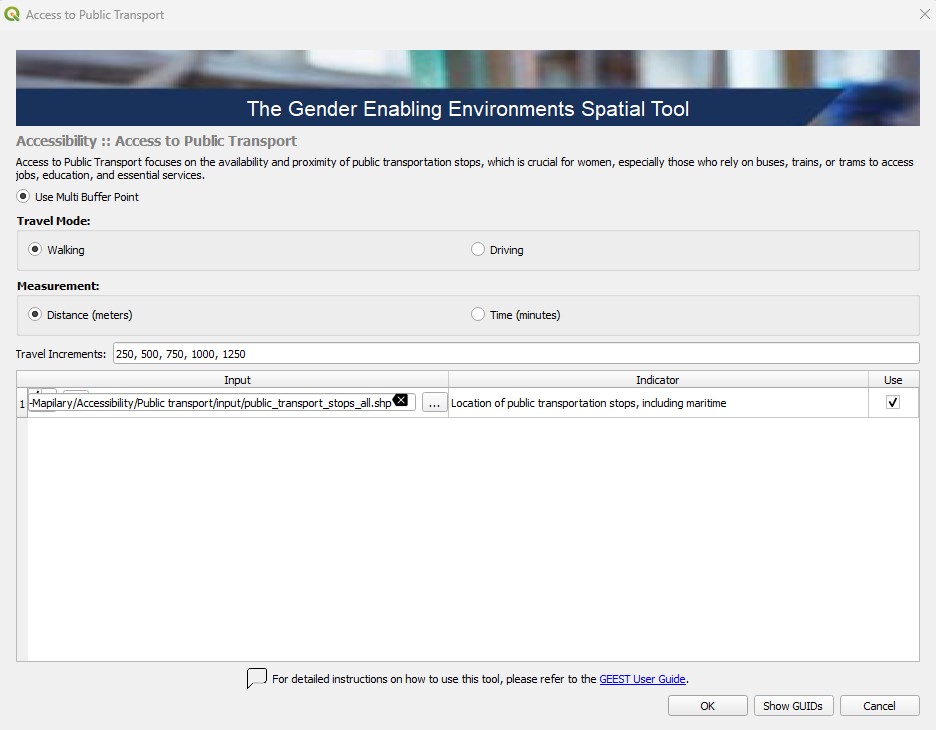
Default Access to Public Transport thresholds:
| Distance to Public Transport Stops (meters) (National Level Analysis) |
Score | Distance to Public Transport Stops (meters) (Local Level Analysis) |
Score |
|---|---|---|---|
| 0 - 250 | 5 | 0 - 250 | 5 |
| 251 - 500 | 4 | 251 - 500 | 4 |
| 501 - 750 | 3 | 501 - 750 | 3 |
| 751 - 1,000 | 2 | 751 - 1,000 | 2 |
| 1,001 - 1,500 | 1 | 1,001 - 1,250 | 1 |
| Over 1,500 | 0 | Over 1,250 | 0 |
Process Access to Public Transport factor
Back in the Data Processing Interface:
🖱️ Right-click on Access to Public Transport.
▶️ Select “Run Item Workflow” from the context menu to initiate the process.

The process should be successfully completed and indicated by a green checkmark widget.
Access to Health Facilities#
Access to Health Facilities evaluates how easily women can reach healthcare services in terms of distance, impacting their well-being and ability to participate in the workforce.
Locate Access to Health Facilities Section
🖱️🖱️ Double-click on the Access to Health Facilities section to open the pop-up.
📝 In the Input field, you can select layers already loaded in the QGIS Layer Panel from the dropdown menu or manually enter the file path for the shapefile (point features) corresponding to the Location of hospitals and clinics by clicking the three-dot button.
🔧 Travel mode (optional): Change the travel mode from walking to driving and the measurements from meters to minutes and amend the default thresholds if local context suggests more appropriate increments.
🚫 Exclude Factor (optional): If this factor is not intended to be included in the process, uncheck the Use button associated with it.
✅ Finalize: Once all settings are configured, click OK to confirm and proceed to the next step.
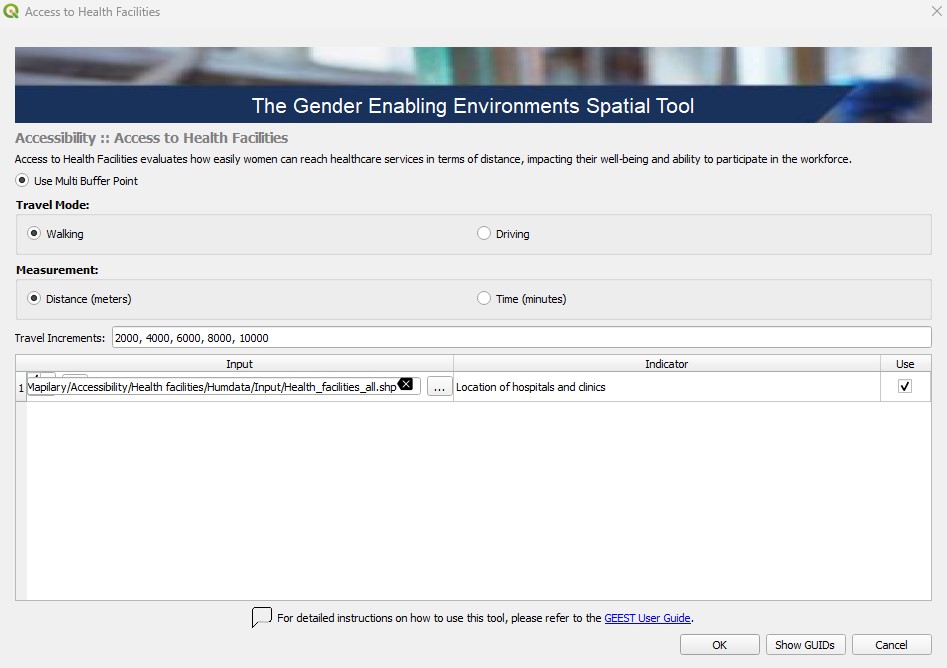
Default Access to Health Facilities thresholds:
| Distance to Health Facilities (meters) (National Level Analysis) |
Score | Distance to Health Facilities (meters) (Local Level Analysis) |
Score |
|---|---|---|---|
| 0 - 2,000 | 5 | 0 - 400 | 5 |
| 2,001 - 4,000 | 4 | 401 - 800 | 4 |
| 4,001 - 6,000 | 3 | 801 - 1,250 | 3 |
| 6,001 - 8,000 | 2 | 1,251 - 1,650 | 2 |
| 8,001 - 10,000 | 1 | 1,651 - 2,500 | 1 |
| Over 10,000 | 0 | Over 2,500 | 0 |
Process Access to Health Facilities factor
Back in the Data Processing Interface:
🖱️ Right-click on Access to Health Facilities.
▶️ Select “Run Item Workflow” from the context menu to initiate the process.
The process should be successfully completed and indicated by a green checkmark widget.
Access to Education and Training Facilities#
Access to Education and Training Facilities assesses the proximity to higher education institutions and training centers, influencing women’s ability to gain necessary qualifications.
Locate Access to Education and Training Facilities Section
🖱️🖱️ Double-click on the Access to Education and Training Facilities section to open the pop-up.
📝 In the Input field, you can select layers already loaded in the QGIS Layer Panel from the dropdown menu or manually enter the file path for the shapefile (point features) corresponding to the Location of universities and technical schools by clicking the three-dot button.
🔧 Travel mode (optional): Change the travel mode from walking to driving and the measurements from meters to minutes and amend the default thresholds if local context suggests more appropriate increments.
🚫 Exclude Factor (optional): If this factor is not intended to be included in the process, uncheck the Use button associated with it.
✅ Finalize: Once all settings are configured, click OK to confirm and proceed to the next step.
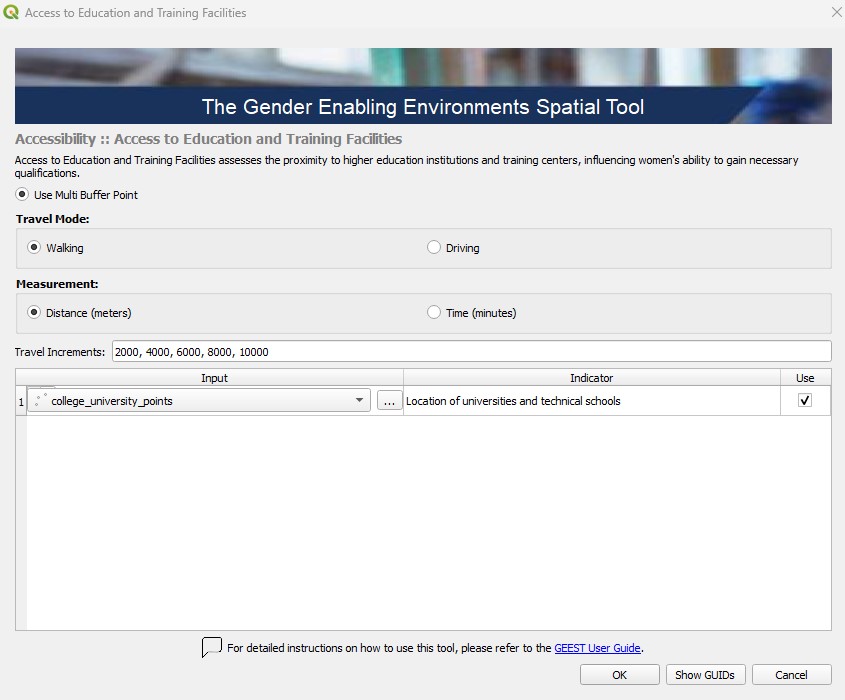
Default Access to Education and Training Facilities thresholds:
| Distance to Facilities (meters) (National Level Analysis) |
Score | Distance to Facilities (meters) (Local Level Analysis) |
Score |
|---|---|---|---|
| 0 - 2,000 | 5 | 0 - 350 | 5 |
| 2,001 - 4,000 | 4 | 351 - 700 | 4 |
| 4,001 - 6,000 | 3 | 701 - 1,100 | 3 |
| 6,001 - 8,000 | 2 | 1,101 - 1,500 | 2 |
| 8,001 - 10,000 | 1 | 1,501 - 2,100 | 1 |
| Over 10,000 | 0 | Over 2,100 | 0 |
Process Access to Education and Training Facilities factor
Back in the Data Processing Interface:
🖱️ Right-click on Access to Education and Training Facilities.
▶️ Select “Run Item Workflow” from the context menu to initiate the process.
The process should be successfully completed and indicated by a green checkmark widget.
Access to Financial Facilities#
Access to Financial Facilities focuses on the proximity of banks and financial institutions, which is essential for women’s economic empowerment and ability to access credit.
Locate Access to Financial Facilities Section
🖱️🖱️ Double-click on the Access to Financial Facilities section to open the pop-up.
📝 In the Input field, you can select layers already loaded in the QGIS Layer Panel from the dropdown menu or manually enter the file path for the shapefile (point features) corresponding to the Location of banks and other financial facilities by clicking the three-dot button.
🔧 Travel mode (optional): Change the travel mode from walking to driving and the measurements from meters to minutes and amend the default thresholds if local context suggests more appropriate increments.
🚫 Exclude Factor (optional): If this factor is not intended to be included in the process, uncheck the Use button associated with it.
✅ Finalize: Once all settings are configured, click OK to confirm and proceed to the next step.
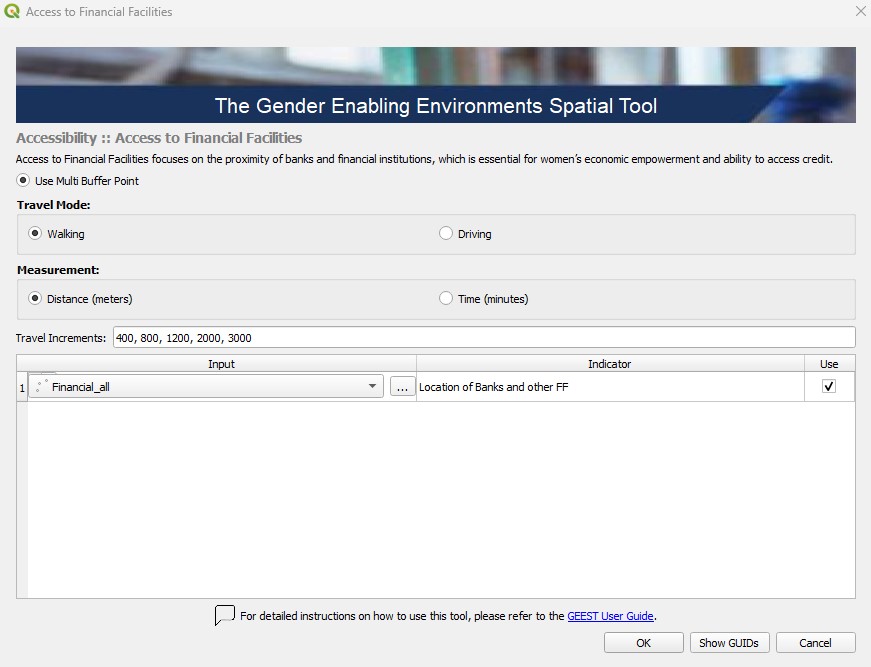
Default Access to Financial Facilities thresholds:
| Distance to Financial Facilities (meters) (National Level Analysis) |
Score | Distance to Financial Facilities (meters) (Local Level Analysis) |
Score |
|---|---|---|---|
| 0 - 400 | 5 | 0 - 500 | 5 |
| 401 - 800 | 4 | 501 - 1,000 | 4 |
| 801 - 1,200 | 3 | 1,001 - 1,500 | 3 |
| 1,201 - 2,000 | 2 | 1,501 - 2,000 | 2 |
| 2,001 - 3,000 | 1 | 2,001 - 2,500 | 1 |
| Over 3,000 | 0 | Over 2,500 | 0 |
Process Access to Financial Facilities factor
Back in the Data Processing Interface:
🖱️ Right-click on Access to Financial Facilities.
▶️ Select “Run Item Workflow” from the context menu to initiate the process.
The process should be successfully completed and indicated by a green checkmark widget.
Additional Steps Before Processing:
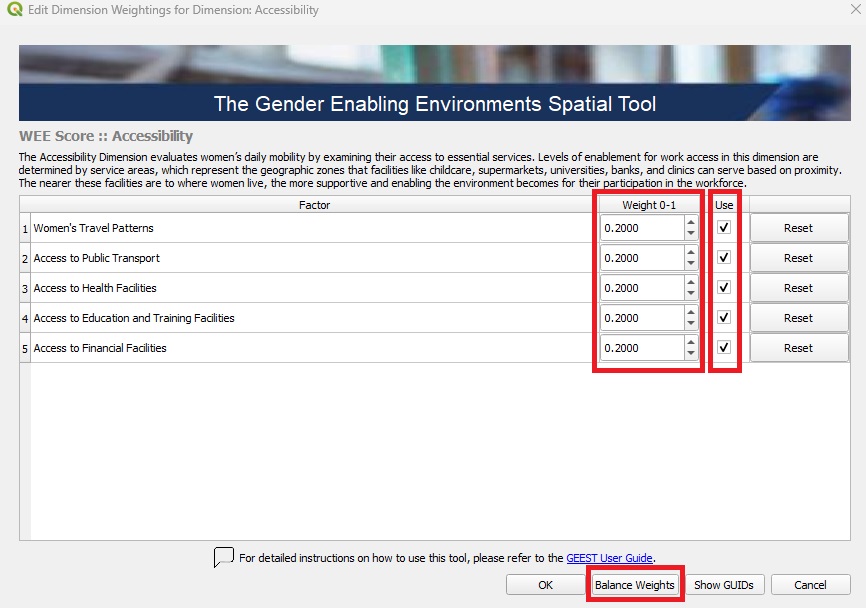
🖱️🖱️ Double-click on the Accessibility section to open the pop-up.
⚖️ Assign Weights: Ensure the weights are correctly assigned, as they determine the relative importance of each factor in the analysis. Carefully review these values to ensure they are aligned with your project’s objectives and reflect the significance of each factor accurately.
🚫 Exclude Unused Factors (optional): If a specific factor is not intended to be included in the process, uncheck the Use button associated with it.
🔄 Readjust Weights: After excluding any factors, make sure to Balance Weights of the remaining factors. This step ensures the weight distribution remains balanced and totals correctly, preserving the integrity of the analysis, then click OK to proceed.
Process Accessibility factors#
After configuring the factors and adjusting their weights to achieve balance, you can initiate the process workflow:
🖱️Right-click on Accessibility.
▶️Select Run Item Workflow from the context menu.
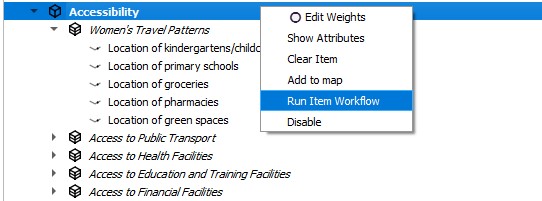
The process should be successfully completed and indicated by a green checkmark widget.
Visualizing the Outputs#
After completing the process, the outputs are automatically added to the Layer Panel in QGIS as a group layer. This group layer has the Mutually Exclusive Group feature activated, which ensures that only one layer within the group can be visible at a time. When this feature is enabled, turning on the visibility of one layer automatically turns off the visibility of the others within the same group, making it easier to compare results without overlapping visualizations.
The outputs consist of all factors and subfactors, as well as the aggregation of these into the final Accessibility output. All scores are assessed on a scale from 0 to 5, categorized as follows: ≤ 0.5 (Not Enabling) | 0.5–1.5 (Very Low Enablement) | 1.5–2.5 (Low Enablement) | 2.5–3.5 (Moderately Enabling) | 3.5–4.5 (Enabling) | 4.5–5.0 (Highly Enabling).
The outputs are stored under the Accessibility folder within the project folder created during the setup phase as raster files. These files can be shared and further utilized for various purposes, such as visualization in QGIS or other GIS software, integration into reports, overlaying with other spatial datasets, or performing advanced geospatial analyses, such as identifying priority areas or conducting trend analysis based on the scores.
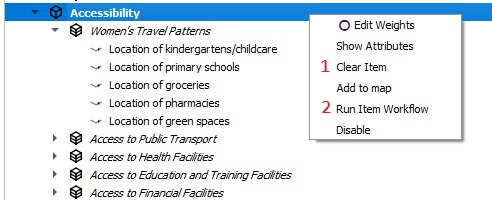
If the results do not immediately appear in the Layer Panel after processing the Accessibility Dimension, you can resolve this by either adding them manually from the folder path or by right-clicking on the Accessibility Dimension and selecting Add to map from the context menu:
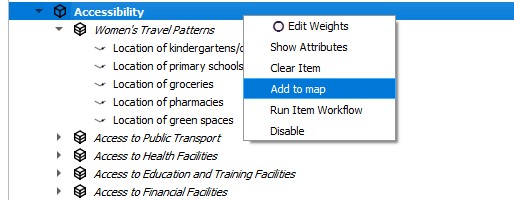
💡 Tip: If the input needs to be changed for any reason (e.g., incorrect initial input), you can clear the results and reprocess them as follows:
🖱️ Right-click on the factor/dimension and select Clear Item.
🖱️ Right-click again on the same cleared factor/dimension, and while holding the SHIFT key on your keyboard, select Run Item Workflow. This process ensures that the tool reassesses the input datasets and outputs the corrected scores.
Key Considerations#
Input Accuracy: Ensure all input datasets are carefully entered/selected and correspond to the correct factors and/or subfactors. Incorrect data will impact the outputs and subsequent analysis.
Weight Adjustment: Assign weights thoughtfully to reflect the importance of each factor in the overall analysis. After making changes, always balance the weights to ensure they sum up correctly.
