
Congestion Study#
Waze Data#
The Waze for Cities Data program is a free, two-way data exchange empowering public sector decision makers to achieve concrete community impact.
Waze provides information about traffic jams and events that affect road conditions, either from drivers using Waze, a.k.a. Wazers, or from external sources. Wazers provide road reports, or UGIs (User-Generated Incidents), which include detailed information about specific traffic and road conditions. They may issue reports from the location at which they are currently located or, if no longer at the location, within 30 minutes after the event occurred. Waze also provides automatic alerts for what they call Unusual Traffic - incidents that affect a large number of users and fall outside the normal traffic patterns for a given day and time.
Waze traffic data consists of the following information:
General information: time-stamp of the file, geographic area from which the data was retrieved.
Traffic alerts: traffic incidents reported by users.
Traffic jams: traffic slowdown information generated by the service based on a user’s location and speed.
Unusual Traffic (Irregularities): alerts and traffic jams that affect an exceptionally large number of users.
In this notebook, we are using Traffic Jams dataset
Jams Dataset#
The jams section includes data gathered in real time about traffic slowdowns on specific road segments. The URL includes an array of jams and the start time and date of the report. Waze generates traffic jam information by processing the following data-sources:
GPS location-points sent from users phones (users who drive while using the app) and calculations of the actual speed vs. average speed (on specific time-slot) and free-flowspeed (maximum speed measured on the road-segment)
User-generated reports shared by Waze users who encounter traffic-jams. These appear as regular alerts, and also affect the way we identify and present trafficjams.
Limitations#
We do not know how much the number of users vary across the days
We do not know how users are spatialy distributed
Daily number of jams#
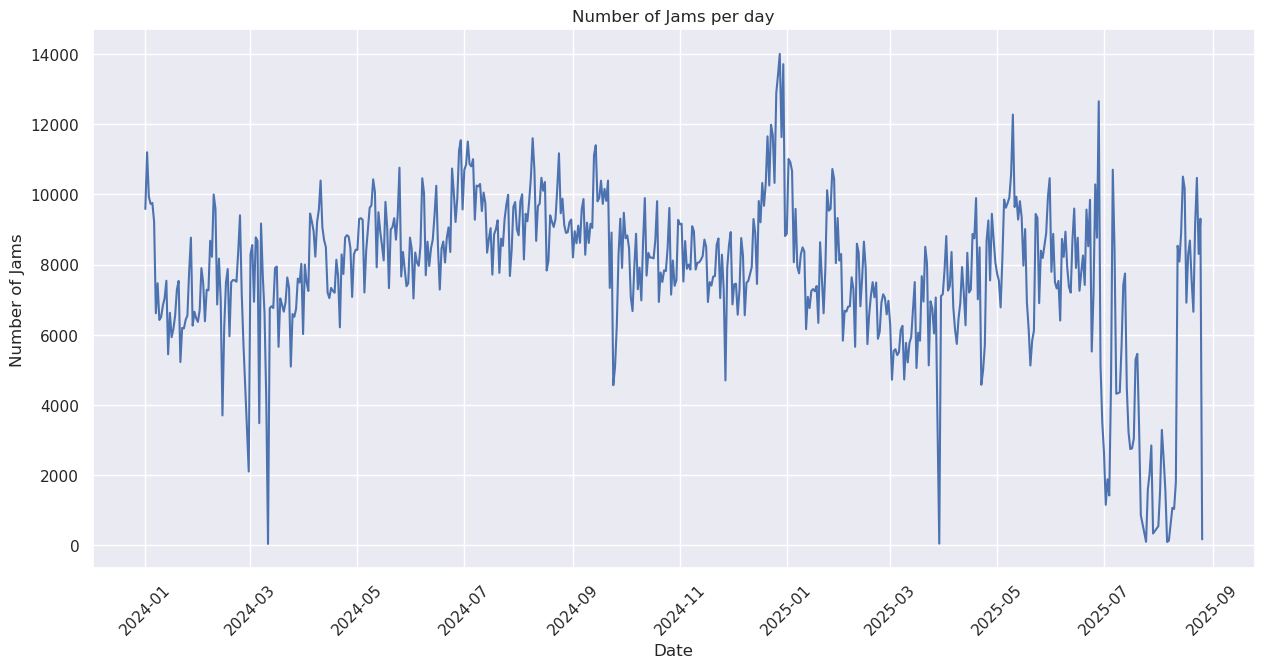
The first plot counts the number of unique jams generated across each day in Bali from 01-01-2024 to 08-26-2025. We can extract the following:
We observe a major increase in number of jams by the end of 2024, this migh be related to the holiday season.
We observe that the number of jams decrease during the first months of the year and start to increase around March-April.
Data for July and August 2025 does not seem to be representative as we observe an unexpected decrease in number of jams. Since July and August 2025 were the month of interest for the client, we suggest studying July and August in 2024.
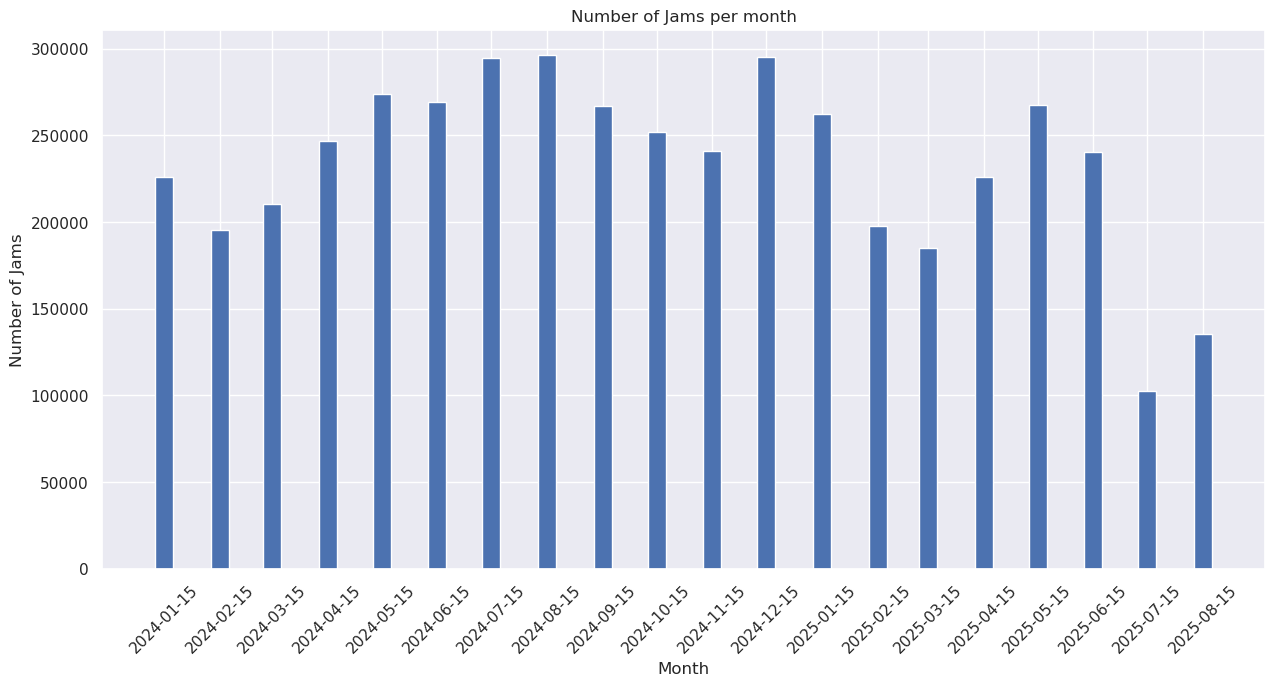
In the second plot, we find that months with more registered traffic jams are July, August and December 2024.
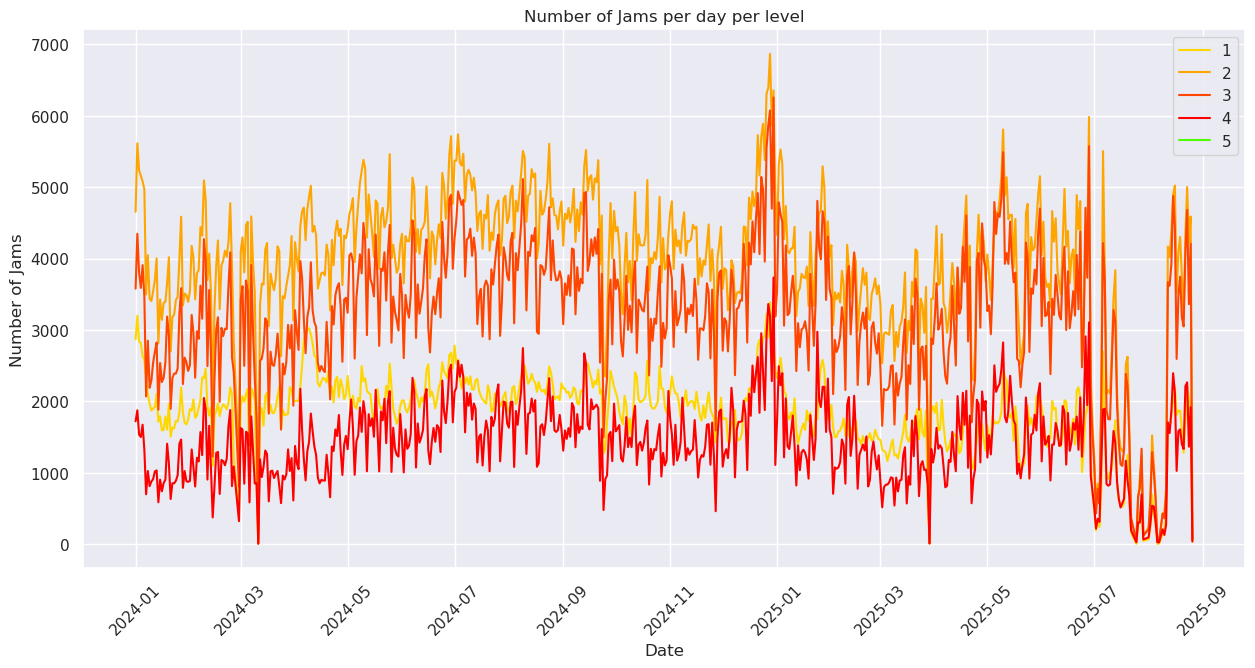
Finally, we produced the daily number of jams by its level. The level is related to the amount free flow speed is reduced by the jam:
0 = free flow speed to 80% of free flow speed
1 = 80% to 61% of free flow speed
2 = 60% to 41%
3 = 40% to 21%
4 = 20% to 1%
5 = blocked road
From this final plot, we can observe that the most common jams are level 2 and 3. We do not observe any anomaly, for example, a period with a disproportional increase in level 4 traffic jams.
Traffic Congestion Intensity#
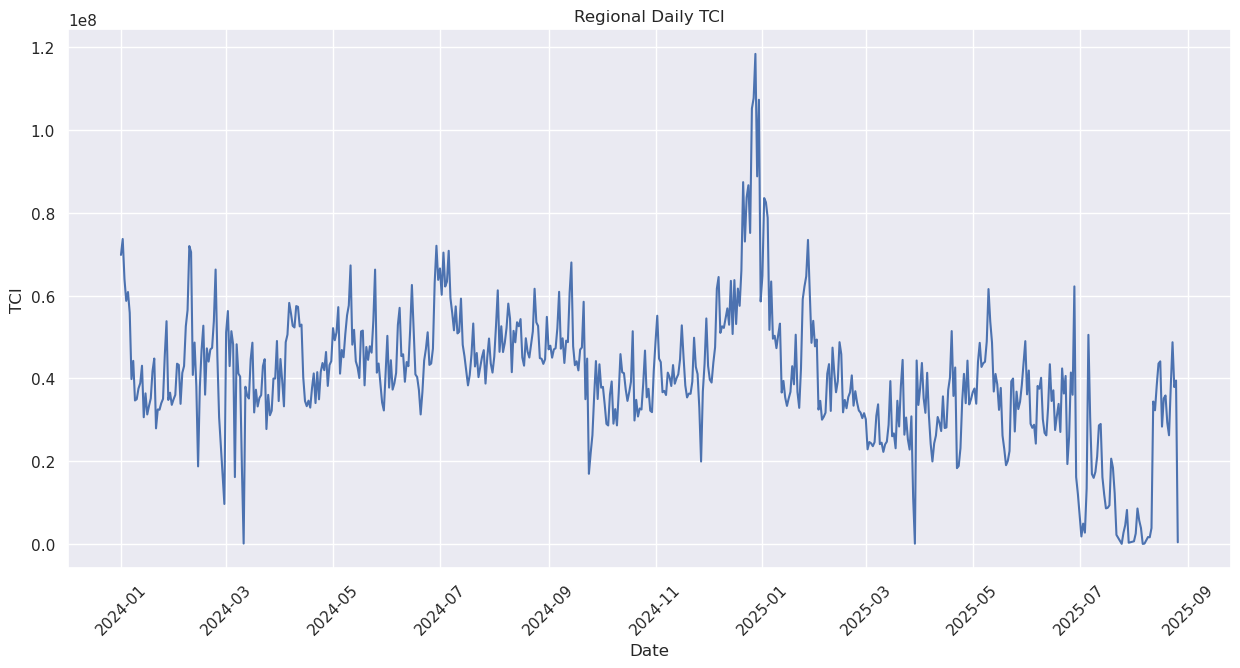
This index tries to not only consider the number of jams but its duration. Every time a jam appears in the waze dataset, we add its length, the more time a jam is seen, the more it contributes to the index. For now, this is done for the whole area of operation.
If this indicator is useful, we can explore weighting it by the reduction in speed, or disaggregate it by level as well.
Hourly TCI by group of days#
We grouped days considering working schema from Bali (for client to confirm): Tue-Wed-Thu, Mon-Fri, Sat-Sun . There is an important limitation to be aware of, we only know when the jam starts but not when it ends.
The hourly TCI plots for Bali are different from other regions in the world. There are no significant differences across the three week/weekend schemas we proposed. This might be related to tourism related trips having different hours than work commmute trips.
For the week days plots, it calls our attention that the morning peak happens around noon. We had not found behaviors like this in past experiences with Waze data. This might also be related to turistic trips.