Accidents Study#
Waze also provides the alerts dataset which includes all traffic data reported by Waze users through the Waze mobile application.
In the following analysis, we are extracting all the alerts classified as Accidents from Jan-2024 to Aug-2025. Accidents are aggregated at h3 level 8.
We observe, as expected, that there seems to be a spatial correlation between high levels of traffic and accidents. We can observe this by looking at the spatial distribution of TCI for July/August 2024 and the spatial distribution of accidents.
Indicators by administrative level 3#
We calculated the following indicators:
number of accidents by 100,000 people
number of accidents by 100 km of road
The administrative boundaries ‘Kuta’, ‘Kuta Utara’, ‘Kuta Selatan’, ‘Ubud’, ‘Denpasar Barat’ have the 5 highest rate of accident per population. This is expected as the regions present high levels of traffic, see TCI hourly distribution for them. Ubud stands out as a region with high number of accidents per population. Probably, this is associated with its high touristic demand.
| population | accidents | roads_length | accidents_per_100000ppl | accidents_per_100kmroad | |
|---|---|---|---|---|---|
| NAME_3 | |||||
| Kuta | 88899.61 | 404 | 510175.46 | 454.45 | 79.19 |
| Kuta Utara | 163204.43 | 332 | 1132320.12 | 203.43 | 29.32 |
| Kuta Selatan | 232355.34 | 337 | 2064867.83 | 145.04 | 16.32 |
| Ubud | 101279.53 | 137 | 555024.23 | 135.27 | 24.68 |
| Denpasar Barat | 246241.61 | 215 | 890700.25 | 87.31 | 24.14 |
| Denpasar Selatan | 352552.00 | 263 | 1328579.84 | 74.60 | 19.80 |
| Sukawati | 136900.51 | 98 | 1038546.53 | 71.58 | 9.44 |
| Mengwi | 184945.00 | 121 | 1158650.54 | 65.42 | 10.44 |
| Denpasar Timur | 214028.99 | 130 | 719164.28 | 60.74 | 18.08 |
| Kediri | 75809.76 | 40 | 867165.10 | 52.76 | 4.61 |
| Tampaksiring | 41610.01 | 20 | 316307.13 | 48.07 | 6.32 |
| Denpasar Utara | 243867.60 | 113 | 870841.46 | 46.34 | 12.98 |
| Tegallalang | 52561.58 | 22 | 482763.15 | 41.86 | 4.56 |
| Blahbatuh | 71844.21 | 30 | 594353.13 | 41.76 | 5.05 |
| Abiansemal | 136058.76 | 42 | 718185.06 | 30.87 | 5.85 |
| Tabanan | 56150.28 | 17 | 579225.63 | 30.28 | 2.93 |
| Payangan | 55605.04 | 16 | 370020.07 | 28.77 | 4.32 |
| Gianyar | 91136.68 | 20 | 707315.04 | 21.95 | 2.83 |
| population | accidents | roads_length | accidents_per_100000ppl | accidents_per_100kmroad | |
|---|---|---|---|---|---|
| NAME_3 | |||||
| Kuta | 88899.61 | 404 | 510175.46 | 454.45 | 79.19 |
| Kuta Utara | 163204.43 | 332 | 1132320.12 | 203.43 | 29.32 |
| Ubud | 101279.53 | 137 | 555024.23 | 135.27 | 24.68 |
| Denpasar Barat | 246241.61 | 215 | 890700.25 | 87.31 | 24.14 |
| Denpasar Selatan | 352552.00 | 263 | 1328579.84 | 74.60 | 19.80 |
| Denpasar Timur | 214028.99 | 130 | 719164.28 | 60.74 | 18.08 |
| Kuta Selatan | 232355.34 | 337 | 2064867.83 | 145.04 | 16.32 |
| Denpasar Utara | 243867.60 | 113 | 870841.46 | 46.34 | 12.98 |
| Mengwi | 184945.00 | 121 | 1158650.54 | 65.42 | 10.44 |
| Sukawati | 136900.51 | 98 | 1038546.53 | 71.58 | 9.44 |
| Tampaksiring | 41610.01 | 20 | 316307.13 | 48.07 | 6.32 |
| Abiansemal | 136058.76 | 42 | 718185.06 | 30.87 | 5.85 |
| Blahbatuh | 71844.21 | 30 | 594353.13 | 41.76 | 5.05 |
| Kediri | 75809.76 | 40 | 867165.10 | 52.76 | 4.61 |
| Tegallalang | 52561.58 | 22 | 482763.15 | 41.86 | 4.56 |
| Payangan | 55605.04 | 16 | 370020.07 | 28.77 | 4.32 |
| Tabanan | 56150.28 | 17 | 579225.63 | 30.28 | 2.93 |
| Gianyar | 91136.68 | 20 | 707315.04 | 21.95 | 2.83 |
Indicators by administrative level 2#
| Accidents | Registered Vehicles - 2017 | Accidents per 100000 Vehicles | |
|---|---|---|---|
| Badung | 1236 | 796657 | 155.0 |
| Denpasar | 721 | 1292618 | 56.0 |
| Gianyar | 323 | 408582 | 79.0 |
| Tabanan | 57 | 386821 | 15.0 |
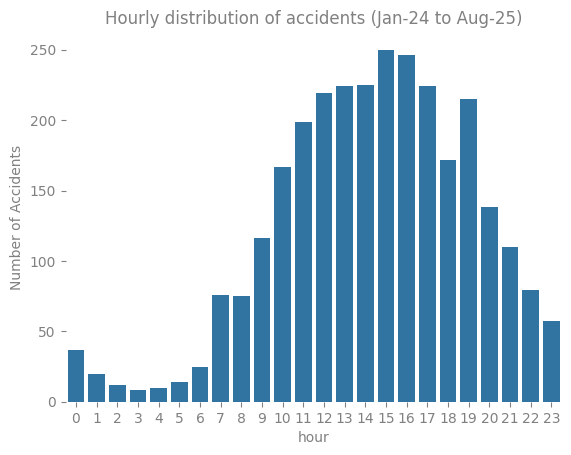
Hourly distribution of accidents#
Finally, we plot the hourly distribution of accidents for the period of analysis. We observe almost a plateu around 11AM and 20PM which is in accordance with the traffic distribution be obtained before. However, around 15PM/16PM we observe a peak in number of accidents which is not strongly associated with the plots we had seen before.