Correlation between TCI and accidents#
This section of the analysis studies the spatial correlation between TCI and accidents. The studied period of this analysis is from January 2020 to August 2025. The employed methodology is simple:
Calculate the TCI for the whole studied period at h3 level 8.
Calculate the number of accidents for the whole studied period at h3 level 8.
Calculate the correlation between 1 and 2.
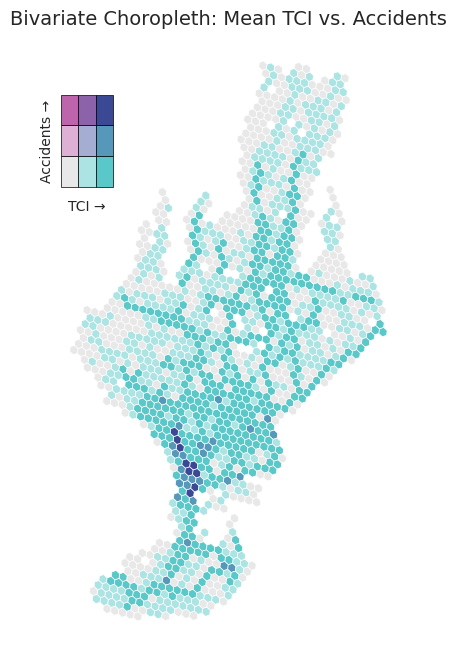
Plot a Bivariate Choropleth map.
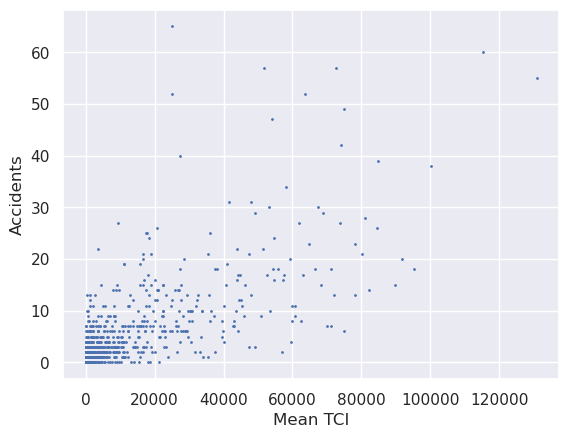
We found that there is a mid/strong correlation between TCI and accidents of 0.76. Below, we can observe the scatter plot and the Bivariate Choropleth map showing the spatial correlation.