1. Data overview (10 min)
In this module, we want to give you a little more specific information about the data we’ll be working with. First, it’s helpful to understand the basic data formats that are used with geospatial data analysis.
1.1. Data Structure
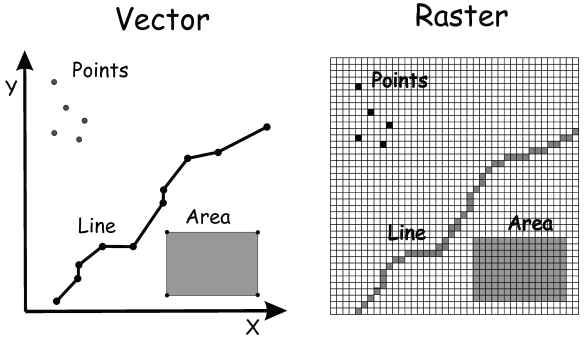
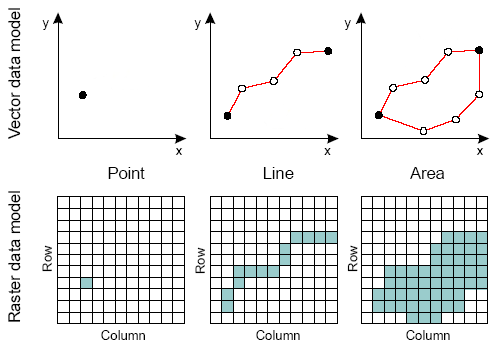
Raster vs. Vector data
Geospatial data from the “real world” can be stored in different types of formats or data types: In this course we will be working with two types of geospatial data stored as either a raster or a vector format.
1.1.1. Raster files
A satellite image, an image you take with your camera or even a map layer you are looking at can be examples of geospatial data that are stored in a raster format. These images are composed of pixels that are organized in rows and columns, with values and location. The size of a given pixel depends on the spatial resolution of the sensor.
Raster files are often composed out of multiple bands (channels). Each band represents, for example, the amount of electromagnetic radiation reflected from the surface on Earth along multiple regions of the electromagnetic spectrum.
Raster data is typically used to represent continuous surfaces, where knowing the exact boundaries in high precision is of less importance.
1.1.2. Vector files
1.1.4. GeoTIFFs
The meta-data stored in a TIFF is called a tif tag and GeoTIFFs often contain tags including:
Spatial extent: what is the area coverage of this file?
Coordinate reference system: what projection / coordinate reference system is used?
Resolution: rasters contain pixels, so what is the spatial extent of each pixel (spatial resolution)?
Number of layers: how many layers or bands are in the file?
1.1.5. Cloud-optimized geoTIFFs (COGs)
It’s often the case with remote sensing analysis that you only need to view or analyze a particular area and the data that contains that area is in a very large file that contains a much larger region of the world. COGs allow you to query just the area that you’re interested in, saving you time and storage space.
1.2. The World Bank’s “Light Every Night” dataset
Currently, this tutorial focuses on nighttime lights datasets that are available publicly (via the Google Earth Engine data catalogue); however, the “Light Every Night” (LEN) data archive is going to be launched soon.
The World Bank’s Light Every Night data set is a complete archive of all nighttime imagery captured each night over the last three decades. The underlying data is sourced from the NOAA/NCEI archive. The two sensors featured are the DMSP-OLS with data from 1992-2017, and the VIIRS-DNB with data spanning 2012-2020. The World Bank worked in collaboration with NOAA/NCEI and the University of Michigan to publish the archive as an Analysis Ready Data Set. The LEN archive, which now spans nearly 250 terabytes, will be openly available on the AWS open data program published under the World Bank’s open data license.
1.2.1. Components of the LEN archive
DMSP-OLS nightly imagery (1993-2017, all nights):
visible (VIS)
thermal infrared (TIR)
lunar illuminance (LI)
cloud mask (CM)
sample position (SAM)
stray light mask (SLM)
VIIRS DNB nightly imagery (2012-2020, all nights):
DNB radiance
I5 (LWIR) radiance
lunar illuminance
sample position within DNB scan
quality bitflag or “vflag” grid with on/off states for these fields:
daytime/nighttime/near-terminator
zero lunar illuminance
viirs cloud mask
nightfire detection
lightning
high energy particle hit
stray light affected/corrected
1.2.2. Data that is “analysis ready”
The data architecture was designed from the ground up to be analysis-ready. The data is published in the Cloud Optimized GeoTIFF format (COG), and organized using the SpatialTemporal Asset Catalog (STAC) standard. These standards are part of the growing Analysis Ready Data ecosystem that is improving access to geospatial data sets, enabling broader audiences to readily discover, process and analyze geospatial data.
Analysis ready data has already undergone the transformations and preprocessing necessary to make data (in this case observations of electromagnetic energy collected in space!) organized and coherent for general technical users and analysts.
1.2.3. Data access and tutorials
This archive will be made available very shortly and soon thereafter, we will add more content to these modules about how to access and use this data.
1.3. References:
- Jos14
Julianna Joseph. Vector and Raster Data Model Images. 2014. URL: http://www.newdesignfile.com/post_vector-and-raster-data-model_15523/.