1. Introduction to remote sensing (20 min)
1.1. What is remote sensing?
This can be accomplished through many devices that carry sensors and capture the characteristics of Earth remotely.
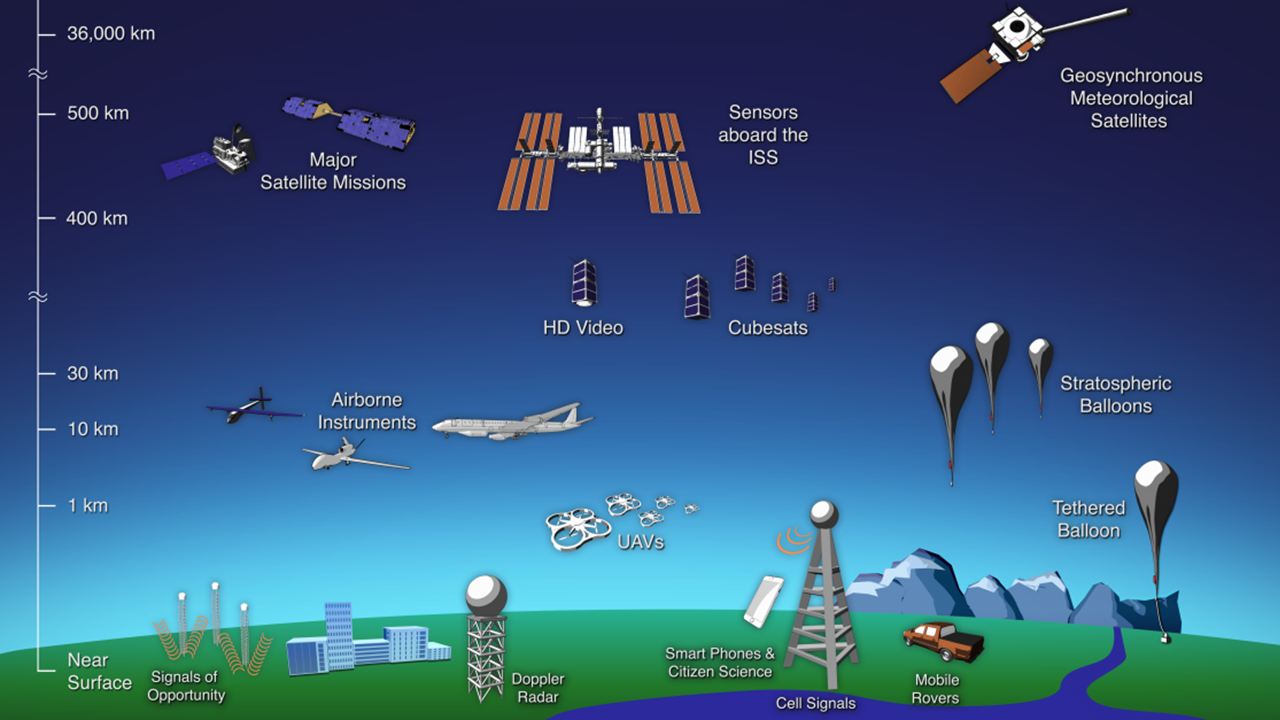
Sensors on board satellites also record the electromagnetic energy that is reflected or emitted from objects on Earth.
1.1.1. Passive and Active Sensors
Sensors on board satellites can be classified into two main categories: Passive and Active.
1.1.1.1. Passive remote sensing
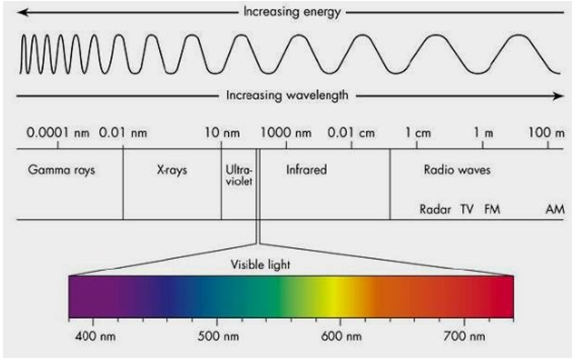
The energy of the sun is composed of many kinds of radiation, some of which spans the visible part of the electromagnetic spectrum. Many instruments collect Red, Green, and Blue bands of the spectrum (R,G,B) to create natural color images.
Meaningful information is also contained in parts of the spectrum outside the range of human vision, including infrared (IR) and ulta-violet (UV).
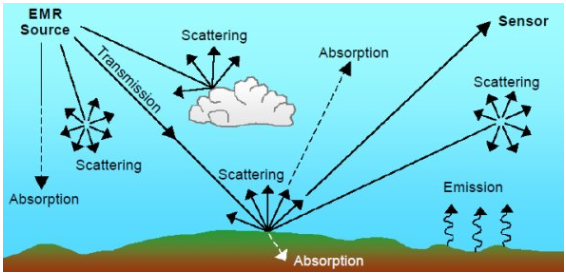
The energy of the sun is absorbed or scattered by the atmosphere before it reaches earth.
In Remote Sensing analysis we aim to learn about objects on Earth through studying the radiation reflected and/or emitted by them.
1.2. Spatial, spectral and temporal resolutions in remote sensing
Remote sensing instruments are characterized by different resolutions which will impact the decision as to which data to use and for which application (this is often referred to as “Fit-for-Purpose” technologies).
1.2.1. Spatial resolution
For example, dirt roads in Figures 1.4 are smaller than the 30 m Landsat pixels, but are still detected.
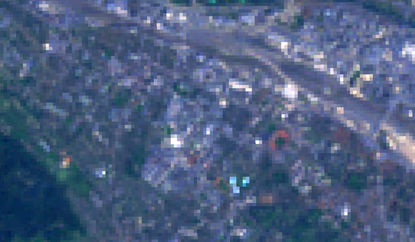
Fig. 1.4 Landsat-7 (30 m)
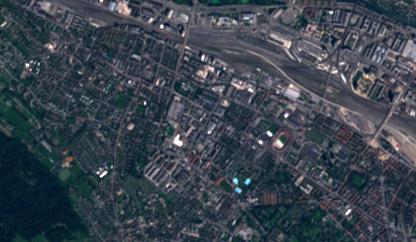
Fig. 1.5 Sentinel-2 (10 m)
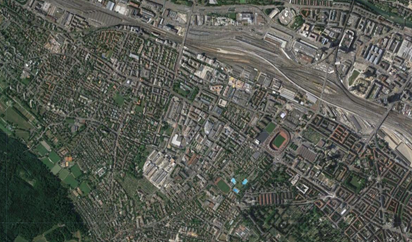
Fig. 1.6 Worldview (50 cm)
In this course: we will be working primarily with VIIRS-DNB and DMSP-OLS VNIR band data. Their spatial resolutions are approximately 750m and 2.7km , respectively.
1.2.2. Spectral resolution
Typically, multispectral imagery refers to 3 to 10 bands, while hyperspectral imagery consists of hundreds or thousands of (narrower) bands (i.e. higher spectral resolution) (see Figure 1.7). Panchromatic is a single broad band that collects a wide range of wavelengths.
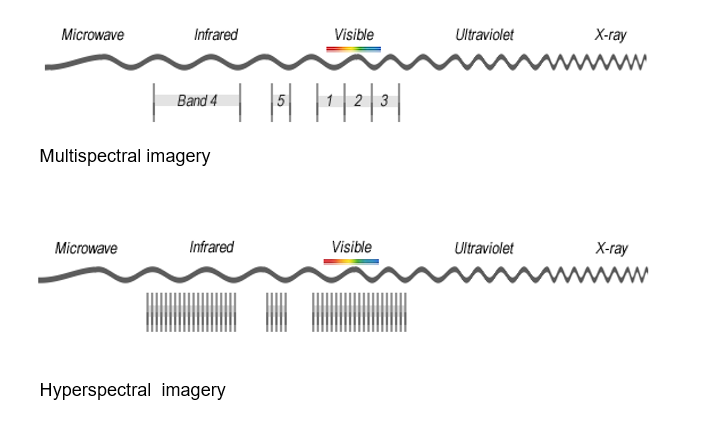
In this course: we will be working with VIIRS-DNB and DMSP-OLS data, which have single panchromatic channels covering the wavelengths ranging from 500 to 900 nanometers.
1.2.3. Temporal resolution
Generally speaking, the larger the swath width of a polar orbiting satellite, which you can think of as the width of the sensor’s field of view “cross-track” (or “left to right”) during an orbital pass , the higher the temporal resolution. This is because more of the earth is imaged in a single pass of the satellite.
1.2.4. Trade-offs in remote sensing resolution:
There is an inherent tradeoff between spatial, spectral and temporal resolutions. Typically, the higher the spatial resolution, the lower the spectral and the temporal resolution and the higher the temporal resolution, the lower the spatial and spectral resolutions (Figure 1.8).
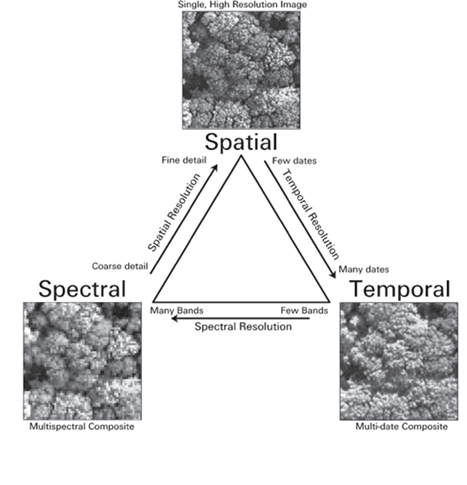
Fig. 1.8 Trade-offs with spatial, spectral, and temporal resolution. The figure illustrates some of the tradeoffs in remotely sensed data. For example, sensors that collect images in a high spatial resolution, will typically have lower spectral (less bands) and low temporal (less frequent re-visit) resolutions. On the other hand, the spatial and spectral resolution of sensors with a high temporal resolution (frequent revisit) will typically be lower than sensors that collect data in a low temporal resolution (less frequent revisit).
Source: [WNF09]
In this course: we will be using VIIRS-DNB and DMSP-OLS data. Both of these sensors image the same earth location at least once during the day and once during the night. We’re only interested in the nighttime pass, so our data can be considered to have a daily temporal resolution. However, as we will learn, it’s helpful to temporally aggregate data to account for noise or obstructions, such as cloud-cover, so our final analysis may end up using composite data that has time periods of up to a month or year.
1.3. Applications of remotely-sensed derived data in socio-economic research
Remotely sensed observations are useful for a wide-range of economic research applications. Donaldson and Storeygard [DS16] outline some advantages of using remotely sensed data for economic studies:
1. Improved accessibility to information difficult to obtain by other means:
Remote sensing technologies can collect panel data at low marginal cost, repeatedly, and at large scale, providing proxies for a wide range of characteristics that are hard (or impossible) to measure by other means.
2. High(er) spatial resolution:
Remotely sensed data are typically available at a higher spatial resolution than other traditional data sources, for example, census data (which is available at the geographical unit of the census tract, the block group etc.). Publicly available satellite imagery used by economists provide measurements of every location on Earth and are not constrained to a specific scale in which the data was collected at or aggregated to.
3. Wide geographic coverage and high temporal resolution:
Data collected by satellites provide continuous and consistent observations of phenomena on Earth, regardless of the conditions on the ground (e.g. political strife or natural disasters), across borders, including inaccessible locations and with a uniform spatial sampling. Satellites have substantial temporal coverage, capturing every location on Earth on a daily or weekly basis. Some archives date back to the 1970s.
Nighttime lights are especially useful for a variety of socio-economic research and applications. There is a strong correlation between nighttime lights and Gross State Product (GSP) or Gross Domestic Product (GDP) measures, at the national, state and regional levels [HSW12][GLPDE+10][CN11] or even at a more granular resolution. Thus, nighttime light observations can be used as a proxy for economic activity, especially over periods or regions where these data are not available or where the statistical systems are of low quality or when no recent population or economic censuses are available. Similarly, changes in nighttime light intensity can be used by economists as an additional measure of income growth when no other measures of income growth are available.
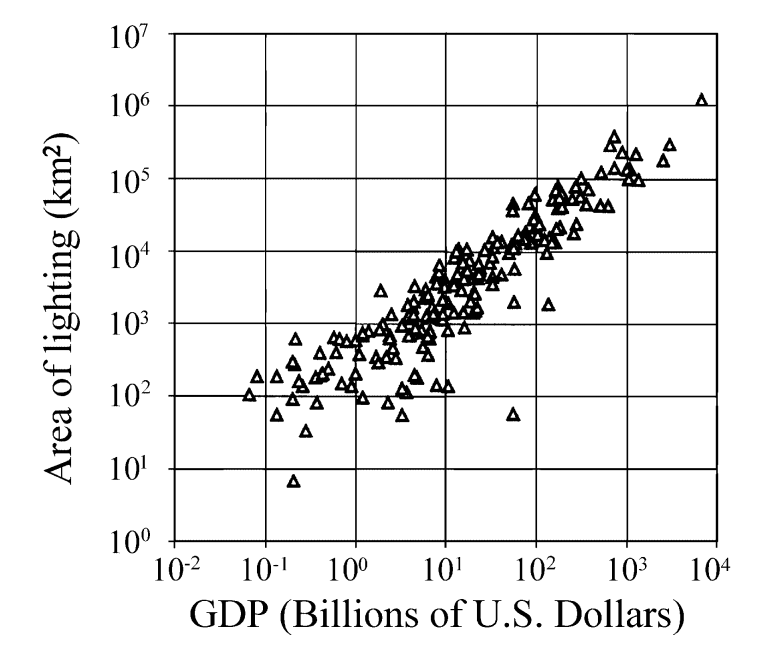
Fig. 1.9 Area of lighting versus GDP for 200 countries of the world. (from Elvidge et al., 2001) [EIB+01]
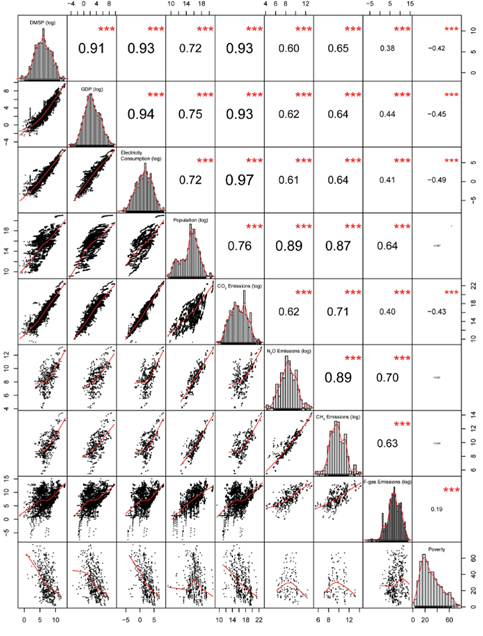
Comparing nighttime lights and a series of socio-economic indicators: Proville et al. (2017) [PZAW17] examined trends observed by DMSP-OLS in the period 1992-2013 and their correlation with a series of socio-economic indicators. Fig. 1.10 They found the strongest correlations between nighttime lights, electricity consumption, CO2 emissions, and GDP, followed by population, CH4 emissions, N2O emissions, poverty and F-gas emissions.
Natural characteristics of Earth and nighttime lights: Henderson et al. (2018) [HSSW18] explored whether - and which - of the natural characteristics of Earth can explain the spatial distribution of economic activity worldwide, at least according to nighttime lights. The authors found that 24 physical geographic attributes can explain up to 47% of worldwide variation and up to 35% of the variation of lights within countries.
Among countries that developed early, agricultural variables incrementally explain over 6 times as much variation in lights as do trade variables. On the other hand, among late developing countries, the same ratio is only about 1.5, despite the fact that these countries are far more dependent on agriculture.
1.4. Summary
Remote sensing instruments collect electromagnetic energy to map a variety of phenomena on the earth’s surface. These instruments typically trade between three categories of performance: spatial, spectral, and temporal. Remotely sensed imagery can reach all parts of the earth at a consistent resolution, and some archives span decades into the past. For this work we will focus on nighttime lights from the VIIRS-DNB and DMSP-OLS sensors. There is a long and significant body of research showing correlation between nighttime lights and a variety of useful socio-economic variables.
1.5. References:
- Cen17
NASA’s Goddard Space Flight Center. Remotely Sensing Our Planet. 2017. URL: https://svs.gsfc.nasa.gov/30892.
- CN11
Xi Chen and William D Nordhaus. Using luminosity data as a proxy for economic statistics. Proceedings of the National Academy of Sciences, 108(21):8589–8594, 2011.
- Dan15
Saba Daneshgar. Remote sensing observations for monitoring coastal zones, Volturno River mouth case study. PhD thesis, Ghent University, 04 2015. doi:10.13140/RG.2.1.3806.9209.
- DS16
Dave Donaldson and Adam Storeygard. The view from above: applications of satellite data in economics. Journal of Economic Perspectives, 30(4):171–98, 2016.
- EIB+01
Christopher D Elvidge, Marc L Imhoff, Kimberly E Baugh, Vinita Ruth Hobson, Ingrid Nelson, Jeff Safran, John B Dietz, and Benjamin T Tuttle. Night-time lights of the world: 1994–1995. ISPRS Journal of Photogrammetry and Remote Sensing, 56(2):81–99, 2001.
- Geo
GIS Geography. Multispectral vs Hyperspectral Imagery Explained - GIS Geography. URL: https://gisgeography.com/multispectral-vs-hyperspectral-imagery-explained/.
- GLPDE+10
Tilottama Ghosh, Rebecca L Powell, Christopher D Elvidge, Kimberly E Baugh, Paul C Sutton, and Sharolyn Anderson. Shedding light on the global distribution of economic activity. The Open Geography Journal, 2010.
- HSSW18
J Vernon Henderson, Tim Squires, Adam Storeygard, and David Weil. The global distribution of economic activity: nature, history, and the role of trade. The Quarterly Journal of Economics, 133(1):357–406, 2018.
- HSW12
J Vernon Henderson, Adam Storeygard, and David N Weil. Measuring economic growth from outer space. American economic review, 102(2):994–1028, 2012.
- HSJ17
Mallikarjun. G. Hudedmani, Vishwanath.M Soppimath, and Chaitanya. K. Jambotkar. A study of materials for solar pv technology and challenges. In A Study of Materials for Solar PV Technology and Challenges. 2017.
- PZAW17(1,2)
Jeremy Proville, Daniel Zavala-Araiza, and Gernot Wagner. Night-time lights: a global, long term look at links to socio-economic trends. PloS one, 12(3):e0174610, 2017.
- WNF09
Timothy A Warner, M Duane Nellis, and Giles M Foody. Remote sensing scale and data selection issues. The SAGE handbook of remote sensing, 2:568, 2009.