2. Introduction to nighttime light data (20 min)
2.1. Remotely sensed data of nighttime lights
Low-light imaging of the Earth from space has been a capability since the mid-1960s with sensors onboard the Defense Meteorological Satellite Program (DMSP) satellite platforms. DMSP is a United States Air Force series of polar-orbiting satellites with sensors onboard that were originally designed to observe weather-related indicators at day and night, in the visible and infrared wavelength ranges. In 1973, Croft [Cro73] first reported that information collected with the DMSP Operational Linescan System’s (DMSP-OLS) Visible and Near-Infrared (VNIR) band was able to capture various sources of low-light emissions from Earth. These include sources that indicate aspects of human activity, like city lights, gas flares, fishing boats, and agricultural fires, while also capturing other nighttime lights phenomena such as auroras (Figure 2.1). While the DMSP series still has satellites orbiting and collecting nighttime data, the program will end when the current satellites reach their end of life.
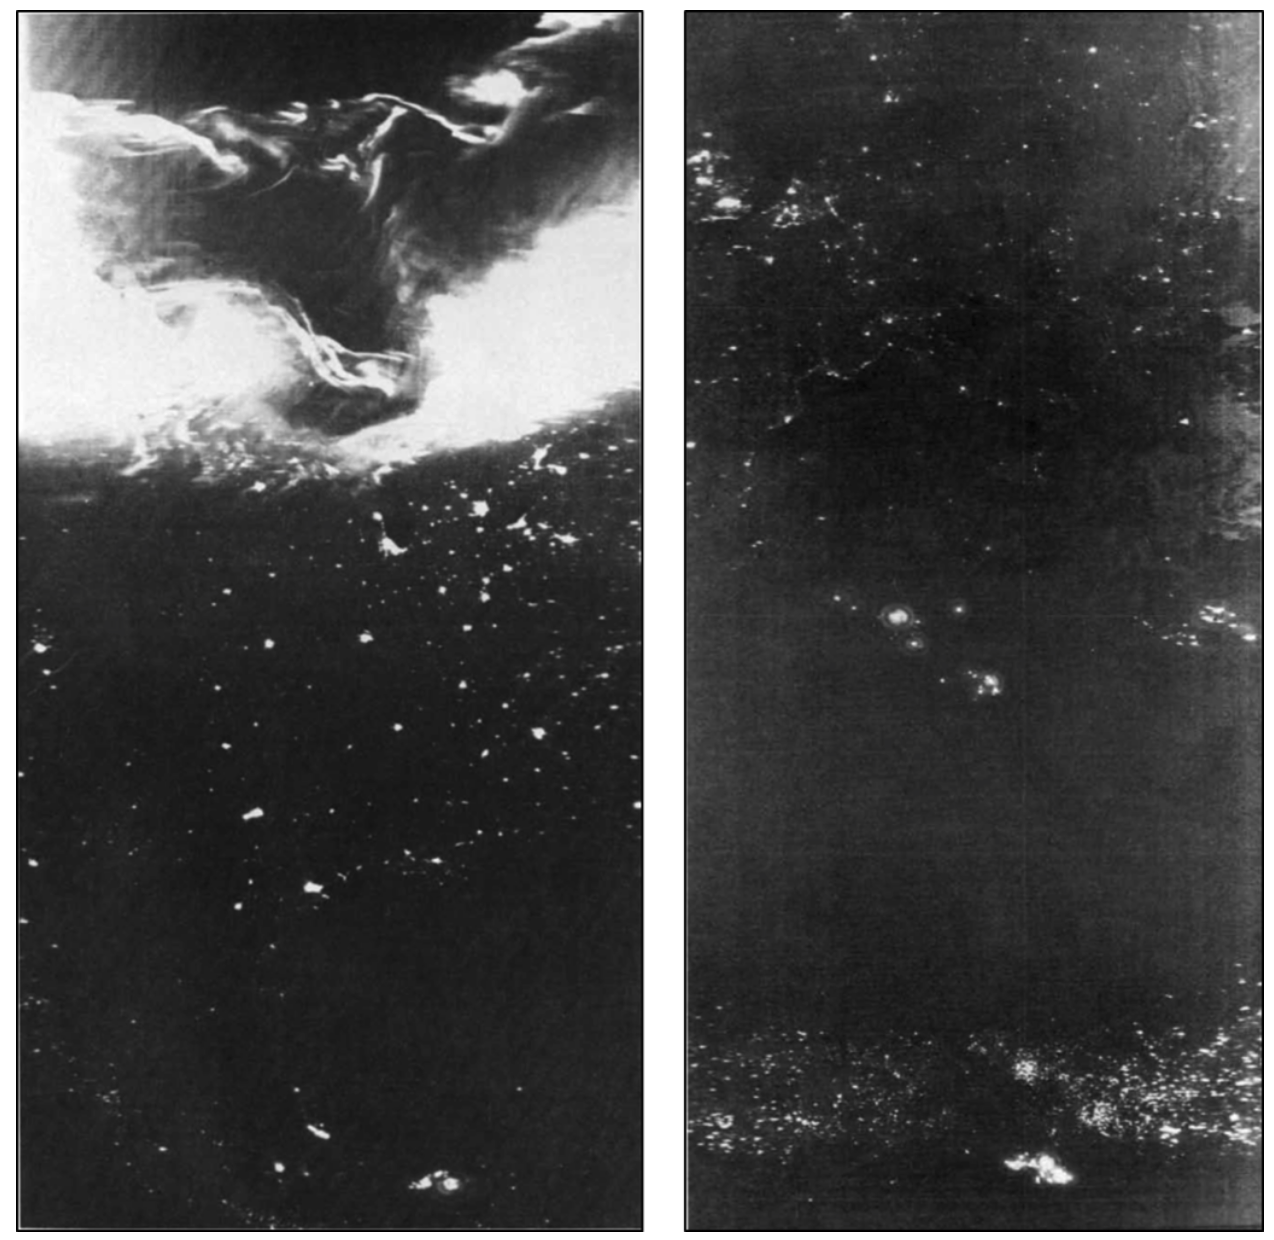
Fig. 2.1 These two panels show some of the earliest published imagery from single orbits of the DMSP-OLS VNIR band. The left panel is from April 18, 1974. In addition to city lights of the central part of the United States and Mexico, it shows a beautiful example of aurora over Canada. The right panel is an orbit displaying the city lights of Europe and Asia down to central Africa. The band of lights across the lower part of the image are from agricultural fires in Africa. Lights from gas flaring activity in Africa show as a cluster of the bright lights in the lower center of the swath (Nigerian offshore flares), and in the center of the image (Algeria and Libya). [Cro78]
The follow-on sensor to the DMSP-OLS was first launched in late 2011 onboard the Suomi National Polar-orbiting Partnership (S-NPP) satellite. This new low-light imaging sensor is part of the Visible Infrared Imaging Radiometer Suite (VIIRS) and is called the Day/Night Band (DNB). While similar to the DMSP-OLS in many ways, the VIIRS-DNB offers a dramatic improvement to nighttime lights imaging from its predecessor [EBZH13].
The S-NPP satellite was intended as a transition satellite, combining requirements of the legacy satellites of two United States agencies, the National Oceanic and Atmospheric Administration (NOAA) and the National Aeronautics and Space Administration (NASA), into a new program called the Joint Polar Satellite System (JPSS). The first official JPSS satellite (JPSS-1) was launched in late 2017 and was renamed NOAA-20 after reaching orbit.
There are 3 other satellites planned to fill out the JPSS constellation: JPSS-2, JPSS-3, and JPSS-4, which have launch dates currently scheduled in 2022, 2026, and 2031 respectively. For the nighttime lights user community, this means access to a continuous record of VIIRS-DNB observations well into the 4th decade of this century (Figure 2.2).
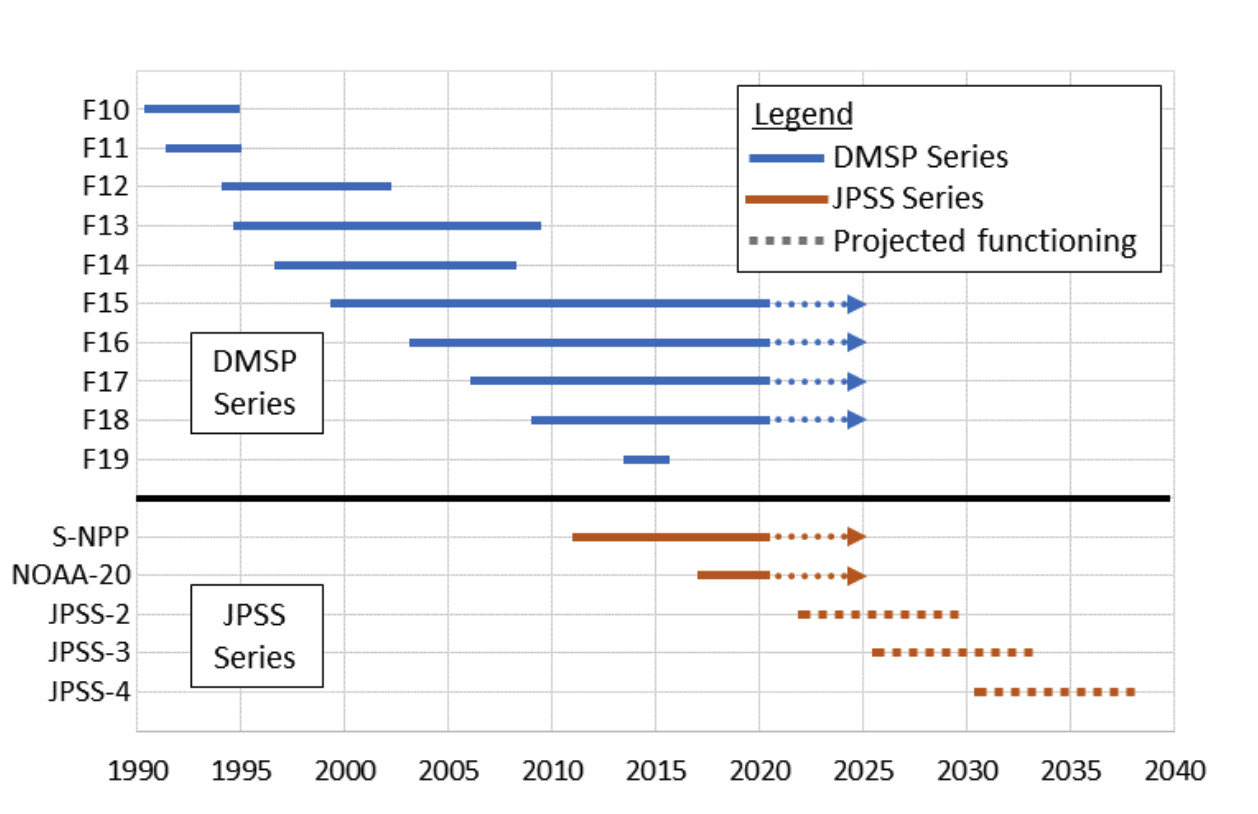
Fig. 2.2 Timeline showing past, present, and future satellites with low-light imaging capabilities starting with DMSP satellites in the digital archive at NOAA’s National Centers for Environmental Information (NCEI).
2.2. DMSP-OLS
While the first low-light imagery from DMSP dates to the mid-1960’s, it was not until 1992 that a digital archive was established for these data at NOAA’s National Centers for Environmental Information (NCEI) - formerly the National Geophysical Data Center (NGDC). Prior to the establishment of the digital archive at NOAA/NCEI, only a limited set of DMSP-OLS data were preserved and written to large format film. Some of the DMSP-OLS analog films have been digitally scanned for preservation and reside in the NOAA/NCEI archive.
While all DMSP satellites are sun-synchronous polar-orbiting platforms, their overpass times vary. Depending on the overpass time, the DMSP satellites can be categorized as either a “day/night” or a “dawn/dusk” satellite. The day/night satellites have one side of their orbits imaging the daytime side of the earth, and the other side imaging the nighttime side. Similarly, the dawn/dusk satellites image an early morning earth on one side of their orbits and an early evening on the other side.
Note: While the DMSP-OLS data from all the satellites contain some amount of nighttime data, the satellites in a day/night orbit have the highest quality nighttime data and are usually favored for nighttime lights use.
In 1992, when the creation of the digital archive began, there were two DMSP satellites collecting data, named F10 and F11. F10 was in a day/night orbit, and F11 was dawn/dusk. Since then, 8 other satellites have been launched, F12-F19, where F12, F14, F15, F16, and F18 were launched in day/night orbits. Unlike most modern satellites, the DMSP satellites had no ability to keep their orbit timing constant, therefore the overpass times do drift gradually and day/night satellites can become dawn/dusk (and vice versa). For these reasons, the set of DMSP-OLS with high quality nighttime data is a subset of the entire archive, with dates shown in Figure 2.3.
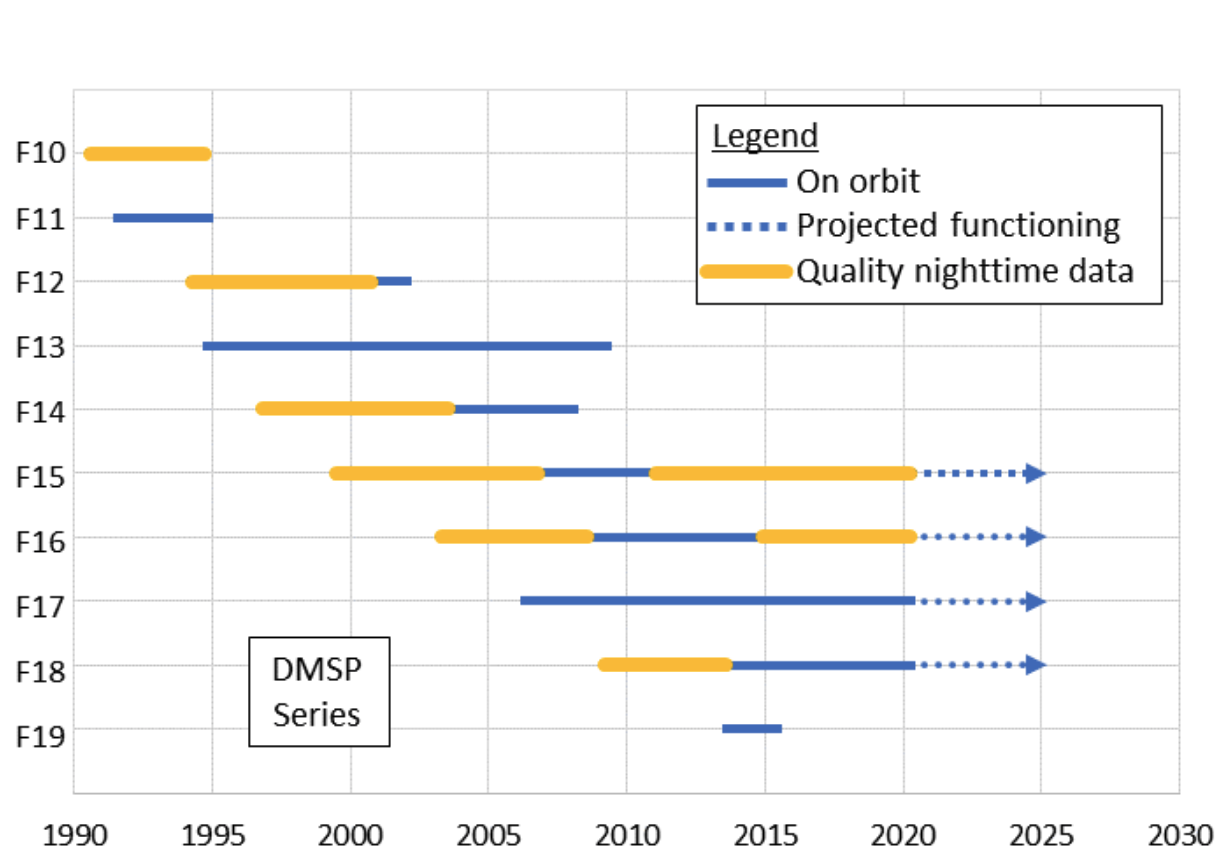
Fig. 2.3 Timeline showing availability of DMSP-OLS data in the digital archive at NOAA/NCEI, highlighting the time ranges when the satellite overpass time yielded high quality nighttime collections.
2.2.1. DMSP-OLS nighttime lights composites
The DMSP-OLS is an oscillating scan radiometer with 2 spectral bands, a Visible Near Infrared (VNIR) band that has low-light imaging capabilities, and a long-wave thermal infrared (TIR) band. The OLS VNIR band is often just called the “VIS” band in DMSP documentation, so let’s continue with that convention here. With 14 orbits per day, each day/night OLS is capable of generating global daytime and nighttime coverage of the Earth every 24 hours.
Instead of working with the DMSP-OLS nightly orbits directly, many researchers are using the global annual nighttime lights products (learning how to access and interpret data from individual orbits will be part of a later module). These global products were created by first using a series of filters on each OLS orbit to include only the data recorded under the sensor’s maximum gain setting, and then discard data identified as cloud, lightning, stray light, or aurora. The OLS data that passed through these filters were then orthorectified into 30 arc-second grids, composited into an annual product, and post-processed to remove ephemeral lights (e.g fires, fishing boats, some gas flares). The remaining data were then averaged and passed through a final algorithm to set background, or non-light values to zero [BEGZ10].
The set of annual global nighttime lights products were created at NGDC (now NCEI) in the Earth Observation Group (EOG). Some interesting history about these now widely used datasets is that they were never intended to be stand-alone products. In 1994, Dr. Chris Elvidge joined NGDC to lead a project using the DMSP-OLS data to monitor global fire activity. As fires and lights are indistinguishable in a single overpass of the OLS visible band, part of the project was to understand where lights were “stable” or consistently present, as would be the case in cities, industrial sites, some gas flares, and volcanoes. Then individual orbits could be mapped against that set of stable lights to produce a set of ephemeral lights, most of which would be fires [EKK+96].
Early on in this project, Dr. Elvidge found that the OLS “stable lights” datasets were more requested by the scientific community than the fire product, so they became a standard product in their own right. The DMSP-OLS global annual “stable lights” products were made consistently by the EOG group at NGDC using data from 1992-2013. The products by satellite and years available are shown in the table below.
In 2014 production of these products was discontinued. At this time the F18 satellite’s orbit had degraded from day/night into a dawn/dusk orbit and was not collecting enough nighttime data to make a global annual product. The EOG group switched efforts to working solely with the follow-on sensor to the DMSP-OLS, the VIIRS-DNB.
DMSP-OLS annual stable lights series
F10 |
F12 |
F14 |
F15 |
F16 |
F18 |
|
|---|---|---|---|---|---|---|
1992 |
F101992 |
|||||
1993 |
F101993 |
|||||
1994 |
F101994 |
F121994 |
||||
1995 |
F121995 |
|||||
1996 |
F121996 |
|||||
1997 |
F121997 |
F141997 |
||||
1998 |
F121998 |
F141998 |
||||
1999 |
F121999 |
F141999 |
||||
2000 |
F142000 |
F152000 |
||||
2001 |
F142001 |
F152001 |
||||
2002 |
F142002 |
F152002 |
||||
2003 |
F142003 |
F152003 |
||||
2004 |
F152004 |
F162004 |
||||
2005 |
F152005 |
F162005 |
||||
2006 |
F152006 |
F162006 |
||||
2007 |
F152007 |
F162007 |
||||
2008 |
F162008 |
|||||
2009 |
F162009 |
|||||
2010 |
F182010 |
|||||
2011 |
F182011 |
|||||
2012 |
F182012 |
|||||
2013 |
F182013 |
In June of 2019, Dr. Elvidge retired from NOAA and started doing research in the academic sector at the Payne Institute of Public Policy at the Colorado School of Mines (CSM). He founded an Earth Observation Group (EOG) under the Payne Institute and this group continues to do research and product generation with nighttime lights. The DMSP archive for the individual orbits remains at NOAA/NCEI. Of interest with the DMSP-OLS sensors is that two of the older satellites, F15 and F16, which started their life as day/night satellites and slowly became dawn/dusk satellites, have remained operational long enough to go full cycle and become day/night satellites again.
The EOG under the Payne Institute has plans to generate additional “stable lights” products using these data which will provide a few more years for the DMSP-OLS stable lights series. These additional years of nighttime OLS data overlap the VIIRS-DNB, providing a unique opportunity for researchers interested in cross comparison to create a consistent record of nighttime lights back to 1992.
NOAA’s National Centers for Environmental Information
And thanks to a partnership with NOAA, World Bank, University of Michigan, New Light Technologies and Amazon Web Services (AWS), a public archive will soon be available on AWS.
NOAA’s National Centers for Environmental Information
2.2.2. Limitations and challenges of DMSP-OLS
While advanced for its time, the OLS is now old technology and has been essentially unchanged since 1976 with the start of the Block 5D series of DMSP satellites. The OLS VIS, the low-light imaging band, has only 6-bit quantization (its digital values range from 0-63). In addition, the OLS VIS band has no on-board calibration, so these 64 values are only relative values based on the gain in which the data were recorded.
The gain of the instrument, which is a multiplier on the signal (analogous to a volume setting), is adjusted on-the-fly onboard the satellite via an algorithm that takes into account the amount of expected moonlight and sunlight for the time and location. The dynamic gain adjustment of the OLS allows the VIS sensor to produce meaningful imagery under a wide range of conditions, from full sunlight during the day to a dark night with the moon below the horizon. The OLS gain states are not recorded in the global OLS data that is relayed back to the ground stations, making any downstream calibration difficult to achieve.
Another limitation of the OLS is its very large spatial resolution. During the day, the OLS VIS band has a 2.7km spatial resolution, but at night things get more complicated. When imaging the nighttime earth, the OLS VIS band is sensitive to a larger instantaneous field of view (IFOV) than during the day. The IFOV for the OLS VIS at night is ~4.9km, but then the OLS still does the same sampling scheme as during the day, producing pixels that are 2.7km apart. So during the nighttime collections, the OLS VIS only achieves a spatial resolution of ~4.9km, but has a 2.7km ground sample distance (GSD).
When creating the DMSP-OLS stable lights series, only imagery from nights with no moonlight present was included. Under no moonlight conditions, the dynamic gain algorithm sets the VIS gain to its maximum value. Using only these data gave some assurance that the gain was constant (albeit unknown) and that it was reasonable to temporally average these VIS band values. The high gain setting also meant that dimmer lights could be detected in the composites. The downside is that when the gain is set to its maximum value, the VIS band, with its 6-bit radiometric resolution, saturates over bright urban centers. This means all values have the maximum value of 63 leaving the variability within urban cores unresolvable (Figure 2.4).
To summarize, the DMSP-OLS sensor limitations described above are:
Low radiometric resolution (6-bit data, values range from 0-63)
No on-board calibration
Large spatial resolution (4.9km for nighttime VIS band)
Saturation in urban cores
These limitations can lead to challenges for scientists using these data for their work. For example, drawing conclusions from the DMSP-OLS stable lights series may be challenging in low-density urban areas [ZS13]. The DMSP-OLS stable lights series tends to exaggerate the extent of urban areas [HYG+03][SPE05], while overlooking small or developing settlements.
In addition, the extent and intensity of lit areas cannot directly delimit urban regions due to the “blooming” effect [ILE+97] and “saturation” of pixels [HBG+15].
Blooming results in from three primary phenomena:
- the relatively coarse spatial resolution of the OLS sensor and the detection of diffuse and scattered light over areas containing no light source,
- large overlap in the footprints of adjacent OLS pixels, and
- the accumulation of geolocation errors in the compositing process.
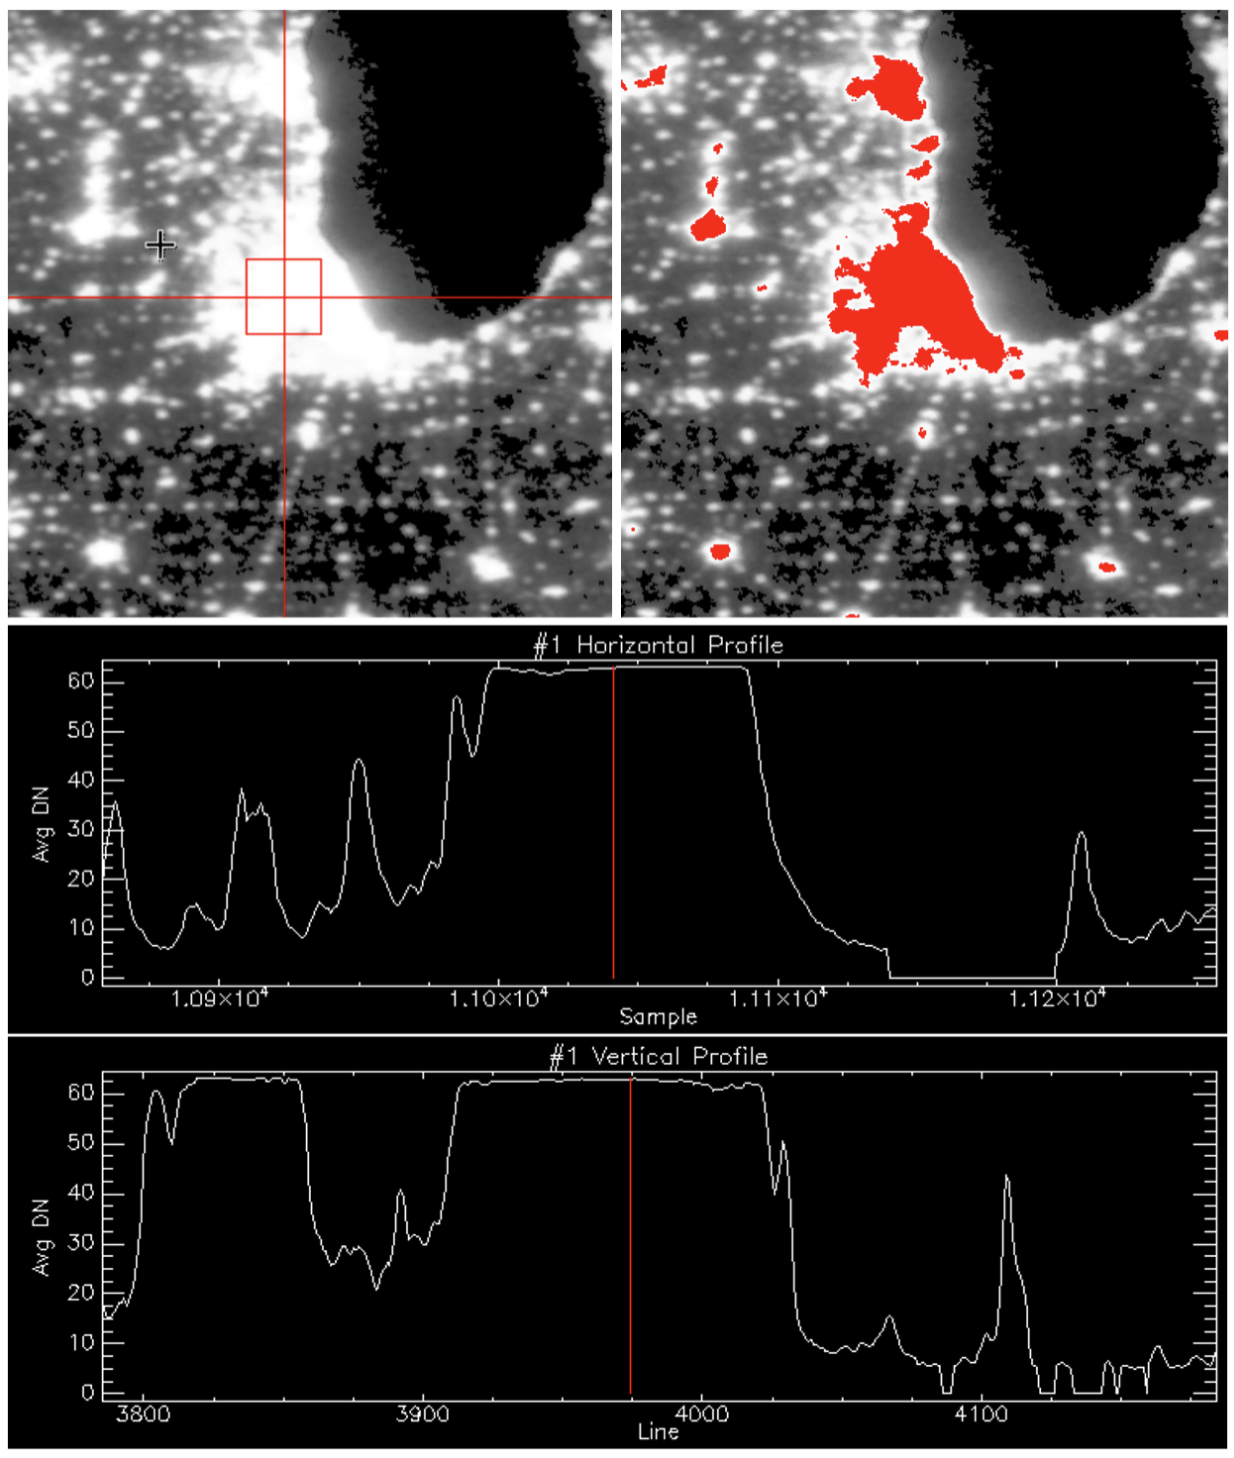
Fig. 2.4 A subset of the F18 2013 stable lights composite over Chicago and surrounding communities illustrates the effect that saturation in the DMSP-OLS VIS band has on the information content in urban centers. The upper left image is a grayscale image where the horizontal and vertical red lines are the locations for the profile data plotted in the two charts. The upper right image is the same subset, but with saturated values colored red. Notice that most of the Chicago metropolitan area is saturated so no further detail is available using these data. The two charts are plots of transects through the image, showing the average DN value in the composite along horizontal and vertical tracks through Chicago. While there is variation in average DN values across the smaller towns, the larger urban cores are saturated.
Another obstacle researchers face in using the DMSP-OLS data is the absence of on-board calibration. The DMSP-OLS annual stable lights series, derived from multiple OLS sensors (F10–F18) and different years (1992–2013) are not comparable directly without an inter-calibration. [Dol08]
Lack of on-board calibration. Due to the absence of on-board calibration, the DMSP/OLS stable NTL annual composites product derived from multiple sensors (F12–F16) and different years (1992–2013) are not comparable directly.
2.2.3. Addressing the lack of onboard calibration in the DMSP-OLS annual stable lights series: the need for inter-calibration
Generally speaking, DMSP-OLS “raw” composites cannot be used “as-is” when doing temporal analyses. Due to the lack of calibration, the OLS DN values are only relative. As described previously, when generating the stable lights series, only data collected with maximum gain settings were used. For a short time period with the same satellite sensor one can be reasonably assured that DNs are comparable to each other. In other words, it is likely that a DN of 10 from a no-moonlight orbit is comparable to a DN of 10 in a no-moonlight orbit a week later. However, sensor performance does change over time, and different OLS sensors will have sensitivity differences as well. This results in both temporal instability within a sensor and deviations between sensors, even in the same year. In order to compare the OLS stable lights series through time, the data must be inter-calibrated.
One of the most used frameworks for inter-calibration of DMSP-OLS annual composites was proposed by Elvidge et al. (2009) [EZB+09]. This procedure relies on a manual selection of (1) Pseudo-Invariant Features (PIF), (2) a reference satellite-year for calibration, and (3) a quadratic regression model. The model adjusts the DN values of pixels for each satellite-year to the reference satellite-year. Elvidge et al. chose the annual composite from the F12 satellite in 1999 (i.e. F121999) as the reference for calibration (in other words, all other satellite years were adjusted to match the F121999 data). Sicily, Italy, was selected as the region for calibration (or as the PIF). PIFs are essentially areas where nighttime light emission is expected to be relatively stable over time and where we would not expect to see much variation between satellites and years.
Additional studies have proposed different types of regression models, PIFs, and reference satellites to perform the intercalibration procedure. One of the modules in this course will walk through the procedure for applying the intercalibration coefficients proposed by Elvidge et al. [EBS+11]
One use-case of the “avg_lights_x_pct” layer of the DMSP-OLS annual composites has been to quantify gas flaring on a country basis (2009) [EZB+09]. Figure 2.5 shows estimated gas flaring in billions of cubic meters (BCM) for the country of Algeria with and without intercalibration. Before intercalibration, the annual estimates for different satellites are very different and the trend over time is not clear (meaning that we cannot do temporal analysis with this uncalibrated data). After intercalibration, the annual estimates in the same year for different satellites have converged and the decreasing trend over time is evident.
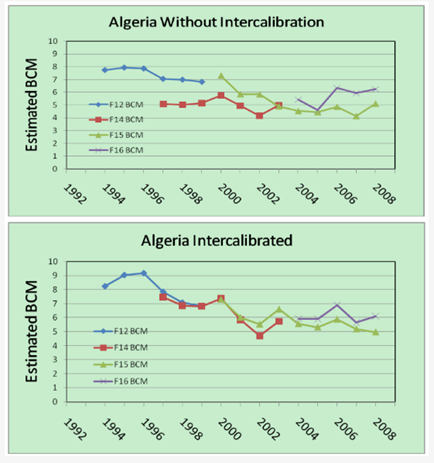
Fig. 2.5 The need for intercalibration when analyzing trends using the DMSP-OLS stable lights composites is apparent in these two charts. The top chart shows derived estimates of gas flares prior to applying an intercalibration. The bottom chart shows these same estimates after applying an intercalibration. [EZB+09]
2.3. VIIRS-DNB: the follow-on sensor for the DMSP-OLS
Many aspects of the VIIRS-DNB sensors are identical to the DMSP-OLS. LIke the OLS, the DNB are scanning radiometers capable of low-light imaging and are launched onboard sun-synchronous polar-orbiting platforms. They both collect 14 orbits per day, imaging the daytime and nighttime side of the earth every 24 hours. On the surface they may seem identical, but in fact almost everything about the DNB sensor itself is an improvement over the OLS.
The table below details a side-by-side comparison of the two sensors. As a companion visual, Fig. 2.7 shows a side-by-side comparison of DNB and OLS imagery from the same night.
Things to notice in the table are that all four of the limitations discussed in the previous section about the OLS sensor have been either eliminated or reduced in the VIIRS-DNB.
- The DNB sensors have a higher radiometric resolution (14-bit) and are capable of collecting at multiple gain settings simultaneously. These features eliminate the nighttime saturation in the DNB.
- The DNB has onboard calibration for the daytime data that is carried through to the nighttime side, yielding nighttime pixel values in radiance units.
- The spatial resolution of the DNB sensor is ~750m on a side, making the spatial area of the DNB footprint 44 times smaller than the OLS.
- The blooming effect of the OLS, as discussed earlier, is reduced in the DNB. However, blooming will still occur because of the coarse spatial resolution of the DNB sensor as compared to a lighting source, and the detection of diffuse and scattered light over areas containing no light source.
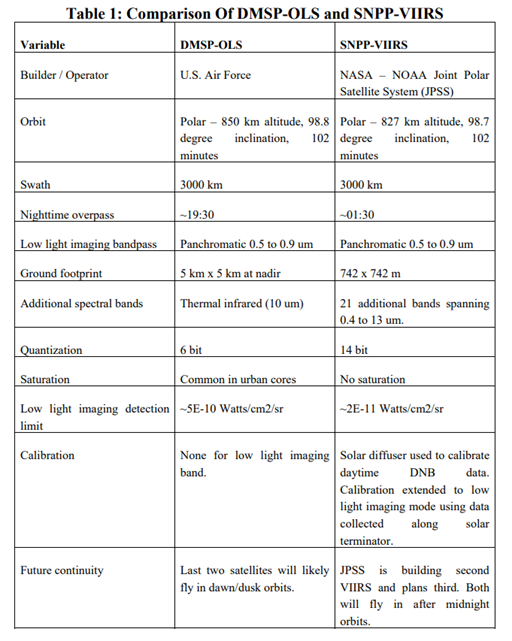
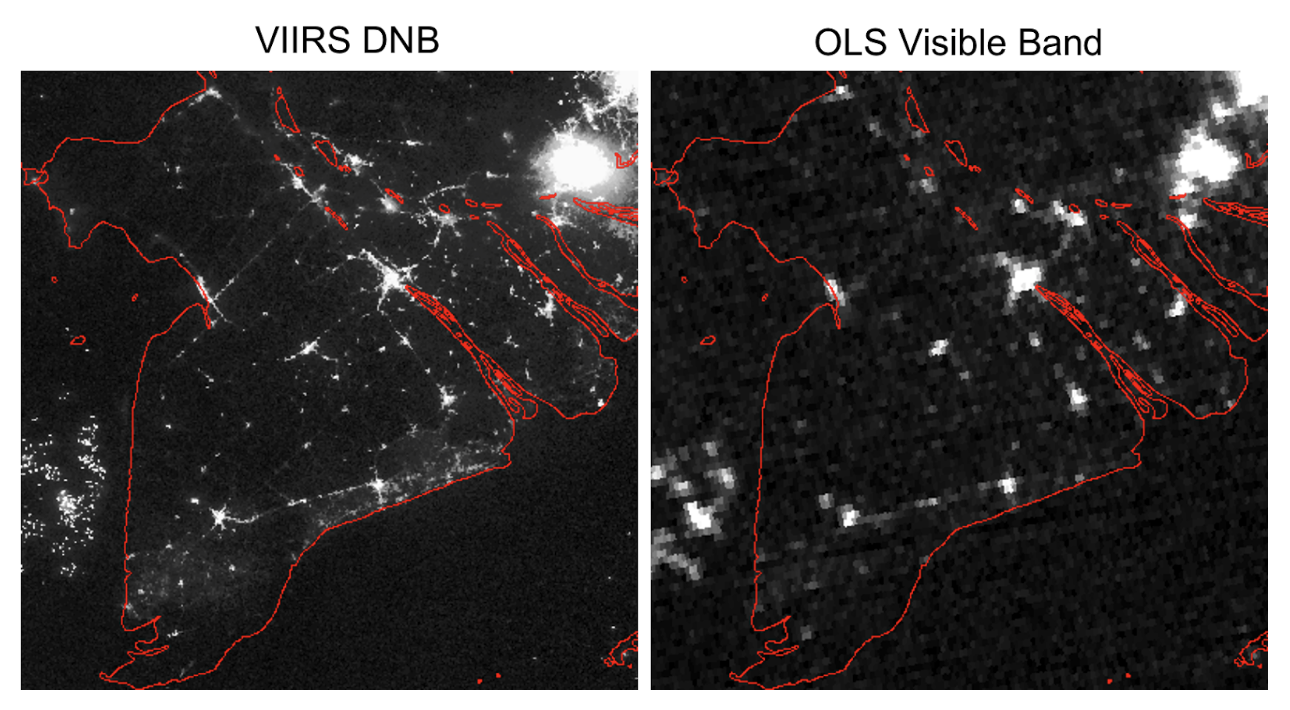
Fig. 2.7 These two images show the Mekong Delta region of Vietnam on November 23, 2014. Notice the finer spatial detail and increased sensitivity of the DNB image on the left as compared to the OLS on the right. [EBZH13]
2.3.1. VIIRS-DNB nighttime lights composite products
As with the DMSP-OLS data, many researchers have chosen to use temporally composited products for their work instead of utilizing the VIIRS-DNB nightly orbits directly (learning how to access and interpret DNB data from individual nights will be part of a later training module). Although the algorithms themselves differ, the basic procedure for generating the DNB nighttime lights composites is the same as described in section 2.2.1 for the OLS sensor [BHEZ13]. This work began within the EOG group at NOAA/NCEI and transitioned to the CSM’s Payne Institute for Public Policy at the end of 2019.
Besides the quality of the input data themselves, the main differences in the composite products are that, for the DNB, the input orbits are orthorectified into 15-arc second grids (instead of 30 for the OLS), and that monthly intermediate products are posted for public access.
These monthly products have not been filtered for ephemeral lights (fires, aurora, fishing boats, etc), and have not had background (non-light) areas set to zero. Also, for cloudy equatorial regions, monthly compositing is not enough time to reliably accumulate cloud-free data coverage. Thus, the monthly VIIRS-DNB composites, as they are available today, are not as “analysis-ready” as the annual stable lights products. A limited set of annual stable lights from the VIIRS-DNB were completed for the years 2015 and 2016 while the EOG group was at NOAA/NCEI. These procedures were described by Elvidge et al. [EC+17]
To illustrate the improvement of the VIIRS-DNB sensor over the DMSP-OLS using composite products, let’s look again at the Chicago area, but this time with the 2016 VIIRS-DNB stable lights image. Figure 2.7 shows the DNB 2016 stable lights product cropped to the same area over Chicago that was shown in Figure 2.4 for the DMSP-OLS stable lights. The transects for the profiles in Figure 2.7 are in the same location as those in Figure 2.4. Recall that almost the entire Chicago metropolitan area suffered pixel saturation in the OLS, so no variation was discernible in the urban core. In the DNB composite, there is no saturation, and values that were capped at 63 DN in the OLS composites now vary between radiance values of approximately 25-280 nanowatts/cm2/sr in the DNB composite.
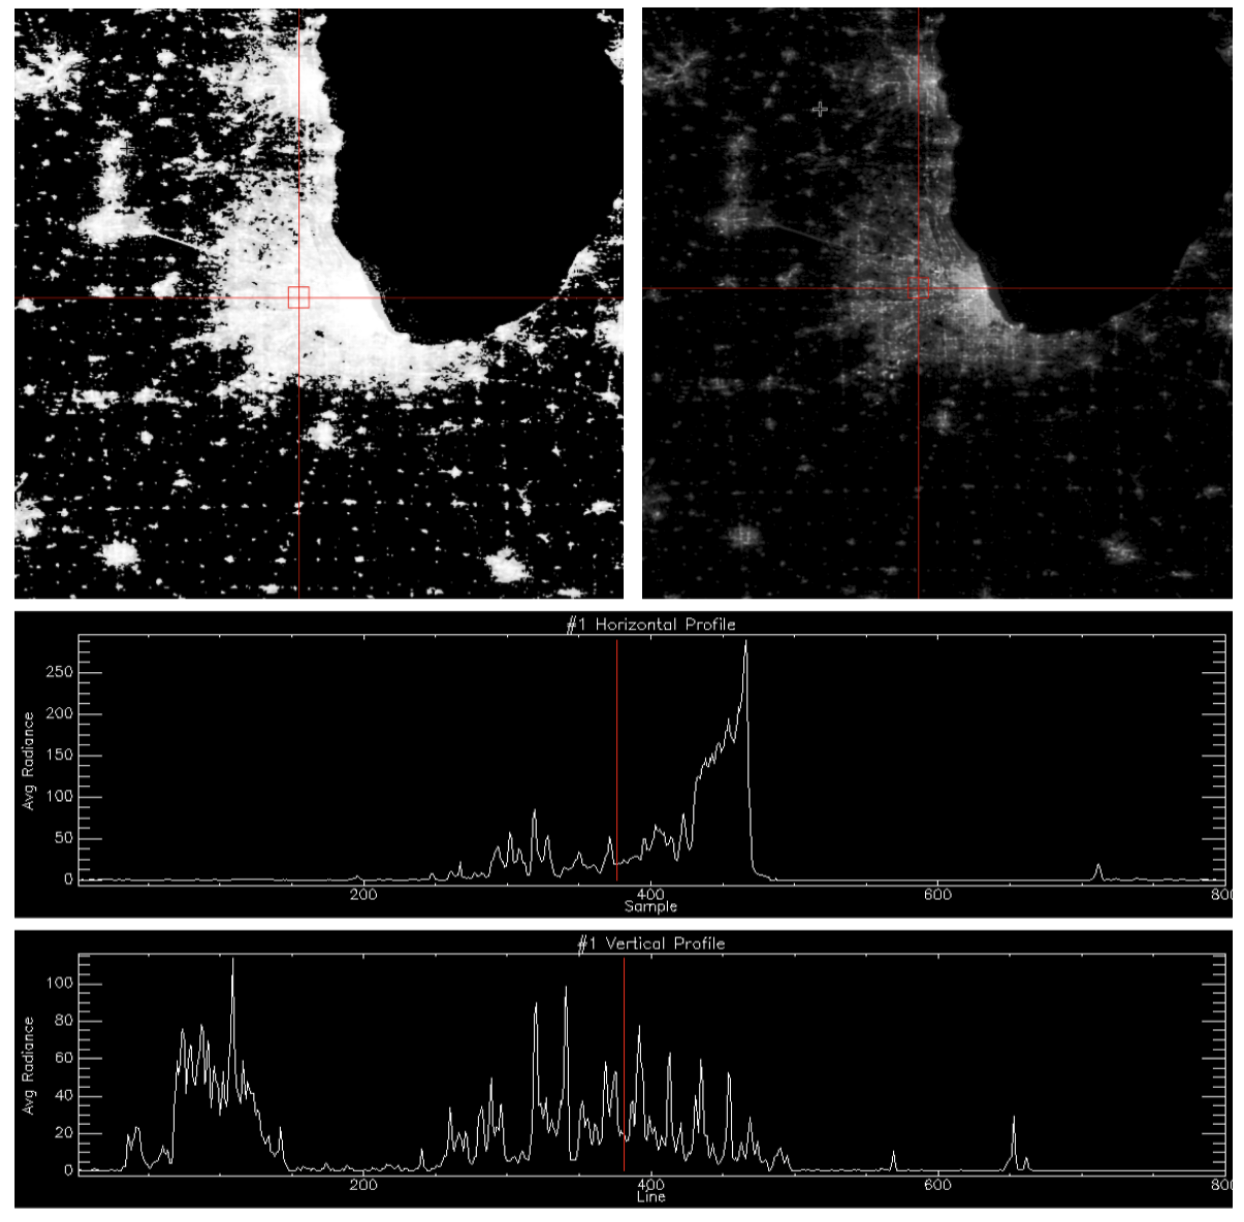
Fig. 2.8 A subset of the NPP VIIRS-DNB 2016 stable lights composite over Chicago and surrounding communities. This is the same region used for illustrating the concept of DMSP-OLS saturation in Figure 2.4. The horizontal and vertical red lines in the grayscale images are the locations for the profile data plotted in the two charts. The large dynamic range of the DNB makes it difficult to showcase with just one contrast stretch on the data, so two are shown. The upper left image has been enhanced to highlight the smaller towns and the upper right image has been enhanced to highlight the variation in the urban cores. Notice the variation in the horizontal transect across Chicago and in the vertical transect across Milwaukee that were previously capped in the OLS composite shown in Figure 2.4.
NOAA’s National Centers for Environmental Information
And thanks to a partnership with NOAA, World Bank, University of Michigan, New Light Technologies and Amazon Web Services (AWS), a public archive will soon be available on AWS.
2.3.2. Limitations and Challenges of the VIIRS-DNB
There are several limitations and challenges when using VIIRS-DNB:
- VIIRS-DNB is still a fairly new sensor and algorithms for turning the raw nightly data into meaningful products for the research community has not had time to fully develop. The EOG group at CSM continues to produce monthly composites using the DNB, but production of annual stable lights has yet to restart. NASA’s Black Marble suite of products, which are based on the DNB, had its first release in August 2020, and while there are plans to release composite products, only nightly products are currently available {cite}`roman2018nasa`.
- While the DNB is a much improved version of the OLS sensor, it was still designed to be a weather satellite, with the low-light imaging capability tailored for detection of moonlit clouds, not nighttime lights. There is only one panchromatic band, sensitive to wavelengths from the visible out into the near infrared (0.5-0.9 microns). This includes wavelengths beyond the human eye’s range of vision.
- The spatial resolution of the sensor at 742m is too large for many applications, like mapping of urban morphology and detection of very small human settlements.
2.4. References:
- BEGZ10
Kimberly Baugh, Christopher D Elvidge, Tilottama Ghosh, and Daniel Ziskin. Development of a 2009 stable lights product using dmsp-ols data. Proceedings of the Asia-Pacific Advanced Network, 30(0):114, 2010.
- BHEZ13
Kimberly Baugh, Feng-Chi Hsu, Christopher D Elvidge, and Mikhail Zhizhin. Nighttime lights compositing using the viirs day-night band: preliminary results. Proceedings of the Asia-Pacific Advanced Network, 35:70–86, 2013.
- Cro73
Thomas A Croft. Burning waste gas in oil fields. Nature, 245(5425):375–376, 1973.
- Cro78
Thomas A Croft. Nighttime images of the earth from space. Scientific American, 239(1):86–101, 1978.
- Dol08
Christopher NH Doll. Ciesin thematic guide to night-time light remote sensing and its applications. Center for International Earth Science Information Network of Columbia University, Palisades, NY, 2008.
- EBZH13(1,2,3)
Christopher D Elvidge, Kimberly E Baugh, Mikhail Zhizhin, and Feng-Chi Hsu. Why viirs data are superior to dmsp for mapping nighttime lights. Proceedings of the Asia-Pacific Advanced Network, 35(0):62, 2013.
- EC+17
Christopher D Elvidge, Feng Chi, and others. Viirs night-time lights. International journal of remote sensing, 2017.
- EKK+96
Christopher D Elvidge, Herbert W Kroehl, Eric A Kihn, Kimberly E Baugh, ER Davis, and Wei Min Hao. Algorithm for the retrieval of fire pixels from dmsp operational linescan system data. Biomass burning and global change: Remote sensing, modeling and inventory development, and biomass burning in Africa, 1:73–85, 1996.
- ESN+04(1,2)
Christopher D Elvidge, Jeffrey Safran, I Nelson, B Tuttle, V Ruth Hobson, Kimberly E Baugh, John B Dietz, Edward H Erwin, R Lunetta, and J Lyon. Area and positional accuracy of dmsp nighttime lights data. Remote sensing and GIS accuracy assessment, pages 281–292, 2004.
- EZB+09(1,2,3)
Christopher D Elvidge, Daniel Ziskin, Kimberly E Baugh, Benjamin T Tuttle, Tilottama Ghosh, Dee W Pack, Edward H Erwin, and Mikhail Zhizhin. A fifteen year record of global natural gas flaring derived from satellite data. Energies, 2(3):595–622, 2009.
- EBS+11
Christopher D. Elvidge, Kimberly E. Baugh, Paul C. Sutton, Budhendra Bhaduri, Benjamin T. Tuttle, Tilotamma Ghosh, Daniel Ziskin, and Edward H. Erwin. Who’s in the Dark—Satellite Based Estimates of Electrification Rates, chapter 15, pages 211–224. John Wiley & Sons, Ltd, 2011. URL: https://onlinelibrary.wiley.com/doi/abs/10.1002/9780470979563.ch15, arXiv:https://onlinelibrary.wiley.com/doi/pdf/10.1002/9780470979563.ch15, doi:https://doi.org/10.1002/9780470979563.ch15.
- HYG+03
Mark Henderson, Emily Ting Yeh, Peng Gong, Christopher Elvidge, and Kimberly Baugh. Validation of urban boundaries derived from global night-time satellite imagery. International Journal of Remote Sensing, 24(3):595–609, 2003.
- HBG+15(1,2)
Feng-Chi Hsu, Kimberly E Baugh, Tilottama Ghosh, Mikhail Zhizhin, and Christopher D Elvidge. Dmsp-ols radiance calibrated nighttime lights time series with intercalibration. Remote Sensing, 7(2):1855–1876, 2015.
- ILE+97
Marc L Imhoff, William T Lawrence, Christopher D Elvidge, Tera Paul, Elissa Levine, Maria V Privalsky, and Virginia Brown. Using nighttime dmsp/ols images of city lights to estimate the impact of urban land use on soil resources in the united states. Remote Sensing of Environment, 59(1):105–117, 1997.
- SPE05(1,2)
Christopher Small, Francesca Pozzi, and Christopher D Elvidge. Spatial analysis of global urban extent from dmsp-ols night lights. Remote Sensing of Environment, 96(3-4):277–291, 2005.
- ZS13
Qian Zhang and Karen C Seto. Can night-time light data identify typologies of urbanization? a global assessment of successes and failures. Remote Sensing, 5(7):3476–3494, 2013.