Population and Demographic Analysis Tutorial#
This Jupyter Notebook provides a step-by-step guide for analyzing population data and demographics within a user-defined Area of Interest (AOI). Using interactive widgets and map visualizations, you can:
Interactively Select an AOI: Draw or choose a polygon region directly on an interactive map widget.
Query Population Data: Fetch demographic data (e.g., total population, age, and gender distributions).
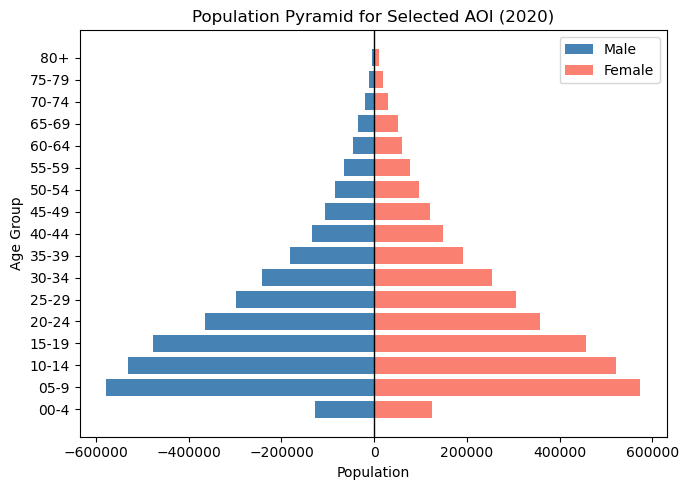
Visualize Demographics with Population Pyramids: Create age-gender pyramids to understand the demographic structure of the selected AOI, which can be especially valuable in high-conflict or vulnerable regions.
Map-Based Exploration: View spatial distributions of population data across hexagonal units to visualize which areas have higher population counts and how demographics vary spatially.
![]()
# !pip install space2stats_client geopandas ipyleaflet matplotlib
import requests
import pandas as pd
import geopandas as gpd
import matplotlib.pyplot as plt
from shapely.geometry import shape
import json
import ipywidgets as widgets
from space2stats_client.widgets import AOISelector
BASE_URL = "https://space2stats.ds.io/"
FIELDS_ENDPOINT = f"{BASE_URL}/fields"
SUMMARY_ENDPOINT = f"{BASE_URL}/summary"
aoi_selector = AOISelector(center=(4.0, 33.0), zoom=6)
aoi_selector.display()
aoi_geojson = aoi_selector.aoi.features[0]
# Define which fields to request. Here we select both male and female at specific age intervals
age_groups = ["00", "05", "10", "15", "20", "25", "30", "35", "40", "45", "50", "55", "60", "65", "70", "75", "80"]
female_fields = [f"sum_f_{a}_2025" for a in age_groups]
male_fields = [f"sum_m_{a}_2025" for a in age_groups]
# Add total population fields if desired
fields = ["sum_pop_2025", "sum_f_2025", "sum_m_2025"] + female_fields + male_fields
request_payload = {
"aoi": aoi_geojson,
"spatial_join_method": "touches",
"fields": fields,
"geometry": "polygon",
}
# Make the POST request
response = requests.post(SUMMARY_ENDPOINT, json=request_payload, verify=True)
if response.status_code != 200:
raise Exception(f"Failed to get summary: {response.status_code} {response.text}. Try selecting a smaller AOI or requesting less fields")
summary_data = response.json()
# Convert to DataFrame
df = pd.DataFrame(summary_data)
# Convert geometry from GeoJSON string to Shapely geometry
df["geometry"] = df["geometry"].apply(lambda geom: shape(json.loads(geom)) if isinstance(geom, str) else shape(geom))
gdf = gpd.GeoDataFrame(df, geometry="geometry", crs="EPSG:4326")
# Plot on Map
m = gdf.explore(
column="sum_pop_2025",
tooltip="sum_pop_2025",
# tooltip= ["sum_pop_2025"] + female_fields + male_fields,
cmap="YlGnBu",
legend=True,
scheme="naturalbreaks",
legend_kwds=dict(colorbar=True, caption="Population", interval=False),
style_kwds=dict(weight=0, fillOpacity=0.8),
name="Population by Hexagon",
)
m
# Let's aggregate:
agg_fields = female_fields + male_fields
pyramid_data = df[agg_fields].sum() # Summation across all returned polygons
# Prepare data for plotting
male_pop = [pyramid_data[f"sum_m_{a}_2025"] for a in age_groups]
female_pop = [pyramid_data[f"sum_f_{a}_2025"] for a in age_groups]
# Create a DataFrame for easier plotting
plot_df = pd.DataFrame({
"AgeGroup": [f"{a}-{int(a)+4}" if int(a) < 80 else "80+" for a in age_groups],
"Male": male_pop,
"Female": female_pop
})
# Plotting the Pyramid
fig, ax = plt.subplots(figsize=(7,5))
# Plot males as negative for symmetry
ax.barh(plot_df["AgeGroup"], -plot_df["Male"], color="steelblue", label="Male")
ax.barh(plot_df["AgeGroup"], plot_df["Female"], color="salmon", label="Female")
ax.set_xlabel("Population")
ax.set_ylabel("Age Group")
ax.set_title("Population Pyramid for Selected AOI (2020)")
# Make x-ticks positive labels, even though males are negative in the data
ax.axvline(0, color="black", linewidth=1)
ax.legend()
plt.tight_layout()
plt.show()