JDC geo-enhancement pilot#
The need for timely and accurate information about the current population, infrastructure, public services, and environmental factors that put those populations at risk is critical for planning and effective policymaking. Collecting this information for the national population is a challenge especially in developing countries as they continue to suffer the socio and economic impacts of the pandemic. This task is even more challenging for vulnerable groups such as forcefully displaced populations (FDPs). Their locations are often hard to reach and may be considered less of a priority for data collection for governments due to competing demands and budgetary constraints. Yet this information is needed for humanitarian and development operations working to support people affected by forced displacement as it can inform policy interventions that aim to improve the livelihoods for these vulnerable groups.
When assessing the situations faced by FDPs, experts are increasingly turning to geospatial data. Such data include satellite imagery, and the features that may be extracted from it, such as where the building and roads are, whether the lights are on at night or which areas, buildings, and facilities will flood in the monsoon season. Such remotely sensed data can provide unique perspectives in situations of conflict and disaster, as the data collection is objective, consistent and replicable, not affected by borders or influenced by politics.
Geospatial data complement and enrich other forms of data collection, such as field surveys, by providing tools and data used to develop sampling frames and incorporate additional elements into the sample design. Geospatial data can provide context indicating whether for example an area is rural or urban, clean or polluted, safe or in conflict, distant or accessible to environmental and public services, safe from floods or landslides etc. However, geospatial data is often unavailable and underutilized in many FDP contexts where refugees and Internally Displaced Population (IDP) live. Where it does exist, it is often years old as the development community under-invests in such spatial inventories, until a crisis strikes. Furthermore, refugees and IDPs are often forced into areas that are less desirable for political, social or environmental reasons, making it even less likely that recent very high resolution, current data is available, (see this report on the problems faces by geospatial practitioners in development settings). This paper describes how to apply innovative analytical tools and methods to analyze and combine geospatial data with survey data in forced displacement settings. Building on a previous work that identified, documented and filled these non-traditional data gaps in the IDP and refugee settings, this paper will show how geospatial data can be combined with survey data to drive new insights and analytics. The purpose of this paper is to introduce methods for attributing the location information collected in the field with insightful, novel geospatial data available publicly. Using two case study contexts that collected data on forcefully displaced populations, we provide a practical example of how this can be done.
Survey contexts#
Chad#
Surrounded by pervasive conflicts in neighboring countries, Chad has received large numbers of refugees, asylum seekers, and returnees since the early 2000s, from Western Darfur (South Sudan), the Central African Republic, and most recently the Lake Chad Basin. As of January 2021, the country—itself one of the poorest in the world—was hosting nearly half a million refugees. Most displaced populations are hosted along Chad’s borders and in other hard to each and isolated and lagging regions making it difficult to rely solely on the traditional data collection methods. As these refugee situations become increasingly protracted, the challenge for Chad and its partners is to help refugees rebuild their lives and become self-sufficient while at the same time creating an environment in which refugees and Chadians can thrive together. The 2018/19 Refugees and Host Communities Household Survey in Chad (RHCHS) was conducted alongside the Fourth Survey on Household Living Conditions and Poverty (ECOSIT4), expanding the ECOSIT4 sample to include a nationally representative sample of refugees and host communities .
Democratic Republic of the Congo (DRC)#
In August 2016 violence erupted in the Kasai region of the DRC. Fighting between local authorities and the government escalated and led to ethnically motivated attacks, causing many to flee to other areas and across the border into Angola. As the conflict abated, many of the displaced population returned voluntarily or were expelled from Angola in 2018. Conflict and food insecurity in the intervening years have contributed to further displacement, although on a smaller scale. In 2022, the World Bank-UNHCR Joint Data Center (JDC) provided support for a household survey in the Great Kasai area in the Democratic Republic of Congo (DRC) conducted by the UNHCR Sub Office Kananga in collaboration with the National Institute of Statistics (INS). The main objective of the survey was to generate high-quality socioeconomic data to inform decision making and programming of humanitarian and development interventions and policy . The sample included both rural and urban households, distributed across four target population types: repatriated refugees, returned IDPs, IDPs and members of host community. In this paper, we present the development of a set of spatial variables to enhance the information included in the microdata for the Kasai survey. A similar product will be generated to accompany the Chad RHCHS survey, tailored to the specific conditions and objectives of the survey and aimed at maximizing utility of the data for research. The first section of this paper will provide a definition of geospatial data. The second section will focus on the geospatial anonymization process. The third section will provide some examples of geospatial variables. The fourth section will showcase specific variables and the underlying spatial dataset. The last section will provide some conclusions.
What is Geospatial?#
Geospatial is an increasingly common term in development, in economics, and in data science, but it can cover several aspects of data collection, analysis, and dissemination. For the purposes of this paper, the term geospatial is used to reference two subjects:
Geospatial data collected in a survey: Modern survey techniques regularly collect spatial location information when performing surveys. This is most often in the form of latitude and longitude, but can also include descriptive locations, such as the name of a village or administrative location. These data can provide unique analytical opportunities, but the data are also critically protected as personally identifiable information (PII).
Geospatial data used to attribute collected survey data: location information collected in field surveys allow for those data to be compared with other data describing the landscape. There are a multitude of available, public, globally consistent data that can tell us a lot about the landscape, such as population density, land use/land cover, access to markets or schools, and many others. The unifying attribute of location allows disparate datasets to be combined and compared to provide novel insight into our development concerns and questions. This typology is further explained in section 3 Survey Spatial Data.
Survey Anonymization#
The recording of geographical locations of dwellings, agricultural parcels/plots, facilities, and other locations directly associated with surveyed communities and respondents is now common practice with the use of GPS-enabled tablets and hand-held devices in survey data collection. Exact coordinates could be used to identify individual respondents and are therefore typically removed from public-use datasets. Spatial anonymization serves to provide a geographic reference that enables users to integrate additional information from spatial datasets into a household survey and at the same time preserve confidentiality of place, preventing positive identification of the location of survey respondents. In our work we used an obfuscation method for anonymization where the collected coordinates are purposefully altered such that the exact household location is withheld, but the general area of the collection is shared in a consistent manner. The obfuscation method was implemented in this study in order to mirror the methods used in similar surveys, such as the LSMS-ISA and DHS surveys.
Obfuscation method & parameters#
The strata-based coordinate masking method relies on random offset of cluster center-point coordinates (or average of household GPS locations by sampling unit) within a specified range determined by an urban/rural classification. In this implementation, a range of 0-2 km is used in urban areas. In rural areas, where communities are more dispersed and risk of disclosure may be higher, a range of 0-5 km offset is used for most clusters. A range of 0-10 km offset is used for 10% of rural clusters, effectively increasing the known range for rural points while introducing only a small amount of additional noise.
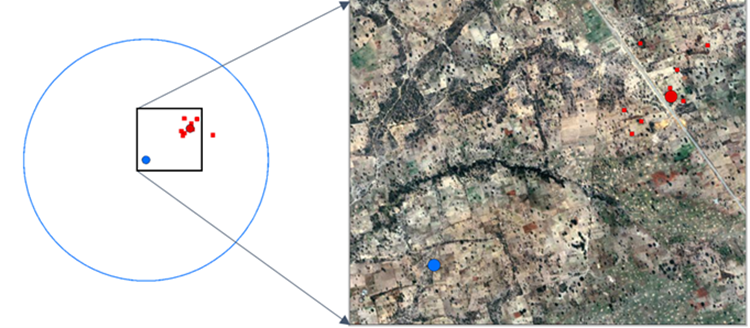
Fig. 2 Example of anonymized location process: household locations (red squares) are first averaged by EA (red dot), then random displacement within fixed range is applied to produce a public version of the location (blue dot). The blue circle represents the anonymizing spatial region (ASR), or zone of uncertainty.#
The anonymized coordinates should allow users to integrate additional spatial variables with a higher degree of accuracy than would be possible with only locality variables (such as village or district name). At the same time, transparency in the anonymization method and parameters allows users to explicitly incorporate spatial uncertainty in derived variables, by using the entire ASR for extraction.
Survey Spatial Data#
As noted above there are two types of geospatial data used in this analysis, reference spatial features derived from location data collected in the survey and representing the survey sites, and auxiliary spatial datasets used for attribution, to characterize the survey sites.
Reference feature#
To attach spatial data to a microdata record, the record must be represented by a spatial feature. This could be GPS coordinates for a household, plot outline for an agricultural field, or it could be a product of aggregation, such as the boundary of a refugee camp for surveyed households within the camp. Finally, the feature may by further abstracted by the process of anonymization. The dissemination of spatial information, anonymized or not, carries some spatial disclosure risk because it reduces the known area, and therefore population pool, for individual households. The use of anonymized location means that spatial disclosure risk can be assessed once, at the level of anonymizing region. The use of raw coordinates, on the other hand, may incur additional risk with each successive variable. High dimensionality in the variable set or high spatial resolution of reference data may result in unacceptable disclosure risk.
Determining an acceptable level of risk for publicly disseminated datasets should consider factors such as respondent consent, local statistical laws, data privacy policy of the data provider, sensitivity of information collected in the survey and potential for harm due to reidentification, as well as the wealth of benefits that derive from greater access to data for research and improved policymaking. The International Household Survey Network (IHSN) and the World Bank have produced guidelines and tools for applying disclosure control to survey microdata that is not explicitly spatial. The incremental risk added by spatial filtering enabled by geovariables can be measured using similar approaches, as described in a technical note produced for the Inter-secretariat Working Group on Household Surveys.
To accommodate a large set of variables, and for ease of implementation, geovariables for JDC surveys were produced using the anonymized coordinates and related ASR. Disclosure risk was measured as a function of unattributed population count within the ASR, derived from multiple gridded population datasets. A minimum population count of 500 has been applied to LSMS-ISA and other surveys disseminated by the World Bank and was adopted for use in this context. No anonymized coordinates were suppressed, as there were no violations of this minimum criteria, although it must be noted that there is uncertainty in the cell-level values of the reference gridded population datasets. Ideally the risk assessment would be reinforced with digital EA boundaries and a comprehensive georeferenced village dataset with population, but these datasets were not available.
Spatial data for attribution#
Between the two surveys analyzed in this project, we assembled a set of 77 variables across multiple thematic areas. Topics include general landscape characteristics like population density and distance to markets, climatology, and geophysical characteristics like elevation, slope, and soil constraints to agriculture. Some variables capture temporal variation, as in the growing conditions of survey season, and the change in conflict events between onset of violence in the region and the year of survey. Information on natural hazards and food security is also incorporated. See Annex A for a detailed list of sources and reference dataset.
Illustrative examples#
Below are four deep dives on select geospatial variables analyzed in this project. These represent a small fraction of the total geospatial variables analyzed , but illustrate ways in which geospatial variables add value to survey datasets. Specifically, we highlight the benefits of 1) greater descriptive detail (continuous vs discrete site classification) in the section on urbanization, 2) access to objective measures that can be used to validate or understand subjective assessments in the section on electrification, and 3) filling of information gaps or expansion of the information base for survey locations in the section on natural hazards, and 4) spatial characteristics to inform sample design. For each example, we describe the reference spatial datasets and linked geospatial variables and suggest insights to be gained by merging geospatial and survey data. Detail about the different methods used to integrate spatial data with survey features can be found in Annex C: integration methods
Urbanization#
Surveys are often stratified by a rural and urban classification, an official definition that varies widely between countries. It may be based on population size or density, predominant livelihood, presence of certain types of amenities or other variations. On the ground, though, it is not a discrete characteristic, even within a stratum. For instance, there are urban areas of vastly different sizes and growth rates, and a clear distinction between core and periphery. Yet the classification is an important input to sample design, it can impact findings when disaggregated by strata, and may even affect potential research application and policy recommendations. The first stage sample design for displaced populations in the Socioeconomic survey in Grand Kasai (Democratic Republic of Congo) was based on an alternative grid structure, but sites were still classified as urban and rural. According to this classification the sample was 61% rural and 39% urban. Geovariables from related spatial datasets allow users to explore different aspects of the rural-urban continuum. Three such datasets, explored below, are Degree of Urbanization, modeled population density and Travel time.
The Degree of Urbanization (DoU) is a gridded global dataset that applies a consistent set of criteria to define 7 types of landscapes, from urban centre to very low density rural. The map in Figure 2 shows DoU categories in the area of interest, and the distribution of the Kasai sample across this typology is presented in Figure 2.
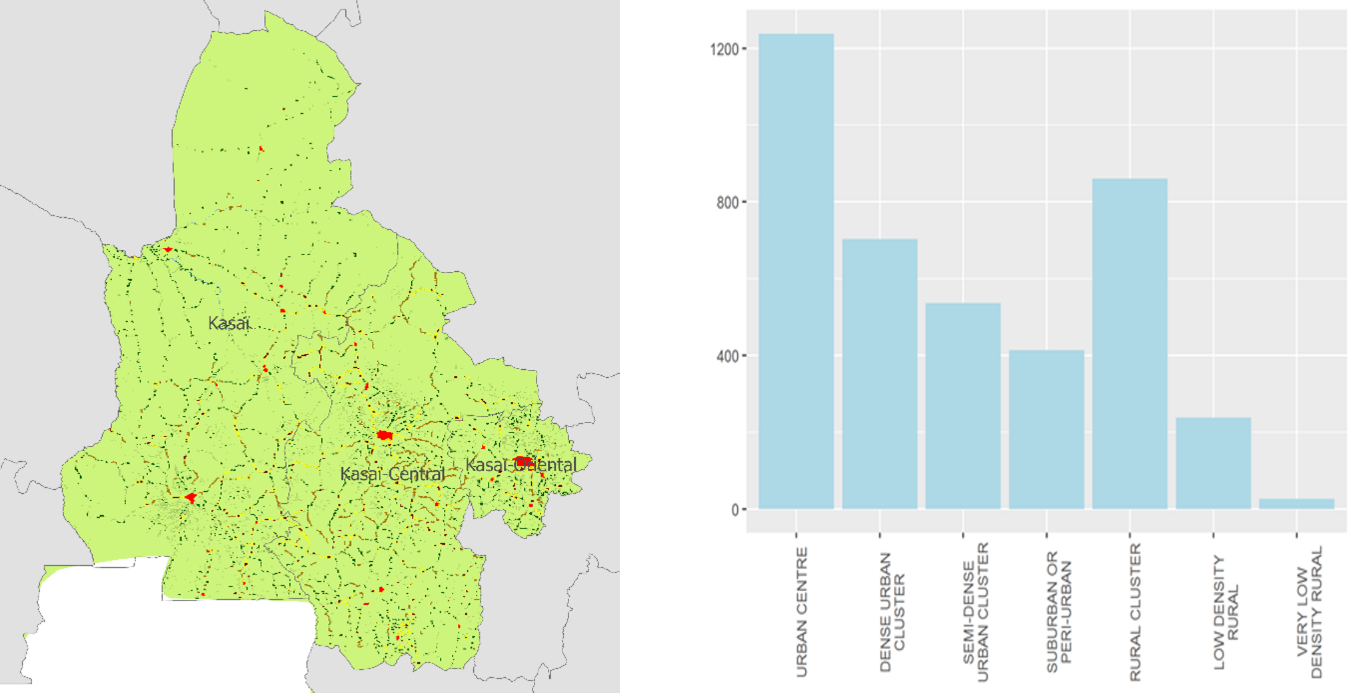
Fig. 3 Image on the left shows urbanization from the European Commission’s DoU classification (green is rural, yellow and red are urban). On the right we see the urban classification of survey locations after anonymization process has been applied.#
Population density#
Population density is a continuous surface that, when queried with a local mean, characterizes survey sites along a spectrum, where lowest values are extremely sparse and highest values may occur in most densely populated urban neighborhoods. Inputs of roads, settlements, landcover and other factors are used with administrative population counts to allocate population to pixels, as displayed below. Values for the Kasai survey sites range from less than 10 people per sq km to more than 13000, as captured in the histogram in Figure 3.
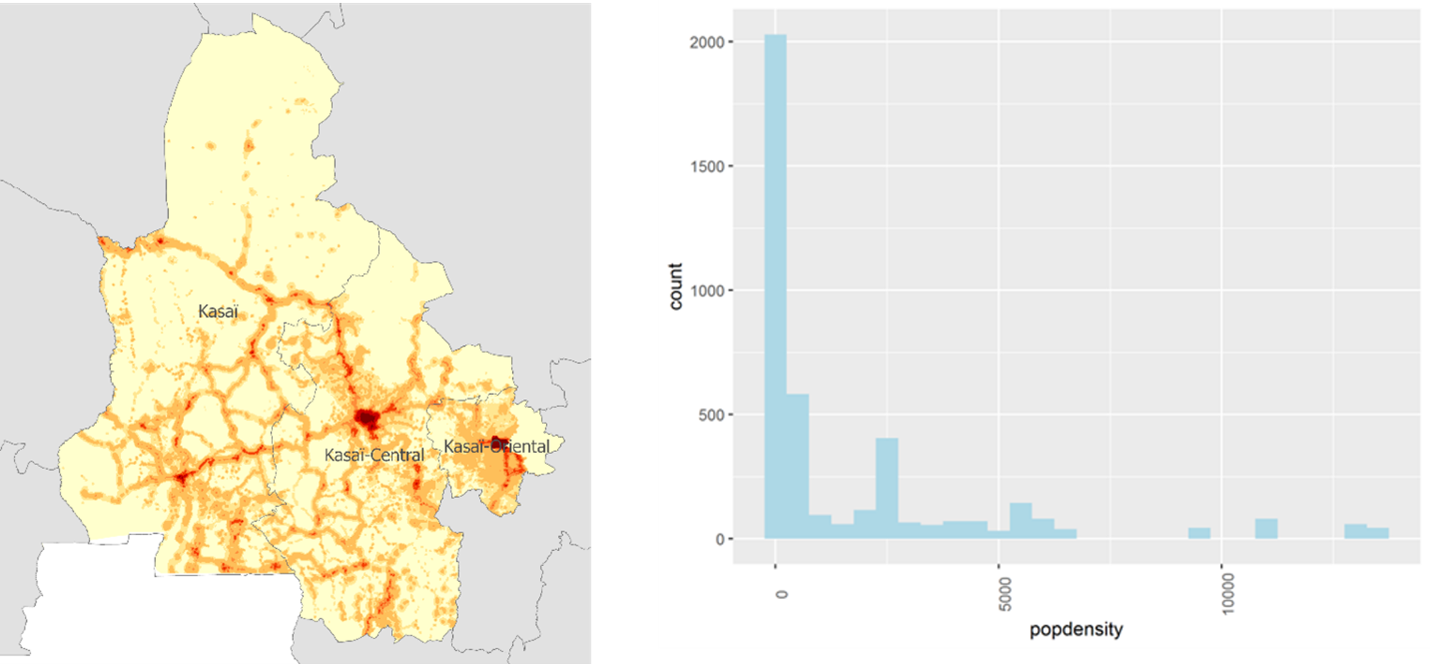
Fig. 4 (left) Worldpop 2020 population density in the Kasai region, and (right) distribution of total population around survey locations in the Grand Kasai in DRC, based on the anonymized ASR.#
Travel Time#
Travel time is measured using a global friction surface, which measures the time required to cross a 1 km cell. Inputs to the model include the location and type of road infrastructure, landcover types, and elevation. By applying a raster accessibility model to this travel surface, we can measure the time it takes to get from a survey location to a destination of interest, which could be schools, hospitals, airports, ports, or city centers. In the example below, we measure travel time to a city of at least 50000 people.
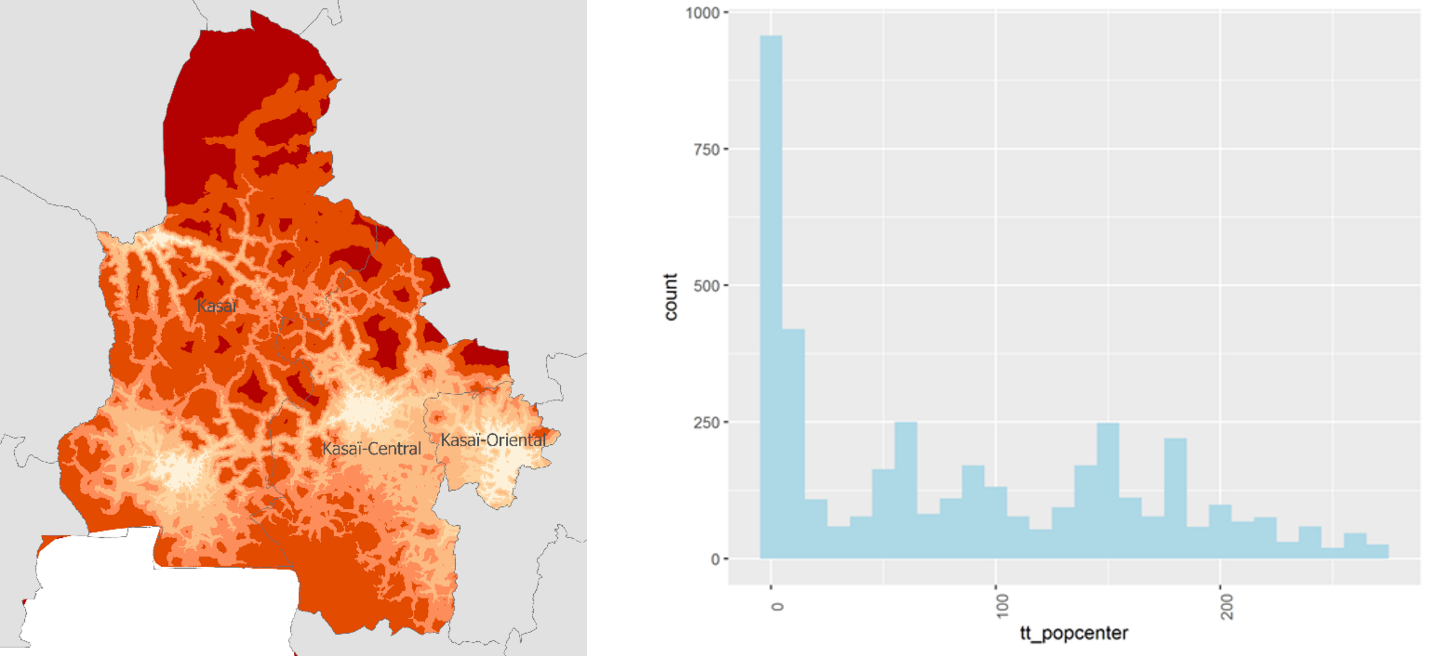
Fig. 5 (left) Travel time to nearest city of more than 50000 people, and (right) distribution of time to reach city of 50000 for survey locations in the Grand Kasai#
The degree of urbanization, population density and travel time results can be used to differentiate within urban and rural class, or as an alternative to the official definitions. While it may diverge from the official classification, these variables have the advantage of being roughly comparable across countries and regions.
Access to electricity (Congo Dem Rep, Module 6 Section C)#
The High Resolution Electricity Access (HREA) database includes measures of electricity access, reliability and usage, derived from statistical analysis of remote sensing of lights at night. The data has some limitations, such as background noise in the input data, but can nevertheless be an interesting counterpoint to the information provided by survey respondents.
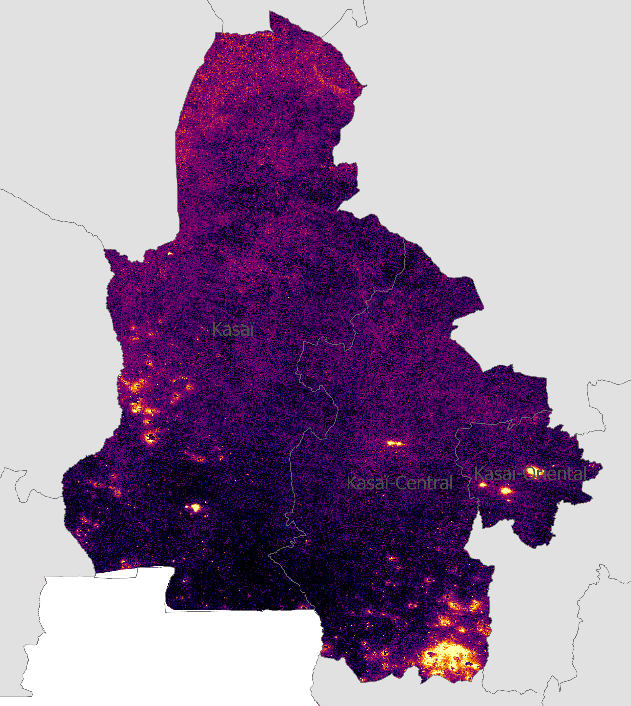
Fig. 6 Nighttime lights composite image for 2019#
Incidence of access to electricity is low in the survey dataset, with only 91 out of 4069 households reporting yes to the question. Not surprisingly, households with electricity are urban, occurring almost exclusively in Kananga and Tshikapa. The map above displays nighttime light values averaged over a year (2020). Temporal aggregation reduces noise, accounts for missed observations and ephemeral light sources. A similar HREA product is the likelihood of settlements being electrified (lightscore). With values only present in settlement areas, mapping at large scale is required for visual interpretation, as in Figure 6 below.
The left panel in Figure 6 shows percent of households that report having electricity aggregated by gridcell (dots) overlaid on the HREA lightscore, ranging from 0 (lowest) to 1 (highest) probability. The observations are largely in agreement but it is notable that even in the city center, a maximum of 32% of surveyed households within a gridcell, report having electricity. This would point to non-spatial household characteristics accounting for more of the difference in access than presence of infrastructure, at least in this limited area. Likewise, the density curves of lightscore value for households with and without electricity is as expected, although it is clear that some surveyed households without electricity have a very high lightscore, and vice versa.
Exposure to natural hazards#
Exposure to natural hazards can impede or reverse gains in economic development and may be an even greater challenge for displaced populations lacking resources and coping mechanisms, without historical understanding of a location. It can be challenging for even long-term residents to objectively characterize risk from natural hazards. Furthermore, climate change adds an element of uncertainty with regards to future events. However, remote sensing and other data sources offer ways to map flood, drought, wildfire, landslide and other events as well as model risk for these events at any given location.
Two such datasets are presented below. The Fathom flood dataset uses information on climate and terrain to model risks from rainfall and river flooding at different frequencies or predicted return periods. The NASA landslide susceptibility map, shown at right identifies areas with high potential for landslides.
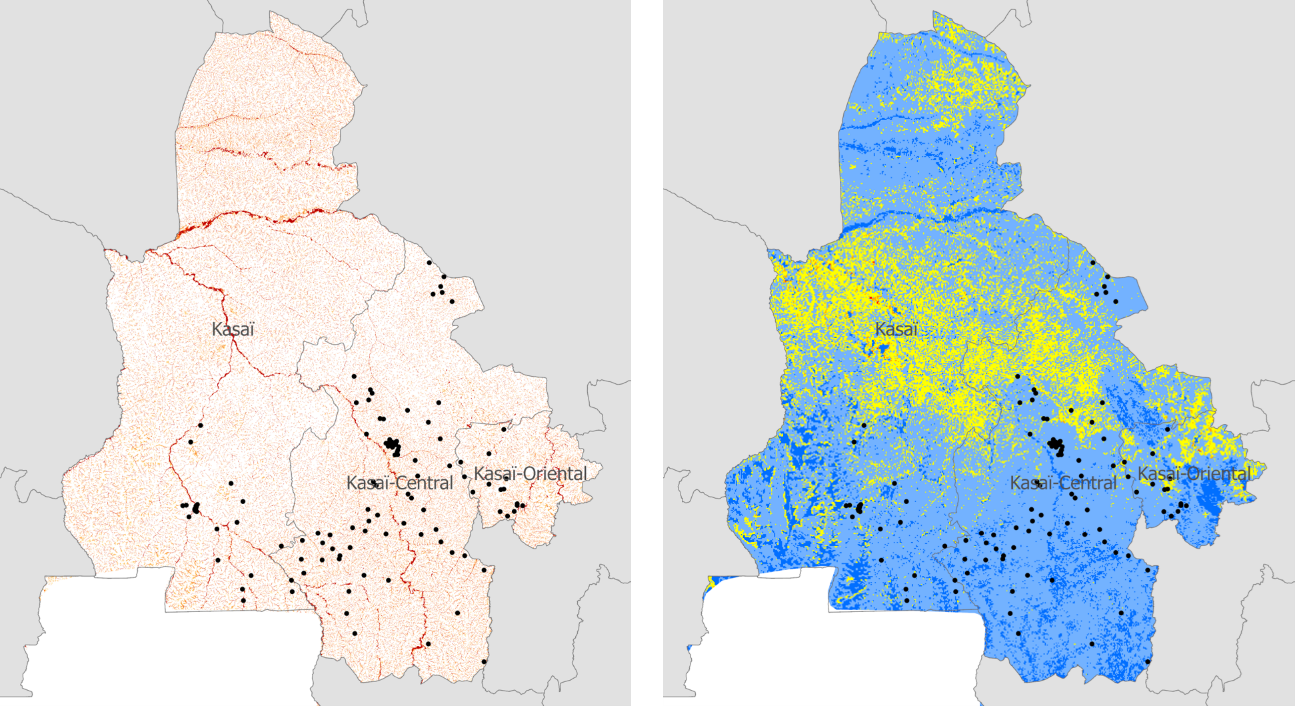
Fig. 7 Flood risk (left) based on the Fathom flood models 10-year fluvial and pluvial floods (combined); darker red indicates deeper flood depths. Landslide susceptibility layer (right) from NASA Landslide Viewer.#
While the survey collected information on recent events in a section on Shocks and Coping Mechanisms, the frame of reference was limited to events within the past 12 months that negatively impacted the household. The incidence of positive responses was low overall, with only 25 households reporting such an event, and clustered in space and time. More than half of the household flood reports occur in a highly localized area in the November-December timeframe, suggesting this subset is describing a single event.
The survey questions provide information that may have immediate impact on household welfare, but site characteristics derived from the Fathom and Landslide datasets add the dimension of risk by capturing the information about the likely frequency of such events. The spatial data also allow for differentiation across households that did not experience flooding in the survey reference period, as well as exposure to multiple hazards.
Enhancing a sample frame#
The ECOSIT 4 survey in Chad was conducted in 2018, covering both the national population and the large refugee population in camps. One landscape-level geovariable that describes sample sites is the Livelihood Zone Map developed by FEWSNET, displayed in the left panel of Figure 8. For reference the distribution of population is displayed in the right panel. Livelihood zones provide an alternative grouping or strata definition for surveys aimed at monitoring food security, given that the areas are generally homogeneous in terms of food production systems.
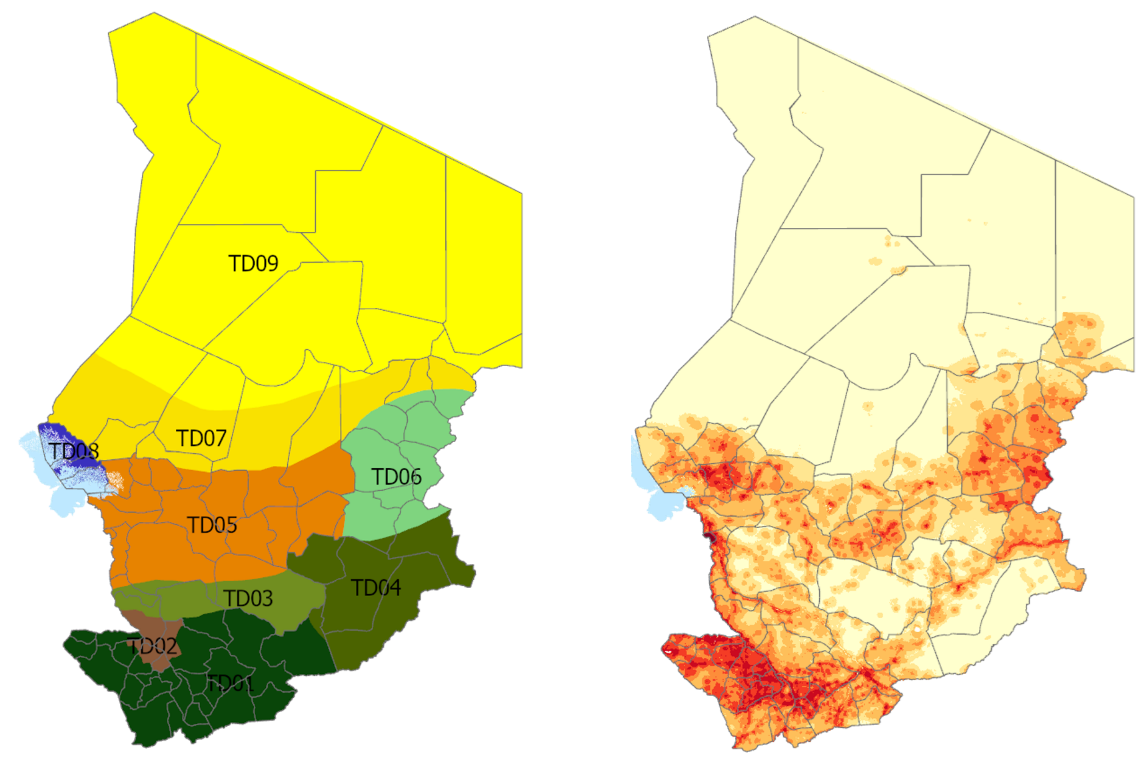
Fig. 8 Livelihood Zones and Population Density#
The distribution of the ECOSIT 4 sample across livelihood zones is illustrated in Figure 9. As expected, the Livelihood zones that are most densely populated (darker red) are well represented. However, it is clear that livelihood zones might be used to target specific populations in a survey with different objectives.
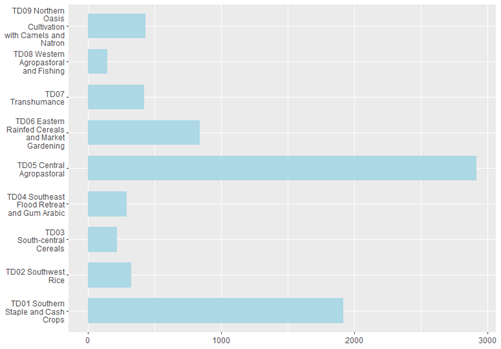
Fig. 9 Distribution of ECOSIT 4 sample across livlihood zones#
Conclusion#
The geo-enhancement process presented in this paper has been long established in other World Bank survey products, most notably the LSMS-ISA surveys. As such, the basic methods, options, and data have been tested, vetted, and approved. However, applying the methodology in other settings requires a deeper investigation of the applied methods and data to ensure they comply with the obligations to and requirements for the data. Based on the work done in this project, there are two aspects that need to be interrogated in more detail:
Anonymization method for JDC survey data: The anonymization method used in this paper mirrors the methods of the LSMS-ISA. This was chosen because the method was familiar to the team, and because it has proven effective in other situations. However, some factors that may affect this decision include vulnerability of the target population, sensitivity of data collected and public availability of complementary data sources that, in combination with the geovariables, may compromise the confidentiality of respondents. Stricter parameters with the strata-based method, or alternative anonymization methods might be considered, as well as restricted dissemination, in order to meet the JDC’s goals and obligations to survey producers, users, and owners.
Geospatial data for comparison and attribution: For this assessment, the project team focused on geospatial variables based on available data and our knowledge of previous surveys. For future applications, the JDC should look to survey users and producers for their requirements, interests, and desires for additional geospatial variables. The team produced ~75 variables in this assessment, but there are hundreds of potential variables that could be analyzed for survey specific usage.
We hope the data produced in this project will be of value to the experts who will interrogate the data, but we want to stress that this is a first step in leveraging geospatial data and methods in JDC surveys, and we encourage everyone involved to share their opinions and ideas about how this could be done more effectively.