Evaluating Overture Maps Places#
Data#
Overture Maps#
Overture Maps Places#
Show code cell source
PLACES = gpd.read_file(
    f"../../data/raw/overturemaps/overturemaps_2024-06-13-beta.1_places_{COUNTRY}.geojson"
).set_index("id")

PLACES = PLACES.sjoin(AREA[["geometry"]], predicate="within").drop(
    ["index_right"], axis="columns"
)
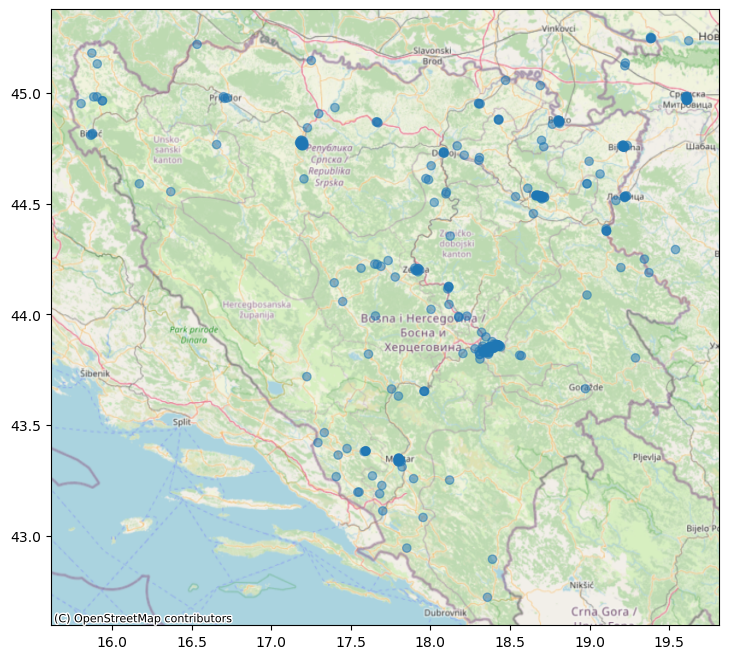
Vizualing places where category=school,
Show code cell source
# Plotting the GeoDataFrame with contextily base map
fig, ax = plt.subplots(figsize=(10, 8))

PLACES[PLACES["main_category"].isin(["school"])].plot(
    column="main_category",
    ax=ax,
    alpha=0.5,
    # markersize=gdf['size'],
    marker="o",
    legend=False,
)
ctx.add_basemap(
    ax, crs=PLACES.crs.to_string(), source=ctx.providers.OpenStreetMap.Mapnik
)
Show code cell source
fig = px.treemap(
    rs.value_counts(subset=["c_0", "c_1", "c_2"]).to_frame("count").reset_index(),
    path=["c_0", "c_1", "c_2"],
    # color_discrete_sequence=px.colors.qualitative.Bold,
    values="count",
    title="Overture Maps Places",
    height=600,
)

fig.show()