Jam’s heatmaps#
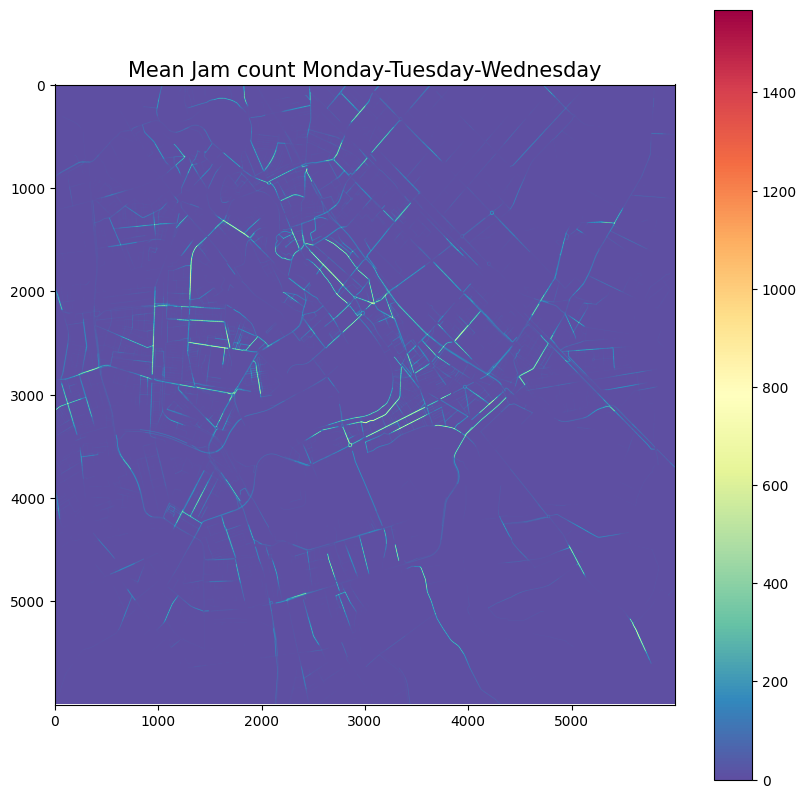
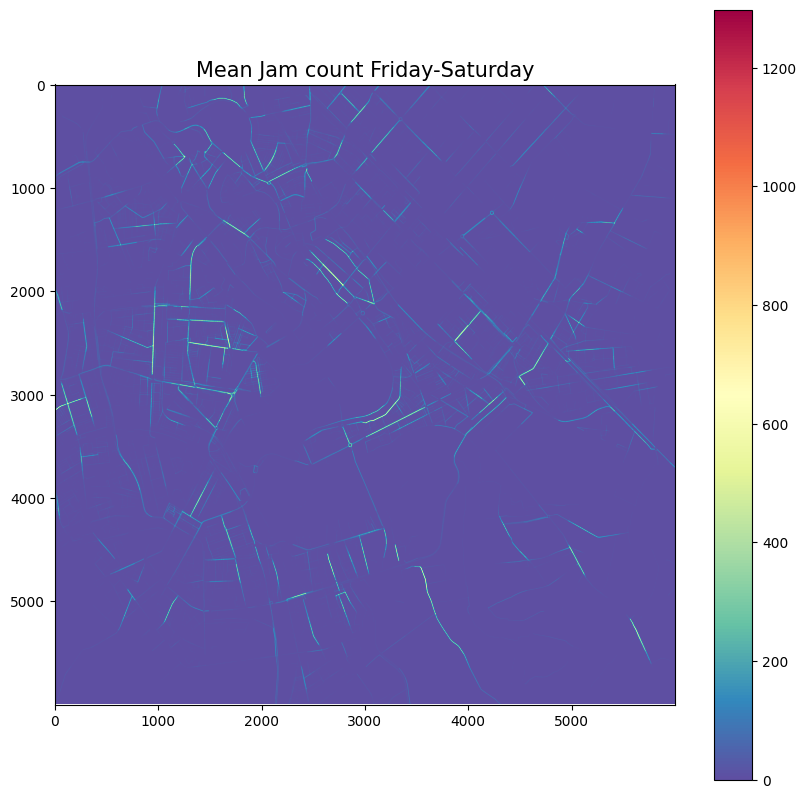
The goal of this notebook is to create heatmaps with the mean number of jams per day in a Baghdad for May 2024. Three heatmaps are calcualted for: Monday-Tuesday and Wednesday (mid-week), Sunday and Thursday(ext-week) and Friday and Saturday(weekend). The process does not take place entirely on this notebook, part of it occurs on a R script to take advantage of some of the packages available there. The steps are the following:
Read the data and repartition it by date and group of days (mid-week, ext-week, weekend)
Rasterize each vector file using the same raster as a base
Calculate the mean number of jams for each pixel
Step 1. Read and re-partition the data#
In this step, we read the data and re-partition it by date. The goal is to obtain only the data for the month of May 2024
Step 2. Rasterize the vector layer#
This step is produced in the script fasterize.R. It creates a reaster layer by counting the number of jams that were seen on each pixel of the area of interest.
Step 3. Calculate the mean number of jams per day#
Once we have the raster with the number of jams per pixel for each day in the month of May 2024, we calculate, for each group of days of the week, the mean number of jams in each pixel. As a result, we obtain the three maps from below. The GeoTiff version can be found here