Air Pollution in Baghdad#
This notebook analyses air pollution in Baghdad from 2023 to 2024. This is an ongoing methodology to understand economic activity using air pollution. This notebook does an exploratory analysis of the data and overlays the data with road networks to see the difference in pollution closer to major roads.
Methodology#
Extract Air Pollution data from Google Earth Engine
Plot it at a national level
Plot it at a woredas
Overlay road networks with air pollution
Estimate pollution closer to roads and farther away from it
Insights#
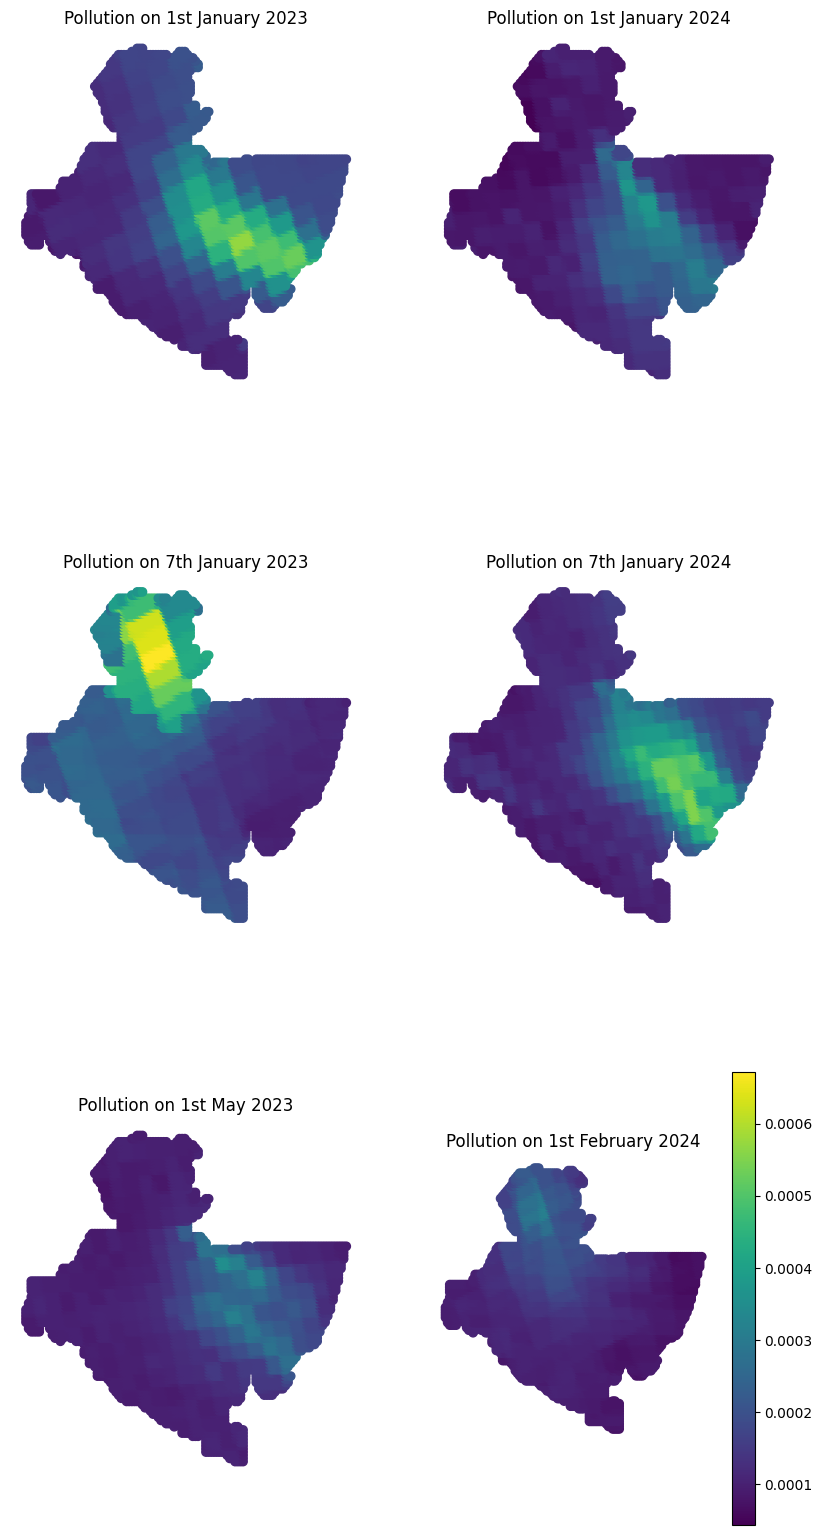
The following dates are not available in the data. The reasons are unknown.: DatetimeIndex(['2019-07-15', '2019-11-23', '2020-02-01', '2020-02-15',
               '2020-03-13', '2020-04-01', '2020-04-03', '2020-07-04',
               '2020-07-15', '2020-08-17', '2020-10-01', '2020-11-24',
               '2021-01-01', '2021-02-04', '2021-02-05', '2021-06-15',
               '2021-07-27', '2021-08-10', '2021-08-27', '2022-02-21',
               '2022-05-19', '2022-08-01', '2022-11-16', '2022-12-23',
               '2022-12-31', '2023-03-15', '2023-07-19', '2023-11-22',
               '2023-12-29', '2024-03-18', '2024-03-23', '2024-03-24',
               '2024-04-11'],
              dtype='datetime64[ns]', freq=None)
Monthly National Pollution#
Air Pollution is held longer in the air during winters than summers. However, we notice an interesting trend where the pollution in July-August is comparable to that of January which is the coldest month. The average pollution has come down from 2023 to 2024 but that could be attributed to the year not having complete data. The pollution in January 2024 was significantly less than that in January 2023.
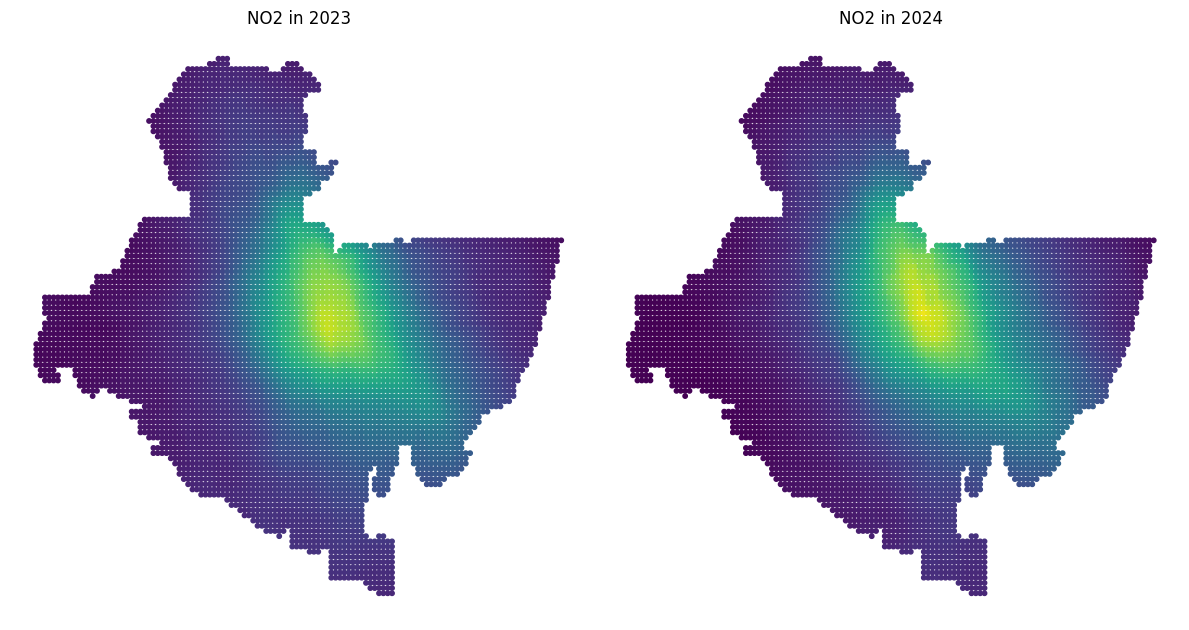
The northeastern parts of Baghdad are the most polluted.
Pollution by sub-districts in Baghdad#
This shows average air pollution across both 2023 and 2024.
**There is a significant variation in the population between the districts of Baghdad.
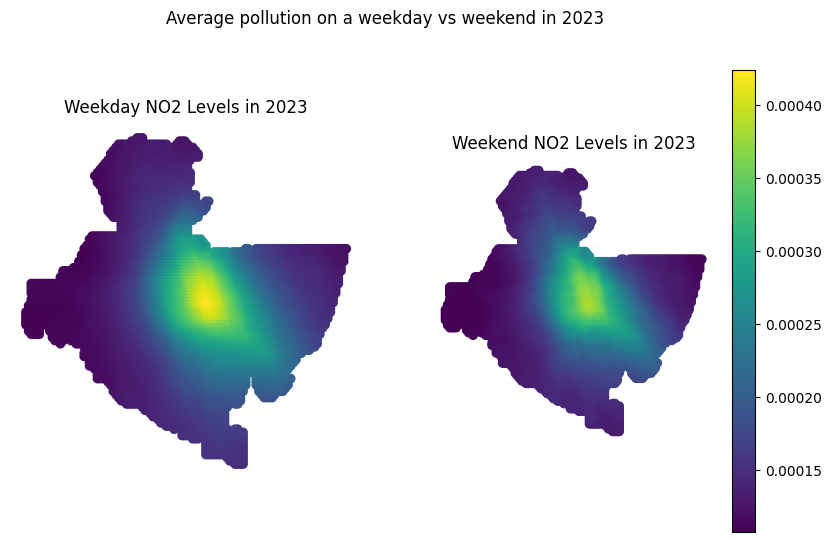
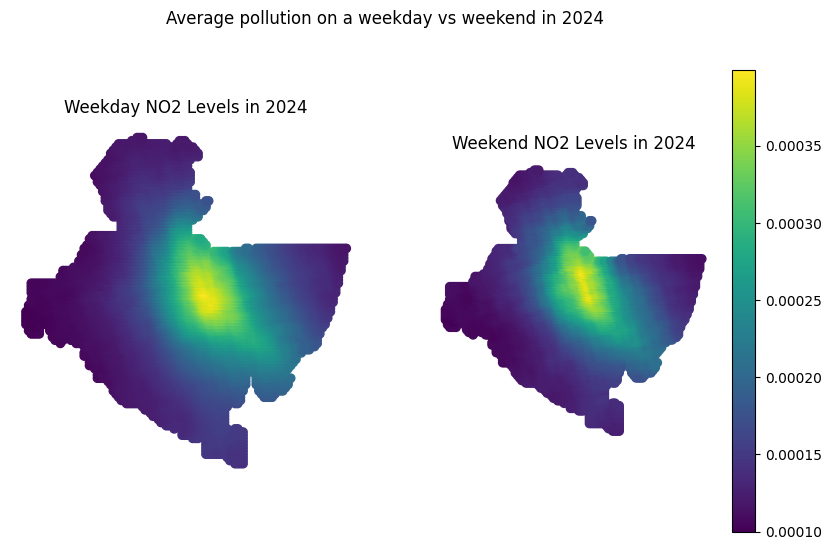
Daily Shifts in Air Pollution#
Weekdays vs Weekends#
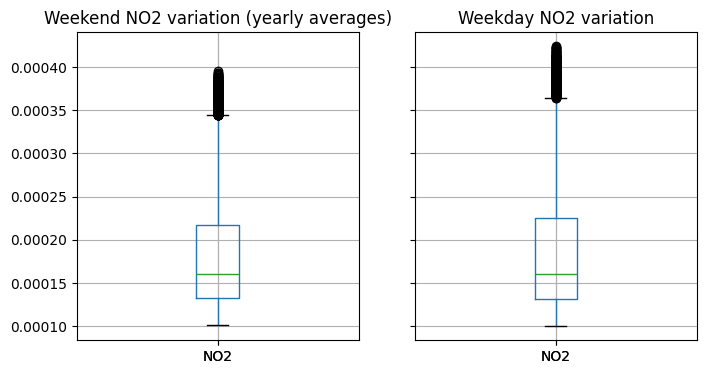
Comparing weekday and weekend average pollution shows that when you average all the weekdays in a year across 2019-2024, the air pollution is higher on weekdays than weekends