Distribution of Regression Coefficients#
Imports#
import os
import numpy as np
import pandas as pd
from iqual import tests
Load datasets#
data_dir    = "../../data"

### Qualitative data (Enhanced Data with progressive k-fold bootstrap)
bootstrap_df  = pd.read_csv(os.path.join(data_dir,"enhanced_bootstrap_kfold.csv"))

### Quantitative data
quant_df      = pd.read_csv(os.path.join(data_dir,"quant_data.csv"))
Variables#
annotation_vars = ["ability_low","job_secular"]

id_vars         = ['uid','split','data_round','refugee','bootstrap_run','train_sample_size']
Enhanced Bootstrap Dataframe (Merged with quantiative data)#
bootstrap_df = bootstrap_df[[*id_vars,*annotation_vars]].copy()
bootstrap_df = pd.merge(bootstrap_df,quant_df,on=['uid','data_round','refugee'],how='left')
Regression Configuration#
# Numerical regressors (Continuous/Dummy variables)
numerical_vars = [
     'refugee',"int_sex", "int_age",
     'hh_head_sex',
     'eld_sex',
     'parent_reledu',
     'num_child',
     'hh_head_age',
     'parent_eduyears',
     'eld_age',
     'hh_asset_index',
     'hh_income',
     'int_trauma_exp',
]
import itertools.product

HUMAN_SIZES    = [100, 200, 400, 700]
MACHINE_SIZES  = [200, 400, 600, 800, 1000, 1200, 1400]
BOOTSTRAP_RUNS = [1, 2, 3, 4, 5, 6, 7, 8, 9, 10]

N_DRAWS        = 5000
coefs        = []
random_draws = np.random.normal(size=N_DRAWS)


for ANNOTATION, REGRESSOR in [('job_secular','eld_sex'),('ability_low','refugee')]:

    for h, r, m in itertools.product(HUMAN_SIZES, BOOTSTRAP_RUNS, MACHINE_SIZES):

        print("\r...| ","Bootstrap Run:",r,"Human:",h,"Machine:",m,sep=' ',end=' | ...')

        df = bootstrap_df[(bootstrap_df['train_sample_size']==h) & (bootstrap_df['bootstrap_run']==r)]

        # Separate human and machine data
        human_df   = df[df.split == 'train']
        # Sample machine data
        machine_df = df[df.split != 'train'].sample(m)
        # Concatenate human and machine data for enhanced data
        enh_df     = pd.concat([human_df, machine_df])

        # Run regression on human
        human_model = tests.Interpretability(human_df,annotation_vars=[ANNOTATION],numerical_regressors=numerical_vars).fit_all()
        # Human model coefficient and standard error
        human_coef = human_model.get_model_coefficient(ANNOTATION,REGRESSOR)
        human_se   = human_model.get_model_std_error(ANNOTATION,REGRESSOR)


        # Run regression on enhanced data
        enh_model  = tests.Interpretability(enh_df,annotation_vars=[ANNOTATION],numerical_regressors=numerical_vars).fit_all()
        # Enhanced model coefficient and standard error
        enh_coef = enh_model.get_model_coefficient(ANNOTATION,REGRESSOR)
        enh_se   = enh_model.get_model_std_error(ANNOTATION,REGRESSOR)


        # Random draws from normal distribution
        for random_draw in random_draws:
            # Bootstrap (Human) coefficient
            human_boot_coef = human_coef + random_draw*human_se

            # Bootstrap (Enhanced) coefficient
            enh_boot_coef = enh_coef + random_draw*enh_se

            coefs.append({
                'annotation': ANNOTATION,'regressor': REGRESSOR,
                'human_coef': human_coef,'human_se':human_se,
                'enh_coef': enh_coef,'enh_se':enh_se,
                'human_boot_coef': human_boot_coef,
                'enh_boot_coef': enh_boot_coef,
                'bootstrap_run':r,'n_h': h,'n_m': m,
        })

coef_data = pd.DataFrame(coefs)
coef_data.head()
...| Bootstrap Run: 10 Human: 700 Machine: 1400 | ...
Regression Coefficient Plots#
import matplotlib.pyplot as plt
import matplotlib.patches as mpatches
import seaborn as sns
keep_cols = ['annotation','regressor','human_boot_coef','enh_boot_coef','bootstrap_run','n_h','n_m']
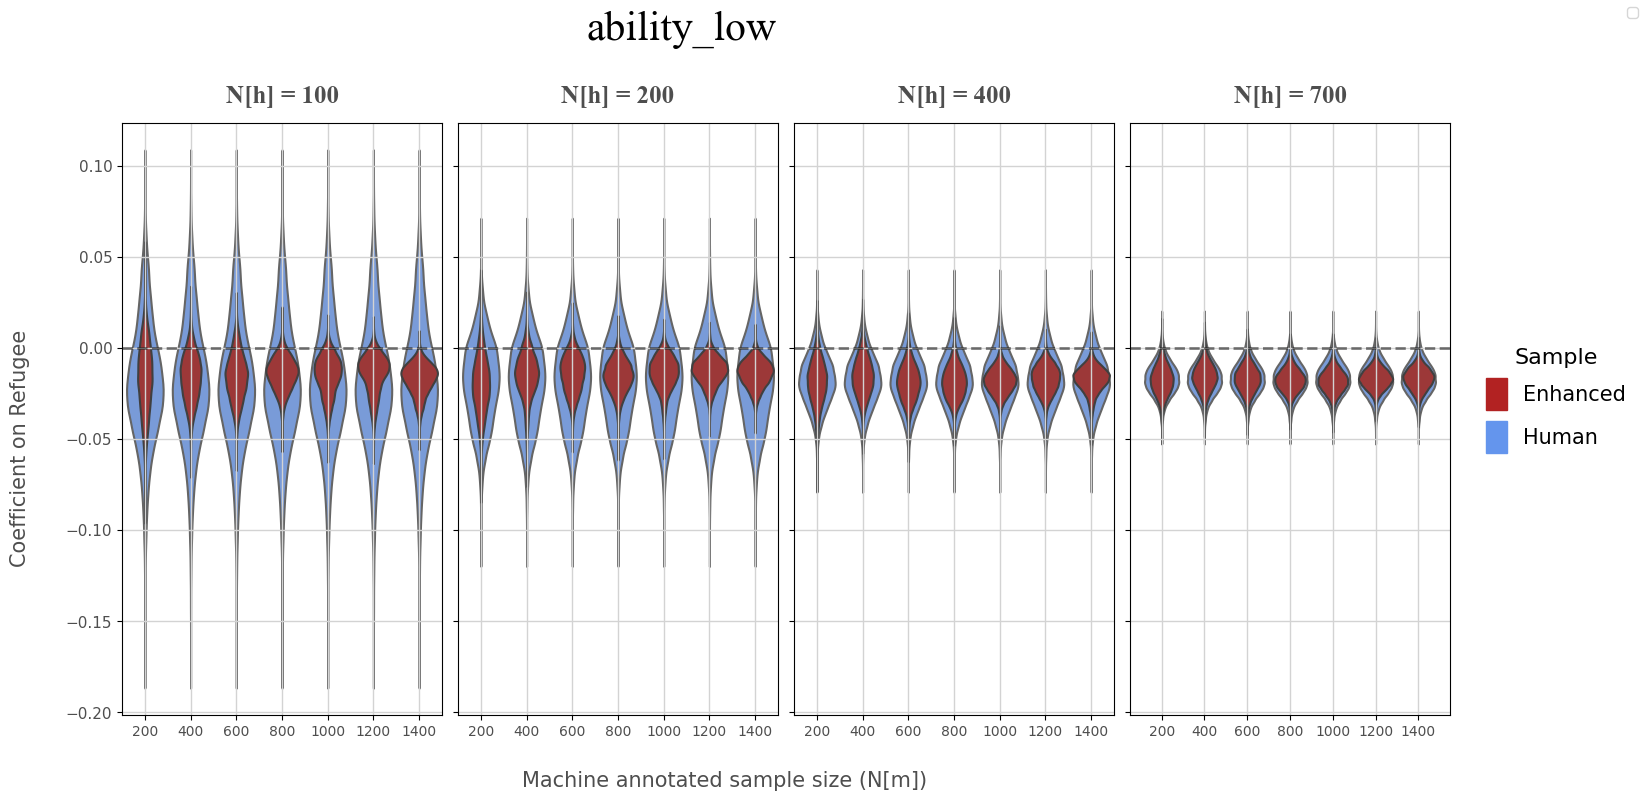
Low Ability (Coefficient on Refugee)#
ANNOTATION, REGRESSOR = 'ability_low','refugee'
coef_df = coef_data.loc[(coef_data['annotation']==ANNOTATION),keep_cols]

fig, axs = plt.subplots(nrows=1, ncols=4, figsize=(16,8), sharey=True, sharex=False)

fig.suptitle(ANNOTATION,x=0.4, y=0.99, fontfamily='Times New Roman',fontsize=30,)

# Iterate over N(h)
for i, human_size in enumerate(HUMAN_SIZES):
    # Get axis
    ax = axs[i]

    # Select subset [n_h = human_size]

    df = coef_df[(coef_df['n_h']==human_size)]

    # Zeroline (dashed)
    ax.axhline(y=0, ls='--',color='black',alpha=0.5, lw=2)

    # Human sample
    sns.violinplot(x=df['n_m'],y=df['human_boot_coef'],
                   ax=ax,dodge=False,inner=None,saturation=0.7,color='cornflowerblue',
                   name=None
                  )

    # Enhanced sample
    sns.violinplot(x=df['n_m'],y=df['enh_boot_coef'],
                   ax=ax,dodge=False,inner=None,saturation=0.7,color='firebrick',
                   name=None
                  )

    # Removing redundant xy axis labels
    ax.set(ylabel=None,xlabel=None)
    ax.tick_params(axis='y',labelsize=11, labelcolor='#4e4e4e')
    ax.tick_params(axis='x',labelsize=10, labelcolor='#4e4e4e')

    ax.grid(True, lw=1, c='lightgray')

    # Subplot title
    ax.set_title(f"N[h] = {human_size}",fontdict={'family':'Times New Roman',
                                            'fontsize':18,
                                            'color':'#4e4e4e',
                                            'fontweight':800
                                           },
                 pad=15
                )


# Add legends
human_patch = plt.plot([], [], color='cornflowerblue', marker='s', markersize=10, linestyle='')[0]
enhanced_patch = plt.plot([], [], color='firebrick',  marker='s', markersize=10, linestyle='')[0]
fig.legend(handles=[human_patch, enhanced_patch], loc='upper right', ncol=2)

# Y-axis label
fig.text(-0.02, 0.3,f"Coefficient on {REGRESSOR.title()}",rotation='vertical',
         fontdict={"fontsize":15,'color':"#4e4e4e"},
        )
# X-axis label
fig.text(0.3, 0.02,f"Machine annotated sample size (N[m])",
         fontdict={"fontsize":15,'color':"#4e4e4e"},
        )

# Layout

# Legend
patches = [
    mpatches.Patch(color='firebrick', label='Enhanced'),
    mpatches.Patch(color='cornflowerblue', label='Human'),
          ]
fig.legend(handles=patches,
           title='Sample',
           title_fontsize=16,
           fontsize=15,
           ncol=1,labelspacing=0.5,
           handlelength=1,handleheight=2,
           loc='center right',frameon=False,
         )
plt.subplots_adjust(top=0.85,wspace=0.05,right=0.88,left=0.05)
plt.show()

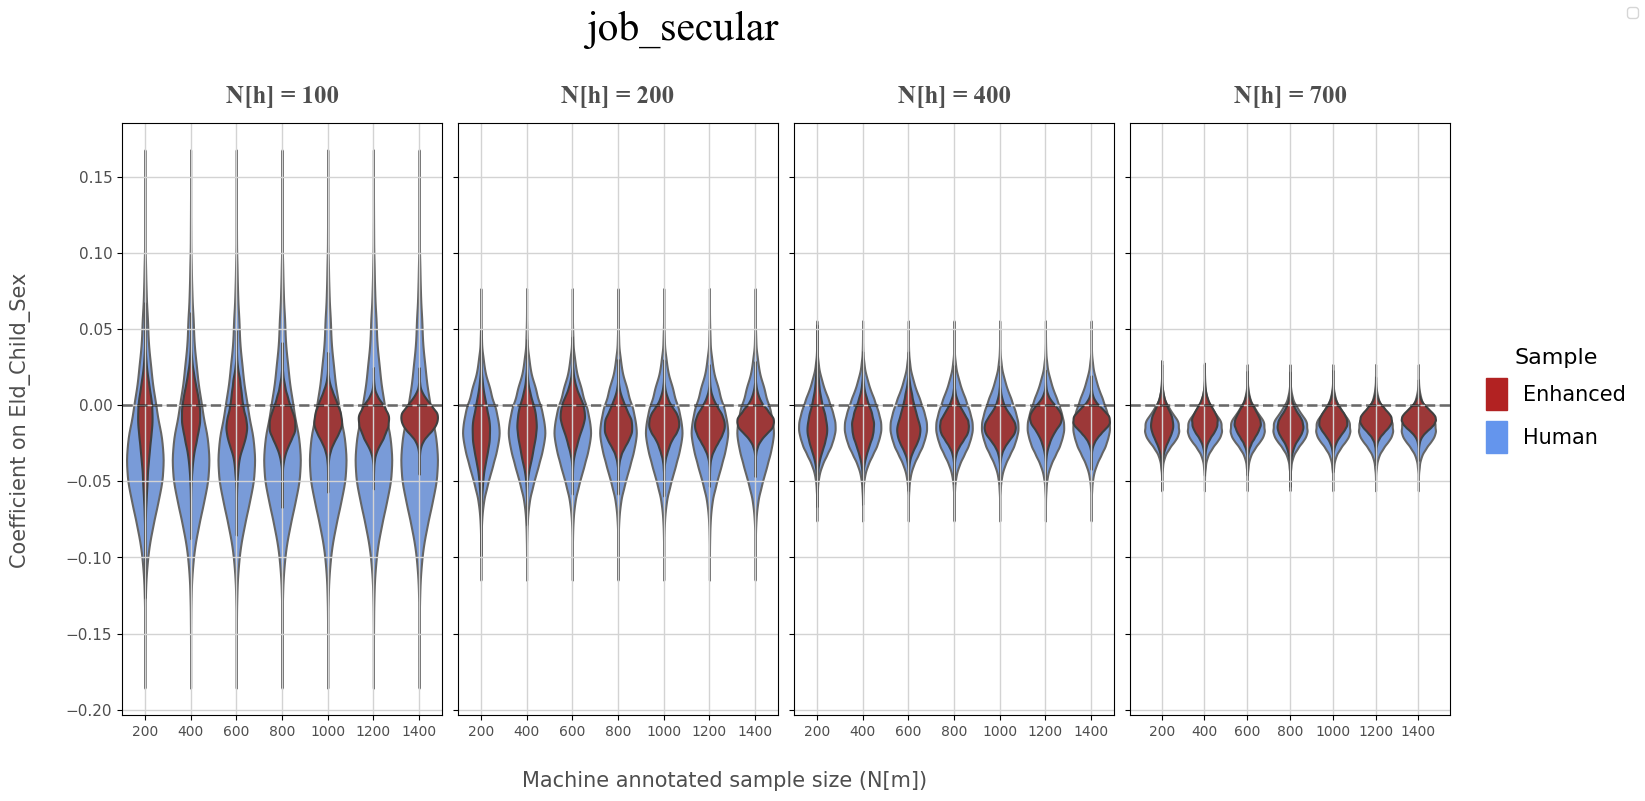
Secular Aspirations (Coefficient on Female eldest child)#
ANNOTATION, REGRESSOR = 'job_secular','eld_child_sex'
coef_df = coef_data.loc[(coef_data['annotation']==ANNOTATION),keep_cols]

fig, axs = plt.subplots(nrows=1, ncols=4, figsize=(16,8), sharey=True, sharex=False)

fig.suptitle(ANNOTATION,x=0.4, y=0.99, fontfamily='Times New Roman',fontsize=30,)

# Iterate over N(h)
for i, human_size in enumerate(HUMAN_SIZES):
    # Get axis
    ax = axs[i]

    # Select subset [n_h = human_size]

    df = coef_df[(coef_df['n_h']==human_size)]

    # Zeroline (dashed)
    ax.axhline(y=0, ls='--',color='black',alpha=0.5, lw=2)

    # Human sample
    sns.violinplot(x=df['n_m'],y=df['human_boot_coef'],
                   ax=ax,dodge=False,inner=None,saturation=0.7,color='cornflowerblue',
                   name=None
                  )

    # Enhanced sample
    sns.violinplot(x=df['n_m'],y=df['enh_boot_coef'],
                   ax=ax,dodge=False,inner=None,saturation=0.7,color='firebrick',
                   name=None
                  )

    # Removing redundant xy axis labels
    ax.set(ylabel=None,xlabel=None)
    ax.tick_params(axis='y',labelsize=11, labelcolor='#4e4e4e')
    ax.tick_params(axis='x',labelsize=10, labelcolor='#4e4e4e')

    ax.grid(True, lw=1, c='lightgray')

    # Subplot title
    ax.set_title(f"N[h] = {human_size}",fontdict={'family':'Times New Roman',
                                            'fontsize':18,
                                            'color':'#4e4e4e',
                                            'fontweight':800
                                           },
                 pad=15
                )


# Add legends
human_patch = plt.plot([], [], color='cornflowerblue', marker='s', markersize=10, linestyle='')[0]
enhanced_patch = plt.plot([], [], color='firebrick',  marker='s', markersize=10, linestyle='')[0]
fig.legend(handles=[human_patch, enhanced_patch], loc='upper right', ncol=2)

# Y-axis label
fig.text(-0.02, 0.3,f"Coefficient on {REGRESSOR.title()}",rotation='vertical',
         fontdict={"fontsize":15,'color':"#4e4e4e"},
        )
# X-axis label
fig.text(0.3, 0.02,f"Machine annotated sample size (N[m])",
         fontdict={"fontsize":15,'color':"#4e4e4e"},
        )

# Layout

# Legend
patches = [
    mpatches.Patch(color='firebrick', label='Enhanced'),
    mpatches.Patch(color='cornflowerblue', label='Human'),
          ]
fig.legend(handles=patches,
           title='Sample',
           title_fontsize=16,
           fontsize=15,
           ncol=1,labelspacing=0.5,
           handlelength=1,handleheight=2,
           loc='center right',frameon=False,
         )
plt.subplots_adjust(top=0.85,wspace=0.05,right=0.88,left=0.05)
plt.show()
