Movement in West Bank Using Mobile Location Data#
This part of the project leverages Veraset Movement data to understand mobility patterns changes in West Bank after the break out of the war. The data is divided in 3 periods:
Period name |
Period description |
Dates |
|---|---|---|
Sep 2023-7th Oct 2023 |
Period before the break out of the war |
09-01-2023 to 10-06-2023 |
7th Oct 2023-Dec 2023 |
First period after the break out of the war |
10-07-2023 to 12-31-2023 |
Jan 2024-20th Mar 2024 |
Second period after the break out of the war |
01-01-2024 - 03-20-2024 |
Note
Veraset Movement is an unfiltered stream of location and proximity data that Veraset has aggregated from data suppliers.
Number of Users Raw Data#
There are 42514 unique users across the whole time period
There are 35852 users that were active less than 5 days
Daily number of users in Veraset data for West Bank
Filter users to keep the ones with enough data.#
The next step is to filter the users that have little records. We applied the following rules:
A minimum of 100 pings across the whole period.
A minimum of 5 active days across the whole period.
50% of the active days should have at least 10 pings.
print('The number of unique users after filtering is {}'.format(df_filtered.uid.nunique().compute()))
The number of unique users after filtering is 1080
Number of unique users in the West Bank per day
Drop in Number of users.#
During the first period after the war breakout we observe a stark decline in the number of daily users that follows:
Date |
Daily number o users |
|---|---|
10-12-2023 |
390 |
10-17-2023 |
287 |
10-18-2023 |
238 |
10-19-2023 |
106 |
The following analysis will try to understand how this significant decline in number of users might affect the interpretation of the results.
We observe that the number of unique users across the three periods is similar. However, the average number of pings per user per day is higher before the war breakout.
| users | Avg pings per user per day | |
|---|---|---|
| Sep 2023-7th Oct 2023 | 672.0 | 53.51 |
| 7th Oct 2023-Dec 2023 | 682.0 | 28.49 |
| Jan 2024-20th Mar 2024 | 602.0 | 34.29 |
We also analyzed the number of users that persisted from one period into the other one. We observe that several users were lost when entering the second period after the war breakout.
There are 233 users present before the war and during the Jan 2024-20th Mar 2024 period
There are 581 users present before the war and during the 7th Oct 2023-Dec 2023 period
There are 270 users present during the 7th Oct 2023-Dec 2023 and Jan 2024-20th Mar 2024 period
The following map shows the percentage of users that persisted during the second period of the war after having visited an hexagon before the war. The map will become useful further in the analysis when we study changes in number of users per hexagon before and after the war breakout.
Finally, we selected some hexagons that we found to have experienced a drop in activity after the war and calcualted the number of unique users that daily visited them. For example, we can observe that the hexagon near Kfar Qasim, 872db00b6ffffff, which experienced a significant reduction in activity during the second period of the war, the reduction happened relative to the overall reduction in number of users. Unfortunately, due to the nature of the data, we cannot confirm whether the reduction in number of users is related to the war itself.
Distribution of Users#
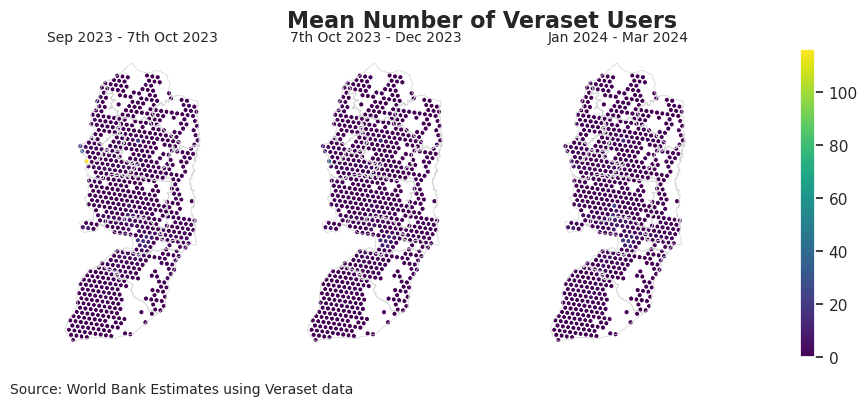
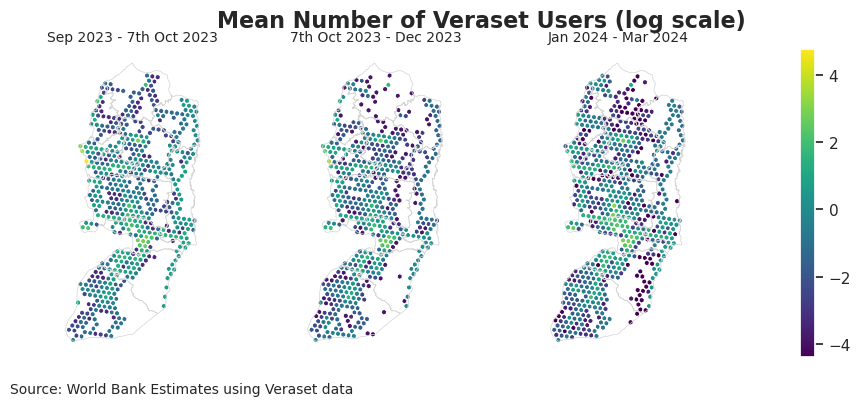
Change in activity Z-Score#
Interactive Map to see change in Z Score
Without the checkpoint in Qalqilya that is skewing the figures
Change in Activity - Spatial Distribution#
Difference in the spatial distribution (no Z-score)
Without the checkpoint in Qalqilya that is skewing the figures
This notebook used Mobilkit
Enrico Ubaldi, Takahiro Yabe, Nicholas Jones, Maham Faisal Khan, Alessandra Feliciotti, Riccardo Di Clemente, Satish V. Ukkusuri and Emanuele Strano Mobilkit: A Python Toolkit for Urban Resilience and Disaster Risk Management Analytics using High Frequency Human Mobility Data, Journal of Open Source Software, 9, 95, 5201, (2024), Doi: 10.21105/joss.05201