BlackMarbleR is a R package that provides a simple way to use nighttime lights data from NASA’s Black Marble. Black Marble is a NASA Earth Science Data Systems (ESDS) project that provides a product suite of daily, monthly and yearly global nighttime lights. This package automates the process of downloading all relevant tiles from the NASA LAADS DAAC to cover a region of interest, converting and mosaicing the raw files (in HDF5 format) to georeferenced rasters.
Installation
The package can be installed via CRAN.
install.packages("blackmarbler")To install the development version from Github:
# install.packages("devtools")
devtools::install_github("worldbank/blackmarbler")
Bearer Token
Follow the below steps to obtain a bearer token:
Create a NASA Earth Data account account. On the top right of the webpage, click “Login” then “Earthdata Login”. Then click “register” (blue button).
-
Enter the information in the registration page. You must include the following information; this information is not required to create an account, but the bearer token will not work without this information:
- Study Area
- User Type
- Organization
Click “Register for EarthData Login” (green button at bottom). Check your email, and click the link in the email to activate the account.
Go to the Earth Data Login page and login.
-
On the panel near the top, click “EULAs” then “Accept New EULAs”. Accept:
- MERIS EULA
- Sentinel EULA
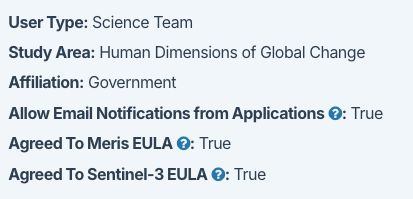
On the “Profile Home” page, you should see something like below. Information should be filled in for each category, and “Agreed To Meris EULA” and “Agreed To Sentinel-3 EULA” should be True.
Go to the NASA LAADS Archive and login (login button on top right). You will see a page to authorize use of Sentinel3 and Meris. Click the green “Authorize” button.
To obtain the bearer token, go to the Earth Data Login page and login. On the top panel, click “Generate token”. On this page, click “Show Token” to see the bearer token.
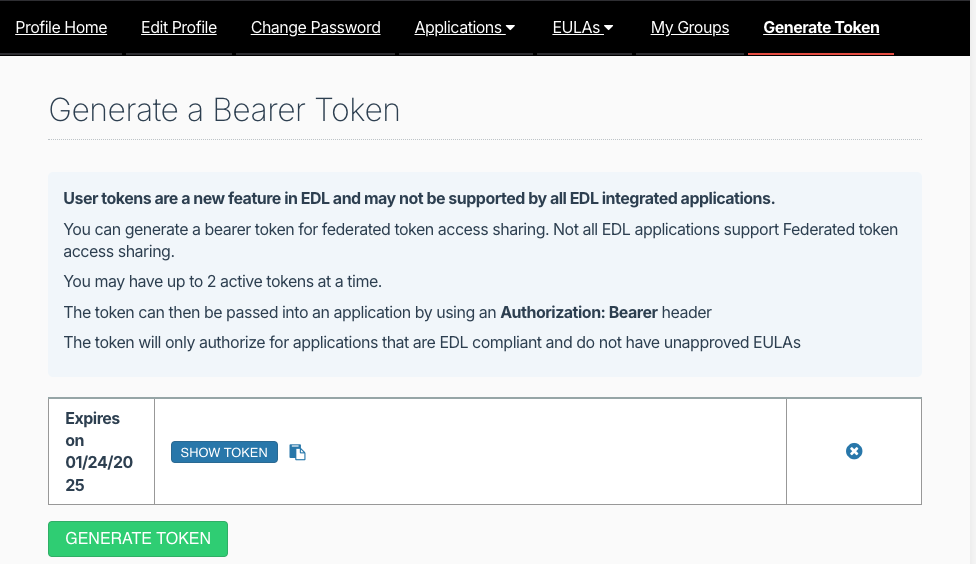
- If the bearer token ever stops working, you make need to go to the “Generate token” page (see step 8), delete any existing tokens, and generate a new token.
Programmatically retrieve token
After following the above steps, the bearer token can also be programmatically retrieved using the get_nasa_token() function and your usename and password.
bearer <- get_nasa_token(username = "USERNAME-HERE",
                         password = "PASSWORD-HERE")
Usage
Setup
Before downloading and extracting Black Marble data, we first load packages, define the NASA bearer token, and define a region of interest.
#### Setup
# Load packages
library(blackmarbler)
library(geodata)
library(sf)
library(terra)
library(ggplot2)
library(tidyterra)
library(lubridate)

#### Define NASA bearer token
bearer <- "BEARER-TOKEN-HERE"

### ROI
# Define region of interest (roi). The roi must be (1) an sf polygon and (2)
# in the WGS84 (epsg:4326) coordinate reference system. Here, we use the
# getData function to load a polygon of Ghana
roi_sf <- gadm(country = "GHA", level=1, path = tempdir())
Make raster of nighttime lights
The below example shows making daily, monthly, and annual rasters of nighttime lights for Ghana.
### Daily data: raster for February 5, 2021
r_20210205 <- bm_raster(roi_sf = roi_sf,
                        product_id = "VNP46A2",
                        date = "2021-02-05",
                        bearer = bearer)

### Monthly data: raster for October 2021
r_202110 <- bm_raster(roi_sf = roi_sf,
                      product_id = "VNP46A3",
                      date = "2021-10-01", # The day is ignored
                      bearer = bearer)

### Annual data: raster for 2021
r_2021 <- bm_raster(roi_sf = roi_sf,
                    product_id = "VNP46A4",
                    date = 2021,
                    bearer = bearer)
Make raster of nighttime lights across multiple time periods
To extract data for multiple time periods, add multiple time periods to date. The function will return a SpatRaster object with multiple bands, where each band corresponds to a different date. The below code provides examples getting data across multiple days, months, and years.
#### Daily data in March 2021
r_daily <- bm_raster(roi_sf = roi_sf,
                     product_id = "VNP46A2",
                     date = seq.Date(from = ymd("2021-03-01"), to = ymd("2021-03-31"), by = "day"),
                     bearer = bearer)

#### Monthly aggregated data in 2021 and 2022
r_monthly <- bm_raster(roi_sf = roi_sf,
                       product_id = "VNP46A3",
                       date = seq.Date(from = ymd("2021-01-01"), to = ymd("2022-12-01"), by = "month"),
                       bearer = bearer)

#### Yearly aggregated data in 2012 and 2021
r_annual <- bm_raster(roi_sf = roi_sf,
                      product_id = "VNP46A4",
                      date = 2012:2021,
                      bearer = bearer)
Map of nighttime lights
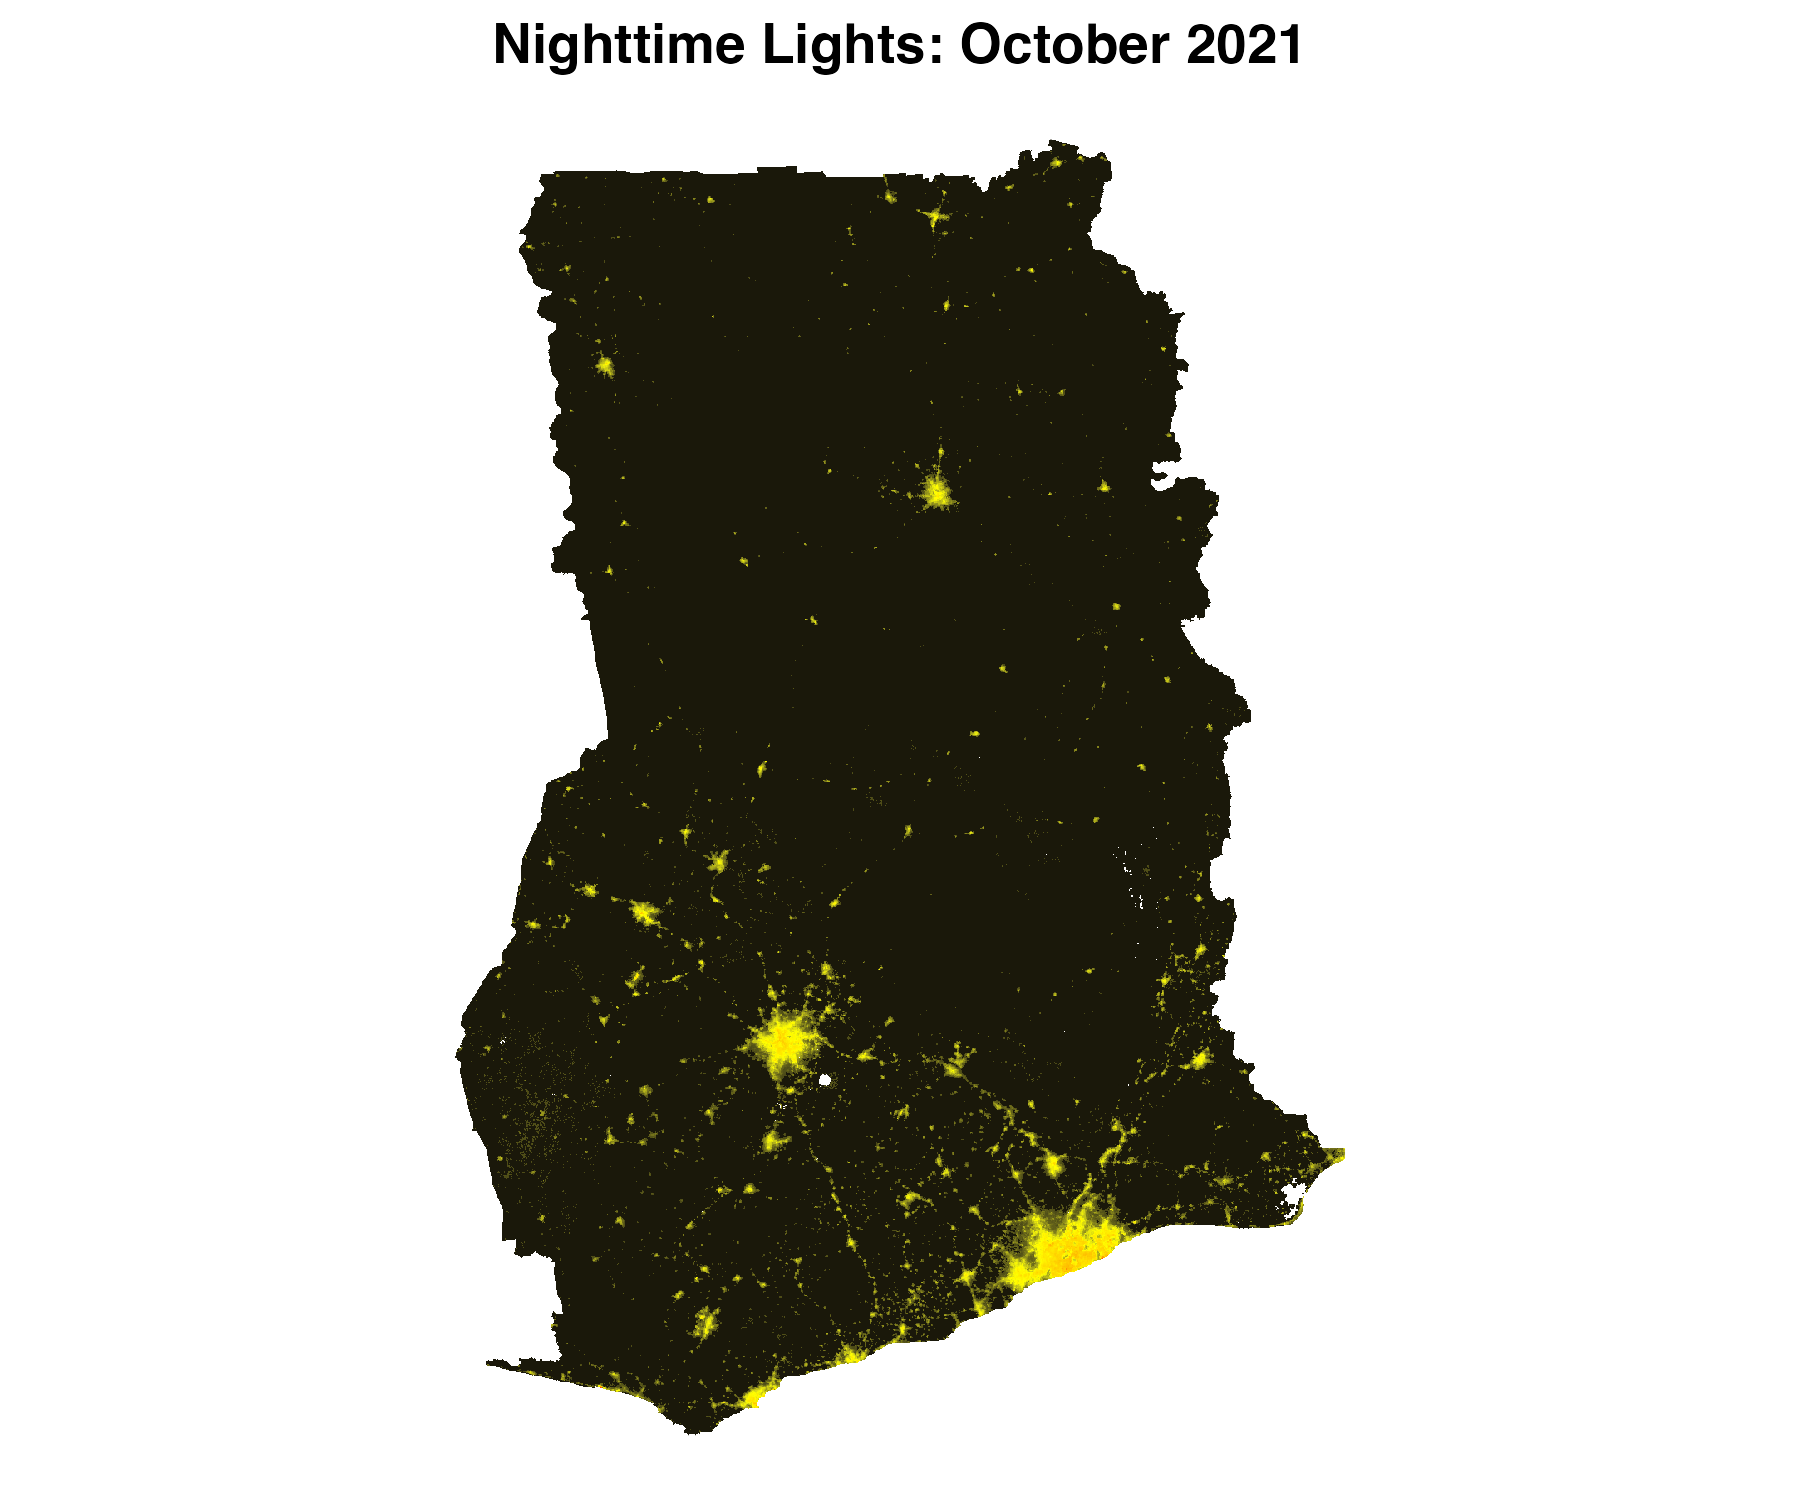
Using one of the rasters, we can make a map of nighttime lights
#### Make raster
r <- bm_raster(roi_sf = roi_sf,
               product_id = "VNP46A3",
               date = "2021-10-01",
               bearer = bearer)

#### Prep data
r <- r |> terra::mask(roi_sf)

## Distribution is skewed, so log
r[] <- log(r[] + 1)

##### Map
ggplot() +
  geom_spatraster(data = r) +
  scale_fill_gradient2(low = "black",
                       mid = "yellow",
                       high = "red",
                       midpoint = 4.5,
                       na.value = "transparent") +
  labs(title = "Nighttime Lights: October 2021") +
  coord_sf() +
  theme_void() +
  theme(plot.title = element_text(face = "bold", hjust = 0.5),
  legend.position = "none")
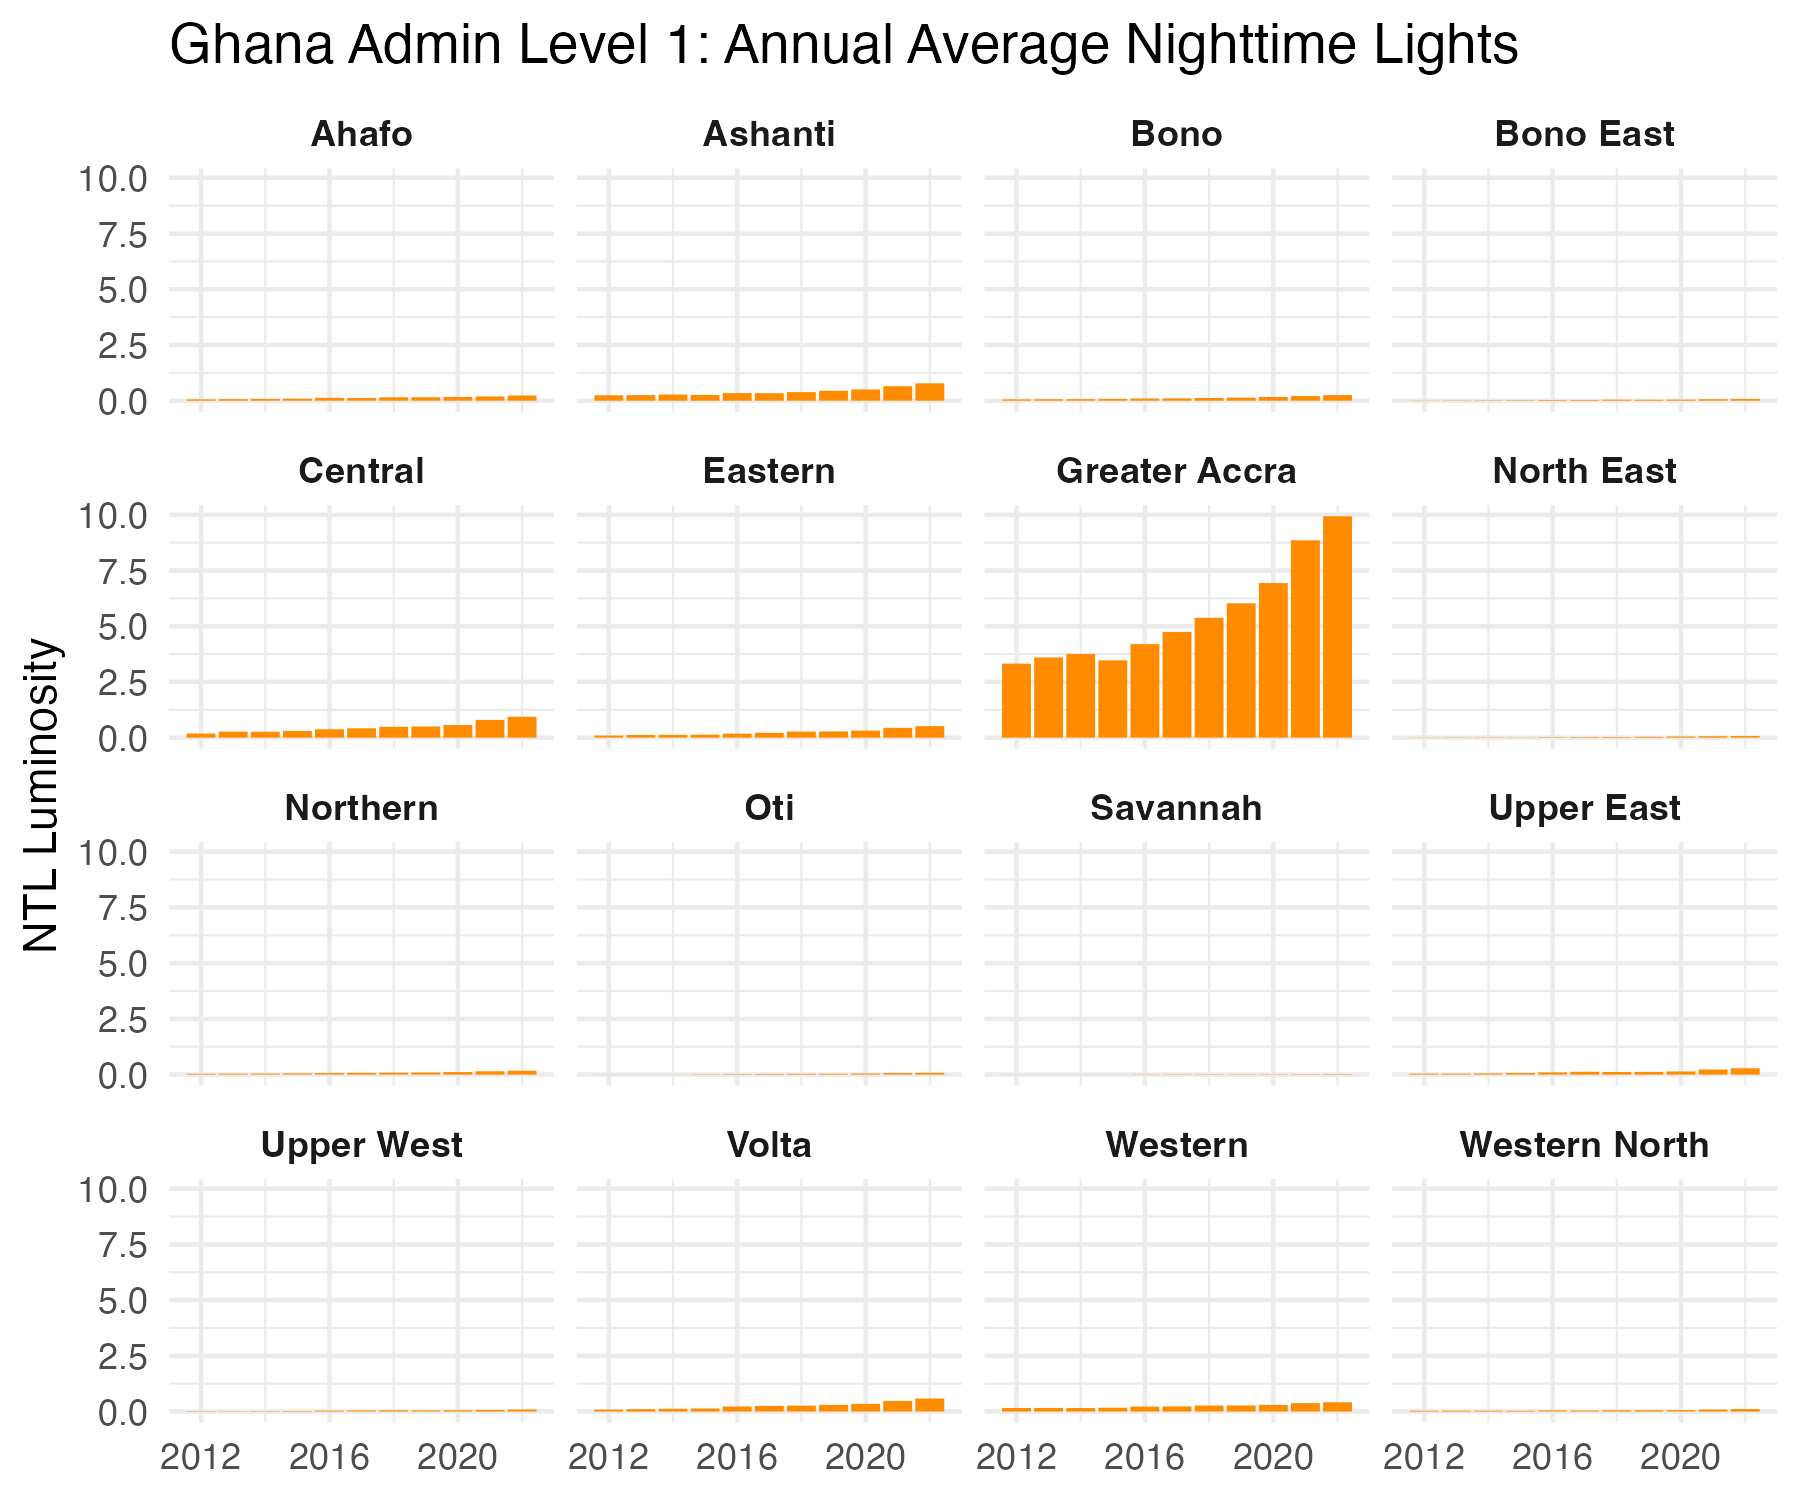
Trends over time
We can use the bm_extract function to observe changes in nighttime lights over time. The bm_extract function leverages the exactextractr package to aggregate nighttime lights data to polygons. Below we show trends in annual nighttime lights data across Ghana’s first administrative divisions.
#### Extract annual data
ntl_df <- bm_extract(roi_sf = roi_sf,
                     product_id = "VNP46A4",
                     date = 2012:2022,
                     bearer = bearer)

#### Trends over time
ntl_df |>
  ggplot() +
  geom_col(aes(x = date,
  y = ntl_mean),
  fill = "darkorange") +
  facet_wrap(~NAME_1) +
  labs(x = NULL,
       y = "NTL Luminosity",
       title = "Ghana Admin Level 1: Annual Average Nighttime Lights") +
  scale_x_continuous(labels = seq(2012, 2022, 4),
                     breaks = seq(2012, 2022, 4)) +
  theme_minimal() +
  theme(strip.text = element_text(face = "bold"))
Workflow to update data
Some users may want to monitor near-real-time changes in nighttime lights. For example, daily Black Marble nighttime lights data is updated regularly, where data is available roughly on a week delay; same use cases may require examining trends in daily nighttime lights data as new data becomes available. Below shows example code that could be regularly run to produce an updated daily dataset of nighttime lights.
The below code produces a dataframe of nighttime lights for each date, where average nighttime lights for Ghana’s 1st administrative division is produced. The code will check whether data has already been downloaded/extracted for a specific date, and only download/extract new data.
# Create directories to store data
dir.create(file.path(getwd(), "bm_files"))
dir.create(file.path(getwd(), "bm_files", "daily"))

# Extract daily-level nighttime lights data for Ghana's first administrative divisions.
# Save a separate dataset for each date in the `"~/Desktop/bm_files/daily"` directory.
# The code extracts data from January 1, 2023 to today. Given that daily nighttime lights
# data is produced on roughly a week delay, the function will only extract data that exists;
# it will skip extracting data for dates where data has not yet been produced by NASA Black Marble.
bm_extract(roi_sf = roi_sf,
           product_id = "VNP46A2",
           date = seq.Date(from = ymd("2023-01-01"), to = Sys.Date(), by = 1),
           bearer = bearer,
           output_location_type = "file",
           file_dir = file.path(getwd(), "bm_files", "daily"))

# Append daily-level datasets into one file
file.path(getwd(), "bm_files", "daily") |>
  list.files(pattern = "*.Rds",
  full.names = T) |>
  map_df(readRDS) |>
  saveRDS(file.path(getwd(), "bm_files", "ntl_daily.Rds"))
Functions and arguments
Functions
The package provides two functions.
-
bm_rasterproduces a raster of Black Marble nighttime lights. -
bm_extractproduces a dataframe of aggregated nighttime lights to a region of interest (e.g., average nighttime lights within US States).
Both functions take the following arguments:
Required arguments
roi_sf: Region of interest; sf polygon. Must be in the WGS 84 (epsg:4326) coordinate reference system. For
bm_extract, aggregates nighttime lights within each polygon ofroi_sf.-
product_id: One of the following:
-
"VNP46A1": Daily (raw) -
"VNP46A2": Daily (corrected) -
"VNP46A3": Monthly -
"VNP46A4": Annual
-
-
date: Date of raster data. Entering one date will produce a
SpatRasterobject. Entering multiple dates will produce aSpatRasterobject with multiple bands; one band per date.- For
product_ids"VNP46A1"and"VNP46A2", a date (eg,"2021-10-03"). - For
product_id"VNP46A3", a date or year-month (e.g.,"2021-10-01", where the day will be ignored, or"2021-10"). - For
product_id"VNP46A4", year or date (e.g.,"2021-10-01", where the month and day will be ignored, or2021).
- For
bearer: NASA bearer token. For instructions on how to create a token, see here.
Optional arguments
-
variable: Variable to used to create raster (default:
NULL). To see all variable choices, setvariable = ""(this will create an error message that lists all valid variables). For additional information on all variable choices, see here; forVNP46A1, see Table 3; forVNP46A2see Table 6; forVNP46A3andVNP46A4, see Table 9. IfNULL, uses the following default variables:- For
product_id"VNP46A1", usesDNB_At_Sensor_Radiance_500m. - For
product_id"VNP46A2", usesGap_Filled_DNB_BRDF-Corrected_NTL. - For
product_ids"VNP46A3"and"VNP46A4", usesNearNadir_Composite_Snow_Free.
- For
-
quality_flag_rm: Quality flag values to use to set values to
NA. Each pixel has a quality flag value, where low quality values can be removed. Values are set toNAfor each value in therquality_flag_rmvector. (Default:NULL).- For
VNP46A1andVNP46A2(daily data):-
0: High-quality, Persistent nighttime lights -
1: High-quality, Ephemeral nighttime Lights -
2: Poor-quality, Outlier, potential cloud contamination, or other issues
-
- For
VNP46A3andVNP46A4(monthly and annual data):-
0: Good-quality, The number of observations used for the composite is larger than 3 -
1: Poor-quality, The number of observations used for the composite is less than or equal to 3 -
2: Gap filled NTL based on historical data
-
- For
check_all_tiles_exist: Check whether all Black Marble nighttime light tiles exist for the region of interest. Sometimes not all tiles are available, so the full region of interest may not be covered. If
TRUE, skips cases where not all tiles are available. (Default:TRUE).interpol_na: When data for more than one date is downloaded, whether to interpolate
NAvalues in rasters using theterra::approximatefunction. Additional arguments for theterra::approximatefunction can also be passed intobm_raster/bm_extract(eg,method,rule,f,ties,z,NA_rule). (Default:FALSE).h5_dir: Black Marble data are originally downloaded as
h5files. Ifh5_dir = NULL, the function downloads to a temporary directory then deletes the directory. Ifh5_diris set to a path,h5files are saved to that directory and not deleted. The function will then check if the neededh5file already exists in the directory; if it exists, the function will not re-download theh5file.download_method: Method to download data (h5 files) from NASA LAADS Archive: “
httr” or “wget”. Ifhttr, uses thehttr2R package to download data. Ifwget, uses thewgetcommand line tool.httris fully integrated in R, whilewgetrequires thewgetsystem command.wgetcan be more efficient and can help avoid network issues. (Default:"httr").-
output_location_type: Where output should be stored (default:
r_memory). Either:-
r_memorywhere the function will return an output in R -
filewhere the function will export the data as a file. Forbm_raster, a.tiffile will be saved; forbm_extract, a.Rdsfile will be saved. A file is saved for each date. Consequently, ifdate = c(2018, 2019, 2020), three datasets will be saved: one for each year. Saving a dataset for each date can facilitate re-running the function later and only downloading data for dates where data have not been downloaded.
-
If output_location_type = "file", the following arguments can be used:
file_dir: The directory where data should be exported (default:
NULL, so the working directory will be used)file_prefix: Prefix to add to the file to be saved. The file will be saved as the following:
[file_prefix][product_id]_t[date].[tif/Rds]file_skip_if_exists: Whether the function should first check wither the file already exists, and to skip downloading or extracting data if the data for that date if the file already exists (default:
TRUE). If the function is first run withdate = c(2018, 2019, 2020), then is later run withdate = c(2018, 2019, 2020, 2021), the function will only download/extract data for 2021. Skipping existing files can facilitate re-running the function at a later date to download only more recent data.file_return_null: Whether to return
NULLinstead of a output to R (SpatRasterordataframe). Whenoutput_location_type = 'file', the function will export data to thefile_dirdirectory. Whenfile_return_null = FALSE, the function will also return the queried data—so the data is available in R memory. Settingfile_return_null = TRUE, data will be saved tofile_dirbut no data will be returned by the function to R memory (default:FALSE).…: Additional arguments for
terra::approximate, ifinterpol_na = TRUE
Argument for bm_extract only
-
aggregation_fun: A vector of functions to aggregate data (default:
"mean"). Theexact_extractfunction from theexactextractrpackage is used for aggregations; this parameter is passed tofunargument inexactextractr::exact_extract. -
add_n_pixels: Whether to add a variable indicating the number of nighttime light pixels used to compute nighttime lights statistics (eg, number of pixels used to compute average of nighttime lights). When
TRUE, it adds three values:n_non_na_pixels(the number of non-NApixels used for computing nighttime light statistics);n_pixels(the total number of pixels); andprop_non_na_pixelsthe proportion of the two. (Default:TRUE).