stata
Stata Commands for Data Management and Analysis
World Bank Stata GitHub
This website is a hub for Stata practices from the DIME Analytics team.
DIME Analytics Public Resources
DIME Analytics Code
- Reproducible Research Toolkit
- Impact Evaluations Toolkit
- Impact Evaluations Fieldkit
- Stata Visual Library
- High-Frequency Data Quality Checks Dashboard
- Distributional Impact Analysis Toolkit
DIME Analytics Blogposts
- IE Analytics: Introducing the Development Impact Evaluation Wiki
- IE analytics: introducing ietoolkit
- Tools of the trade: Using iemargins to graph impacts with standard error bars (IE Analytics update)
Other useful commands:
Bar graphs with CIs
Making graphs with confidence intervals in Stata is now easy! Here’s an example using betterbar:
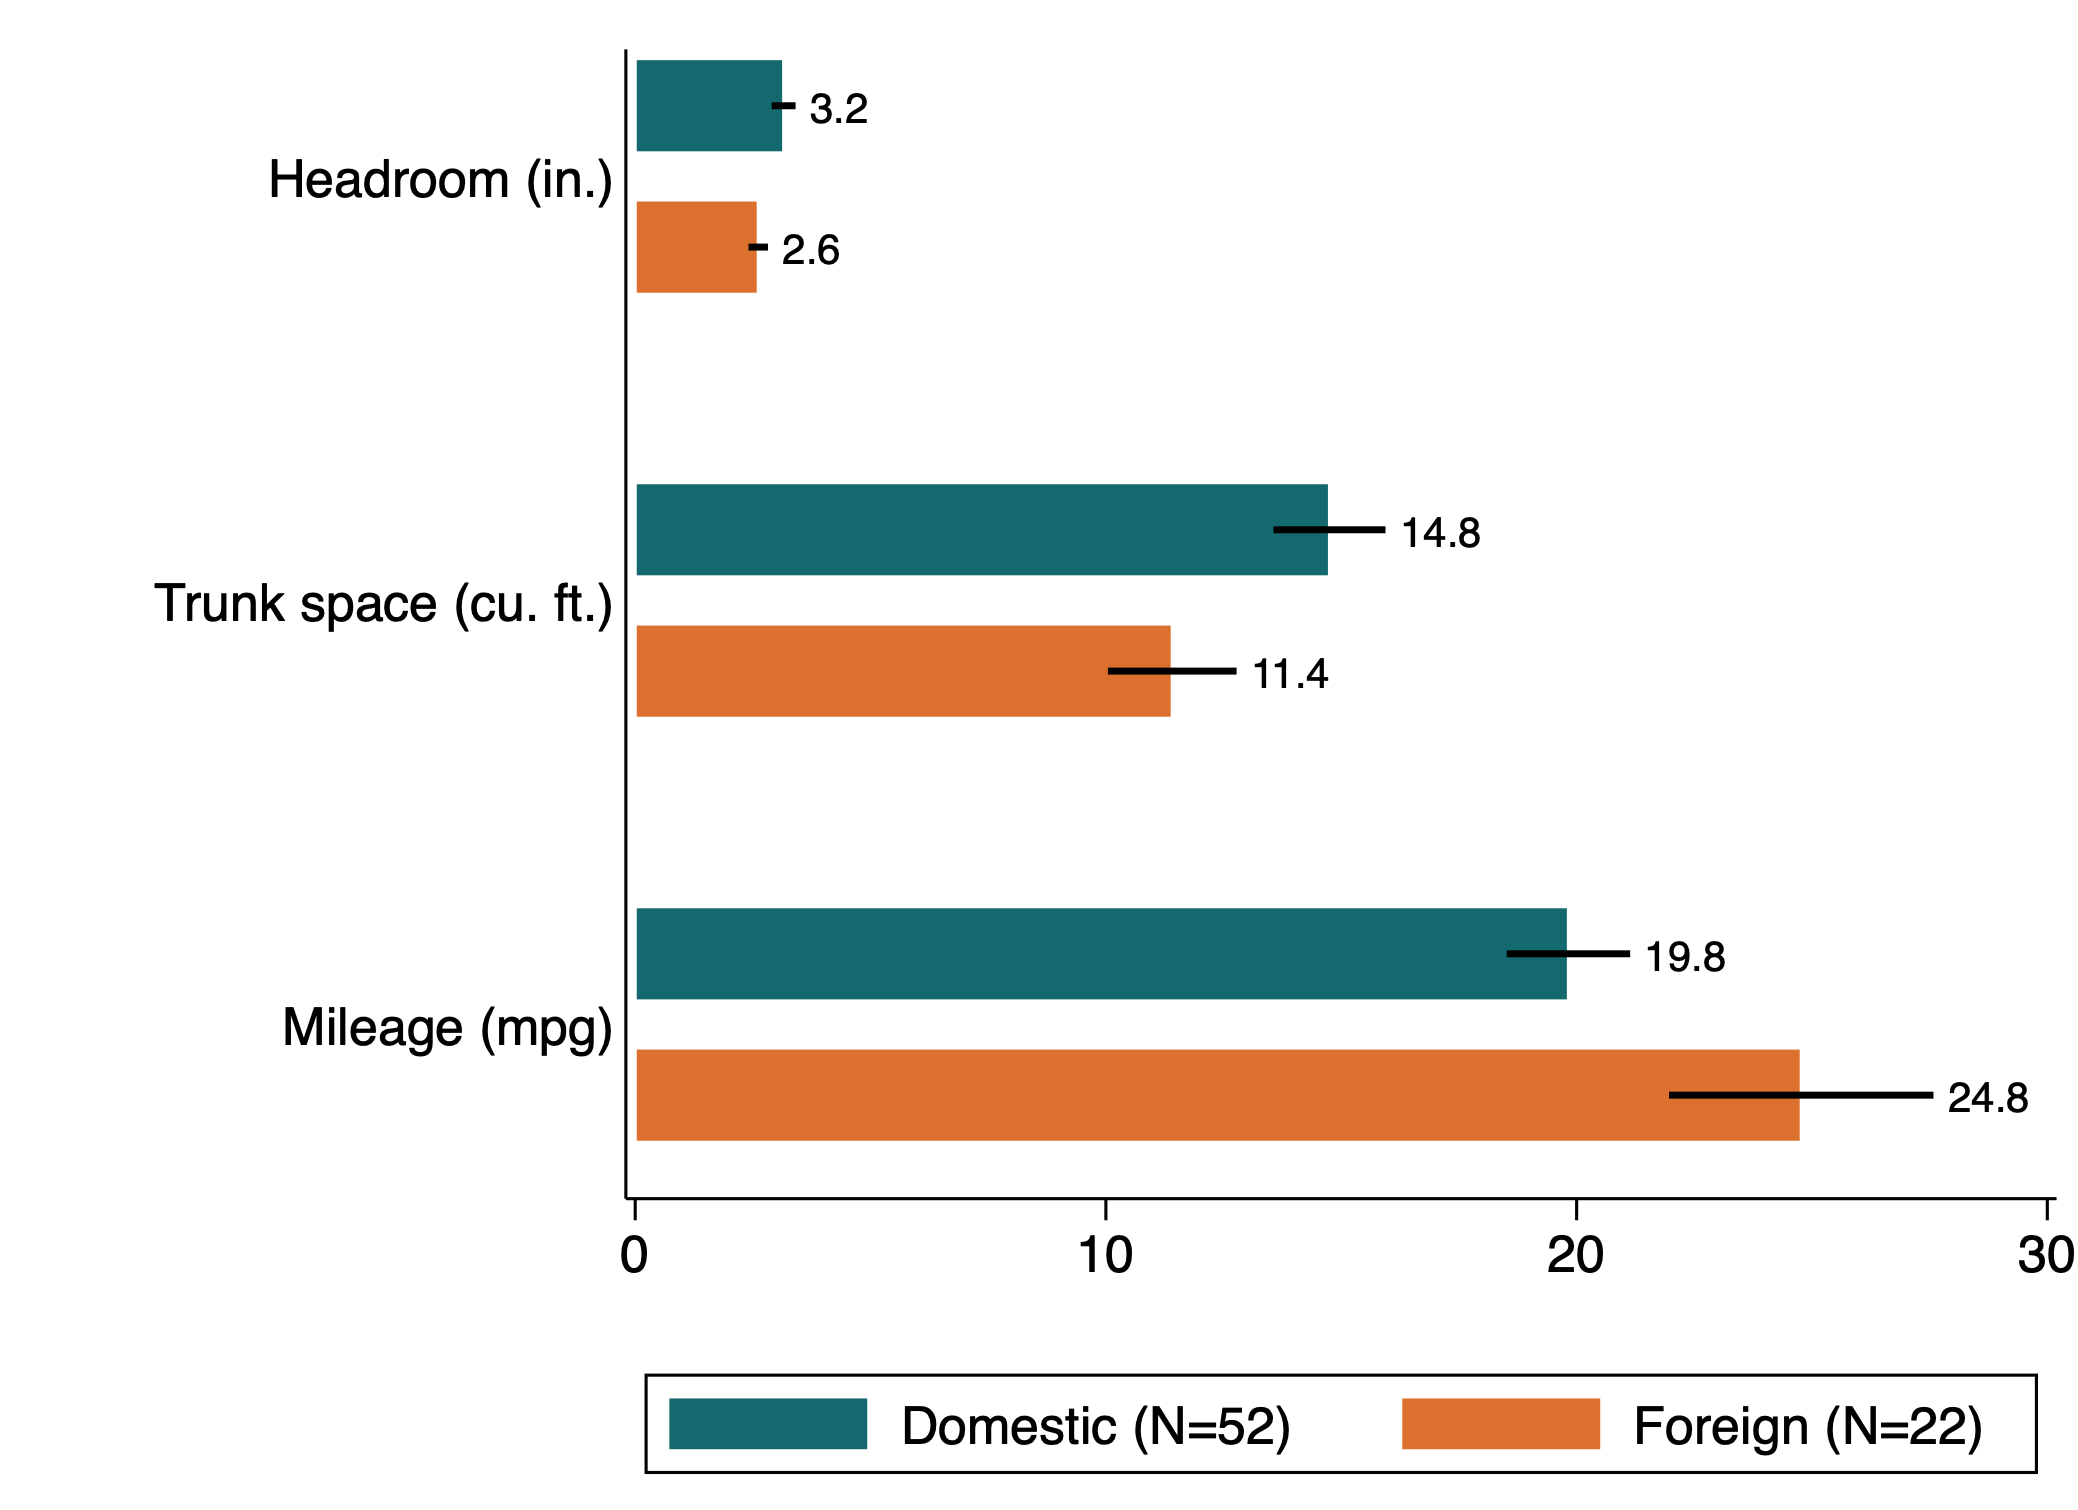
ssc install betterbar
sysuse auto.dta , clear
betterbarci ///
  headroom trunk mpg ///
  , over(foreign) legend(on)
Thanks to Gray Kimbrough for the Uncluttered Stata Graph Theme.
Treatment effect graphs
Visualizing treatment effects on multiple outcomes with Stata is now easy! Here’s an example using forest:
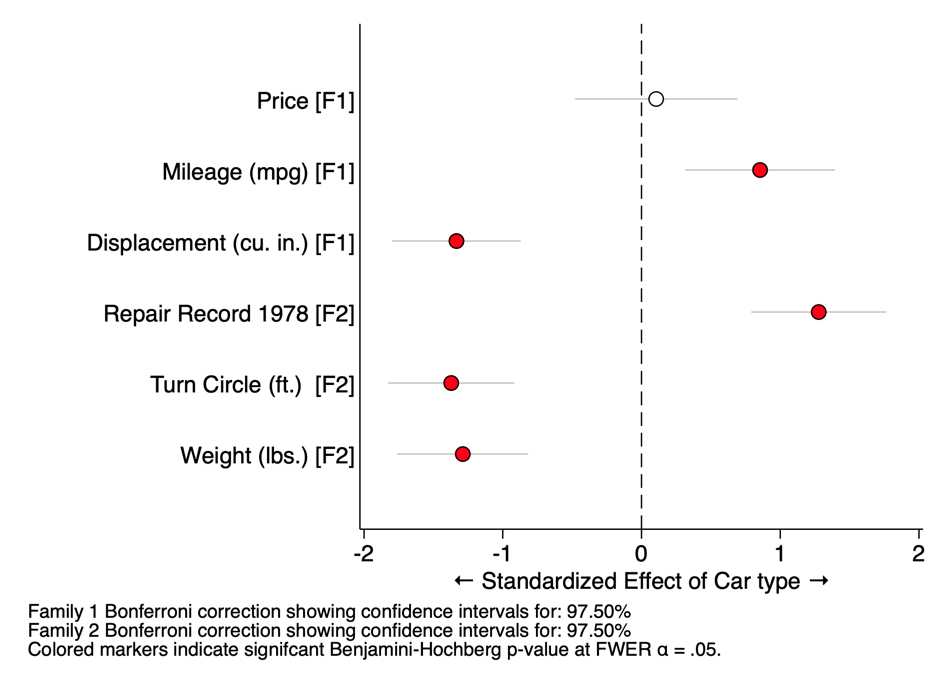
ssc install forest

global tw_opts ///
	title(, justification(left) color(black) span pos(11)) ///
    graphregion(color(white) lc(white) lw(med)) bgcolor(white) ///
    ylab(,angle(0) nogrid) xtit(,placement(left) justification(left)) ///
    yscale(noline) xscale(noline) legend(region(lc(none) fc(none)))

sysuse auto.dta , clear
forest reg mpg headroom trunk = displacement , graph($tw_opts)
forest visualizes results from multiple regressions on a single independent variable. The resulting “forest” chart shows the effect of a single treatment variable of interest on a set of independent variables. It can display raw coefficients, standardized effect sizes (Cohen’s d), or odds ratios (from logistic regressions). It can also make Bonferroni corrections to the confidence intervals for multiple comparisons.
Quick regression tables
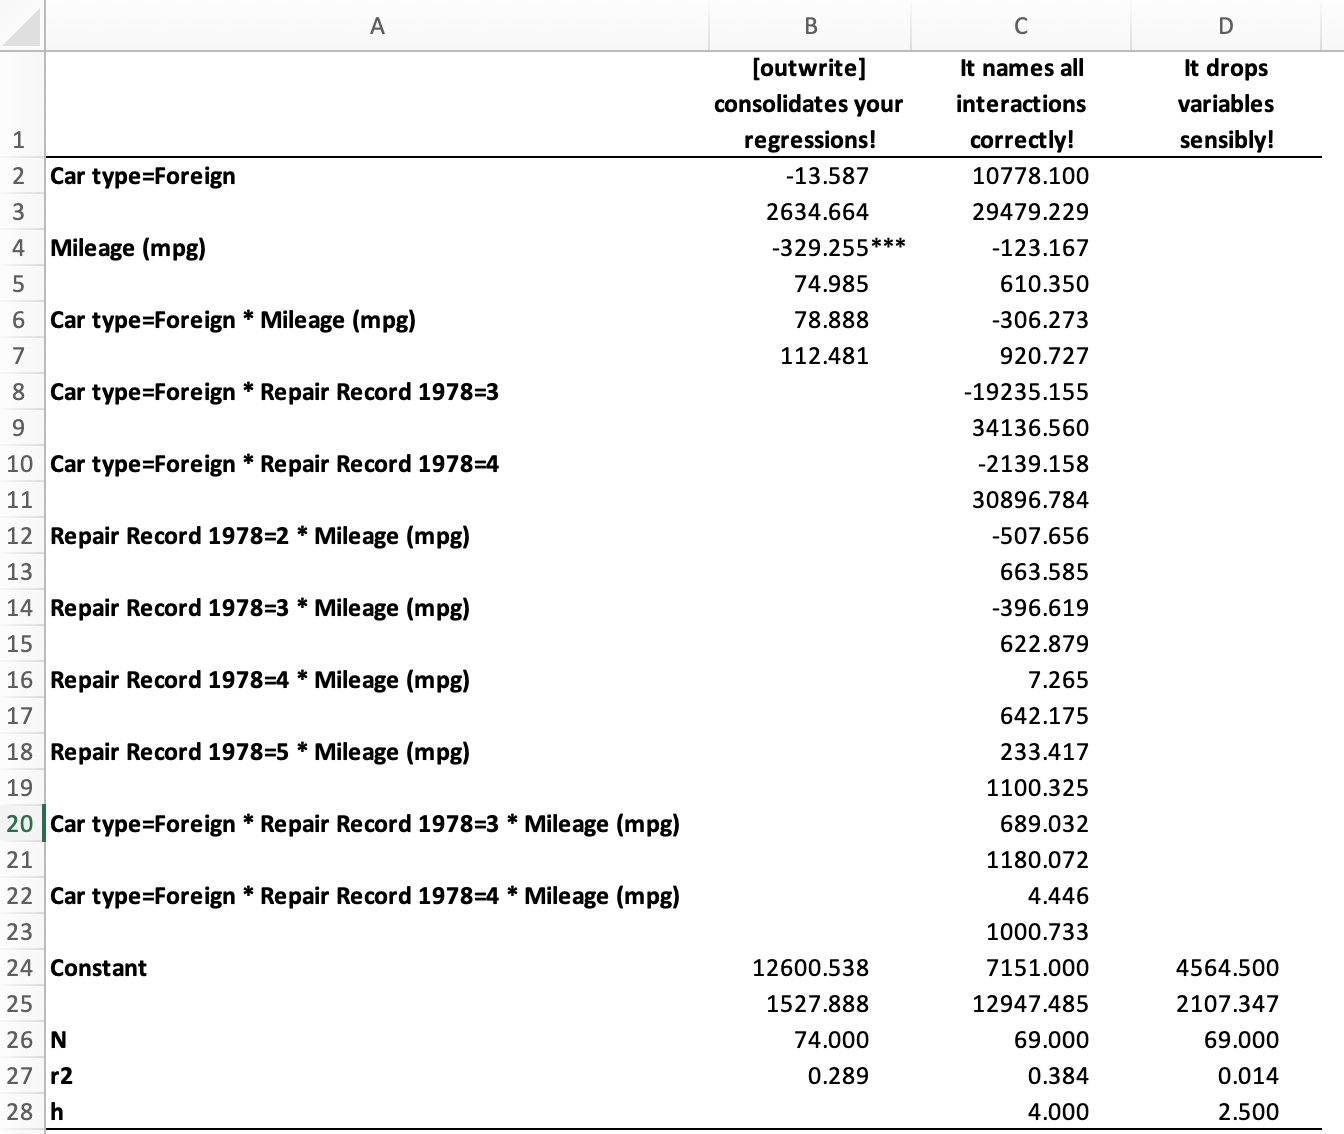
outwrite reads multiple regressions saved with estimates store, consolidates them into a
single table, and exports the results to a .xlsx, .xls, .csv, or .tex file:
ssc install outwrite

sysuse auto.dta, clear
  reg price i.foreign##c.mpg
  est sto reg1
  reg price i.foreign##c.mpg##i.rep78
  est sto reg2
  estadd scalar h = 4
  reg price i.rep78
  est sto reg3
  estadd scalar h = 2.5

outwrite reg1 reg2 reg3 using "test.xlsx" ///
 , stats(N r2 h)  replace col("TEST" "(2)") drop(i.rep78) format(%9.3f)
Alternatively, as a programming command, it will accept a single matrix and print that; it will also look for matrix_STARS and affix that number of stars to each cell.
Summary statistics tables
Making tables of summary statistics with Stata is now easy! Here’s an example using sumstats:
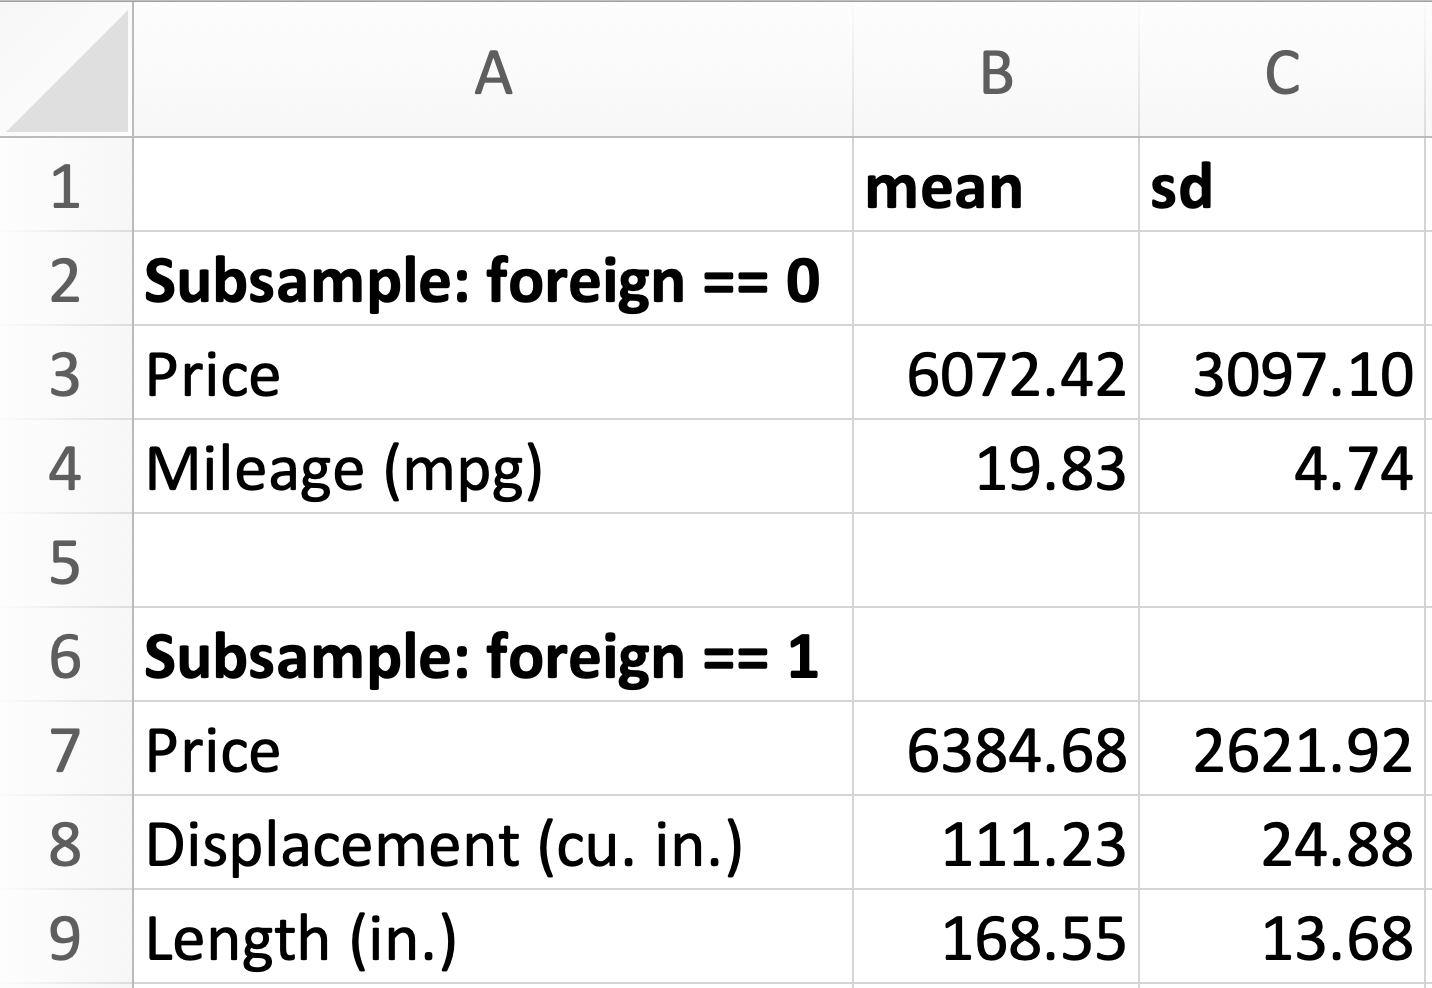
ssc install sumstats
sysuse auto.dta , clear
sumstats  ///
  (price mpg if foreign == 0) ///
  (price displacement length if foreign == 1) ///
  using "test.xlsx" , replace stats(mean sd)
Unique IDs
Making best-practice unique IDs in Stata is now easy! Here’s an example using makeid:
. ssc install makeid
. sysuse auto.dta , clear
(1978 Automobile Data)

. makeid foreign make , gen(uniqueid) project(Demo)
(data now sorted by foreign make)
(data now sorted by uniqueid)

. de uniqueid

              storage   display    value
variable name   type    format     label      variable label
----------------------------------------------------------------------
uniqueid        str4    %9s                   Demo ID: foreign + make

. list foreign make uniqueid in 1/5

     +-------------------------------------+
     |  foreign   make            uniqueid |
     |-------------------------------------|
  1. | Domestic   AMC Concord         D101 |
  2. | Domestic   AMC Pacer           D102 |
  3. | Domestic   AMC Spirit          D103 |
  4. | Domestic   Buick Century       D104 |
  5. | Domestic   Buick Electra       D105 |
     +-------------------------------------+

. list foreign make uniqueid in 53/57

     +---------------------------------+
     | foreign   make         uniqueid |
     |---------------------------------|
 53. | Foreign   Audi 5000        D201 |
 54. | Foreign   Audi Fox         D202 |
 55. | Foreign   BMW 320i         D203 |
 56. | Foreign   Datsun 200       D204 |
 57. | Foreign   Datsun 210       D205 |
     +---------------------------------+
makeid creates a unique ID for every observation in the dataset, based on strata-type variables.
For example, given a variable list such as country state district name, a unique ID is returned for every observation such that:
- Country code in the ID is fully unique
- State code in the ID is unique within country
- District code in the ID is unique within country and state
- Each name has a unique ID within country, state, and district.
makeid prefixes each ID with the first letter of the project name, as a best practice to prevent against automatic conversion to numbers in Excel for example.
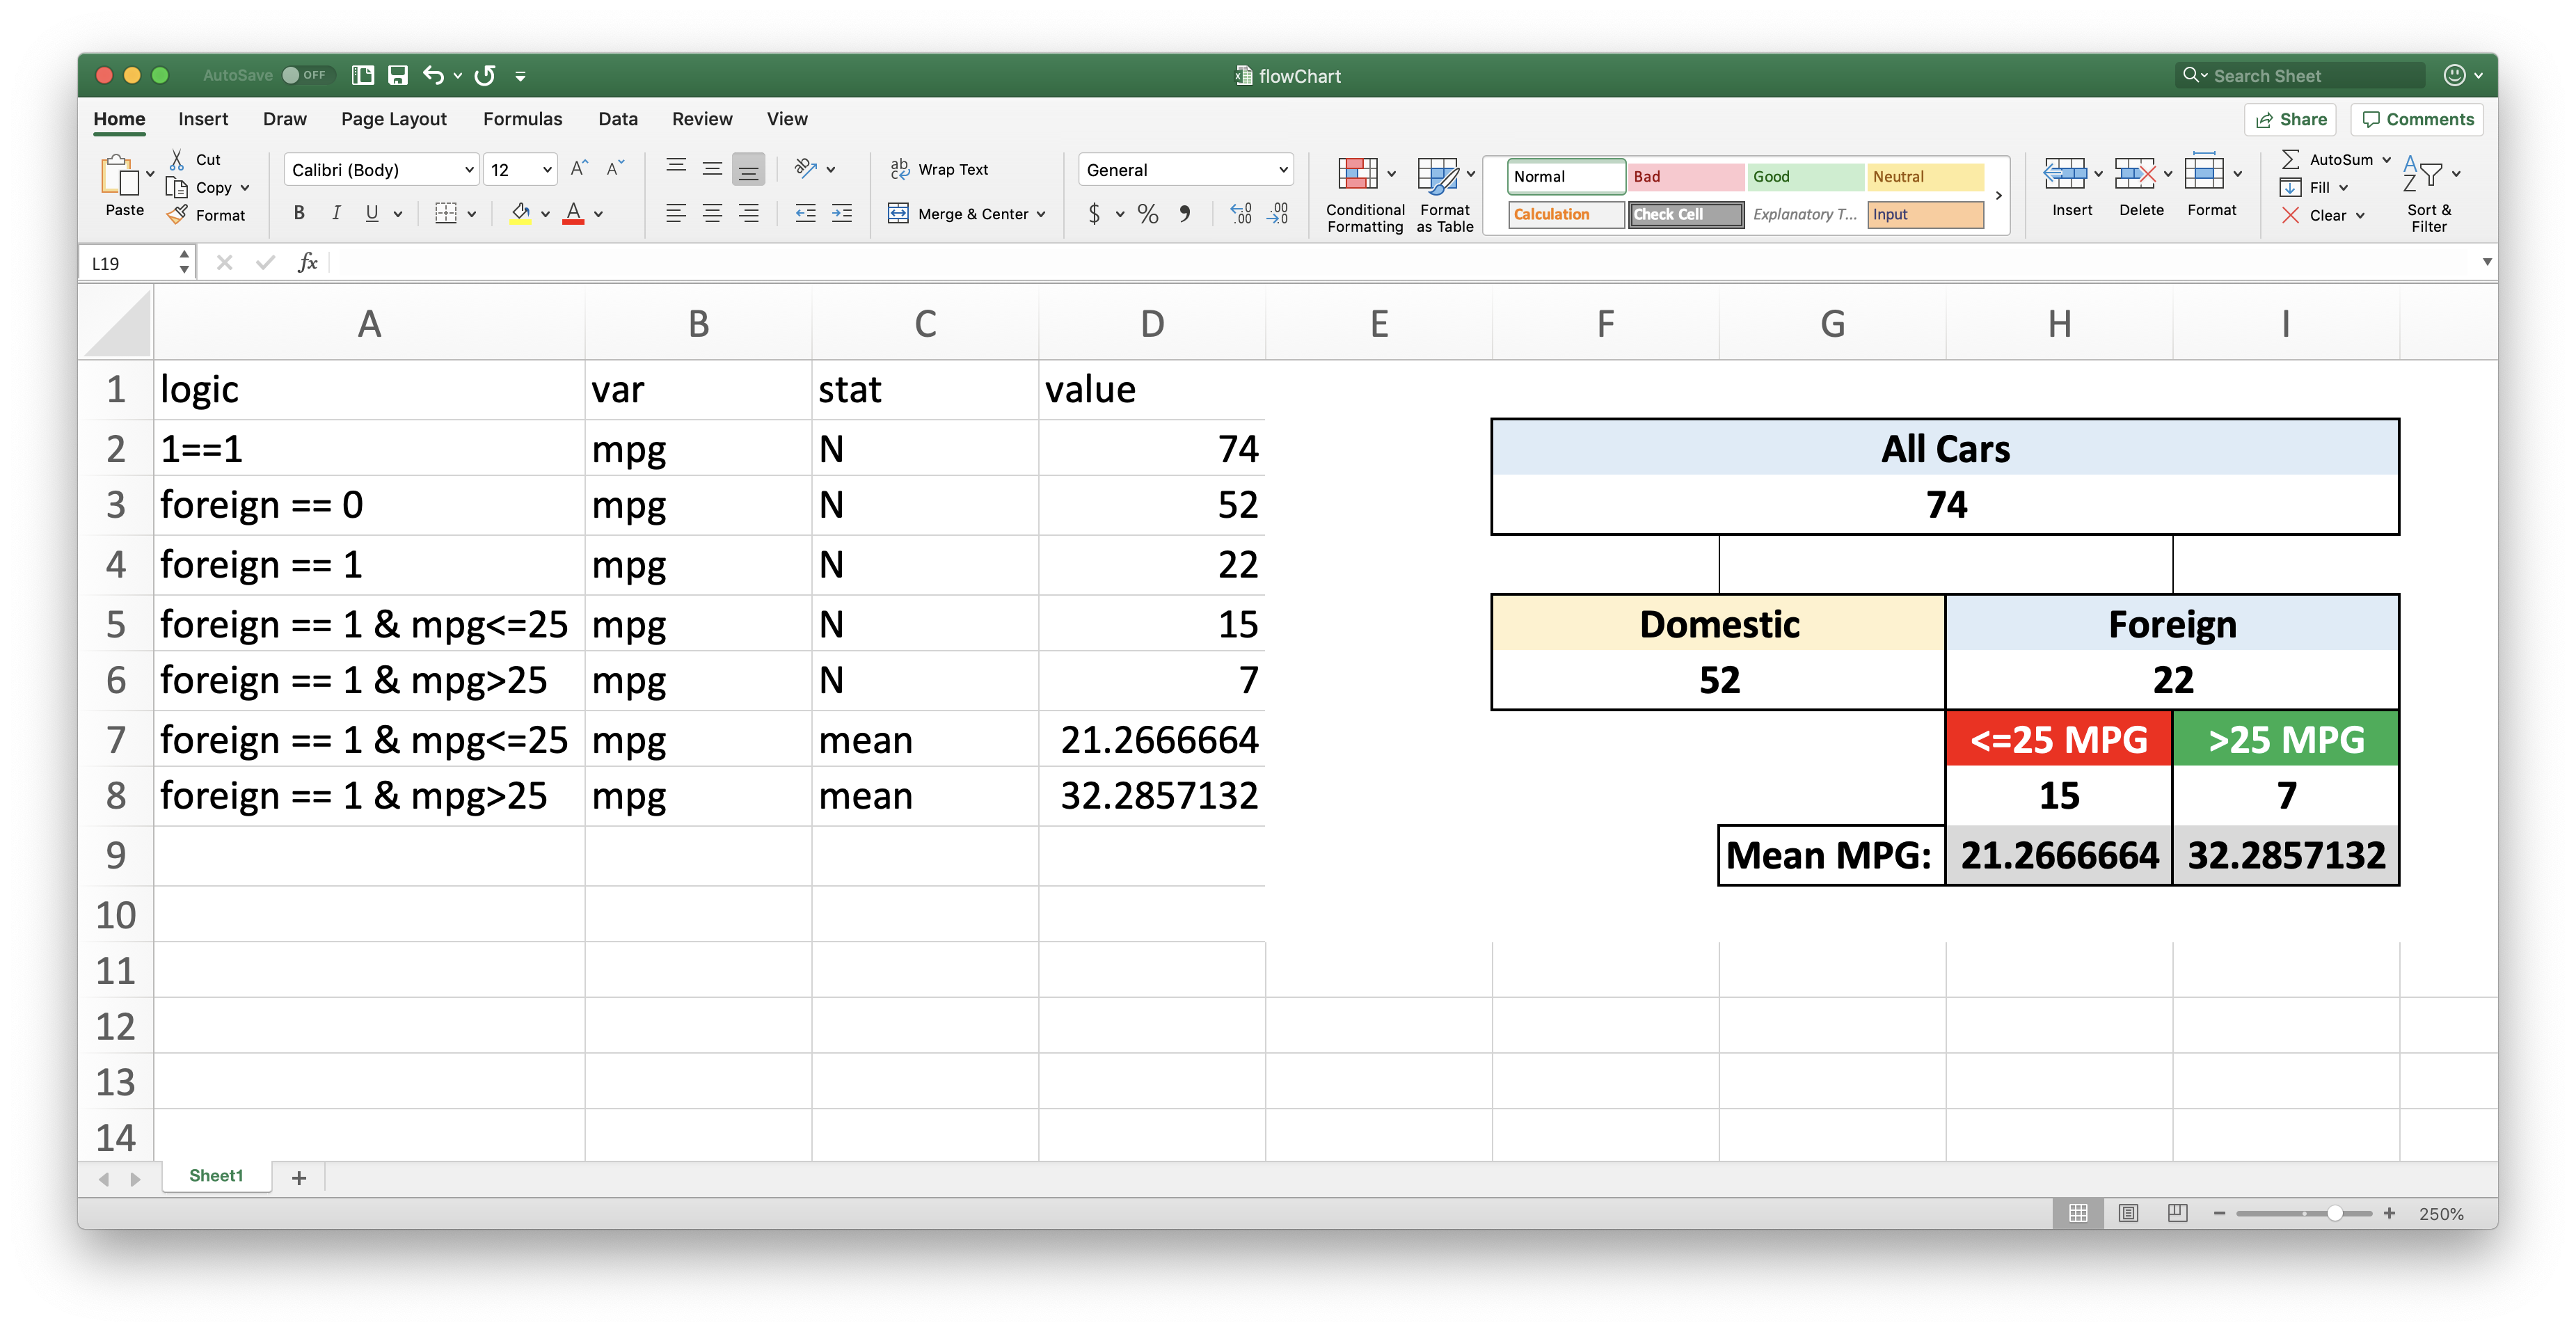
Flow charts
Creating flow charts in Stata is now easy! Given an Excel spreadsheet with columns A, B, C, and D titled “logic”, “var”, “stat” and “value”, respectively, statflow replaces the “value” column with the requested statistic for the observations in the dataset that fit the condition expressed in “logic”. This allows for the creation of dynamically updating custom tables and flowcharts. Here’s an example:
  ssc install statflow

  // Set up a flowchart:
    statflow template using "/path/to/file.xlsx" , [replace]

  // Fill it out, then get all the requested statistics:
    statflow using "/path/to/file.xlsx" [if] [in]
K-fold cross-validation
crossfold performs k-fold cross-validation on a specified model in order to evaluate a model’s ability to fit out-of-sample data.
. ssc install crossfold
. sysuse nlsw88 , clear
. crossfold reg wage union

             |      RMSE
-------------+-----------
        est1 |  4.171849
        est2 |  4.105884
        est3 |  4.038483
        est4 |  4.151482
        est5 |  4.171727
This procedure splits the data randomly into k partitions, then for each partition it fits the specified model using the other k-1 groups and uses the resulting parameters to predict the dependent variable in the unused group.
Finally, crossfold reports a measure of goodness-of-fit from each attempt. The default evaluation metric is root mean squared error (RMSE).
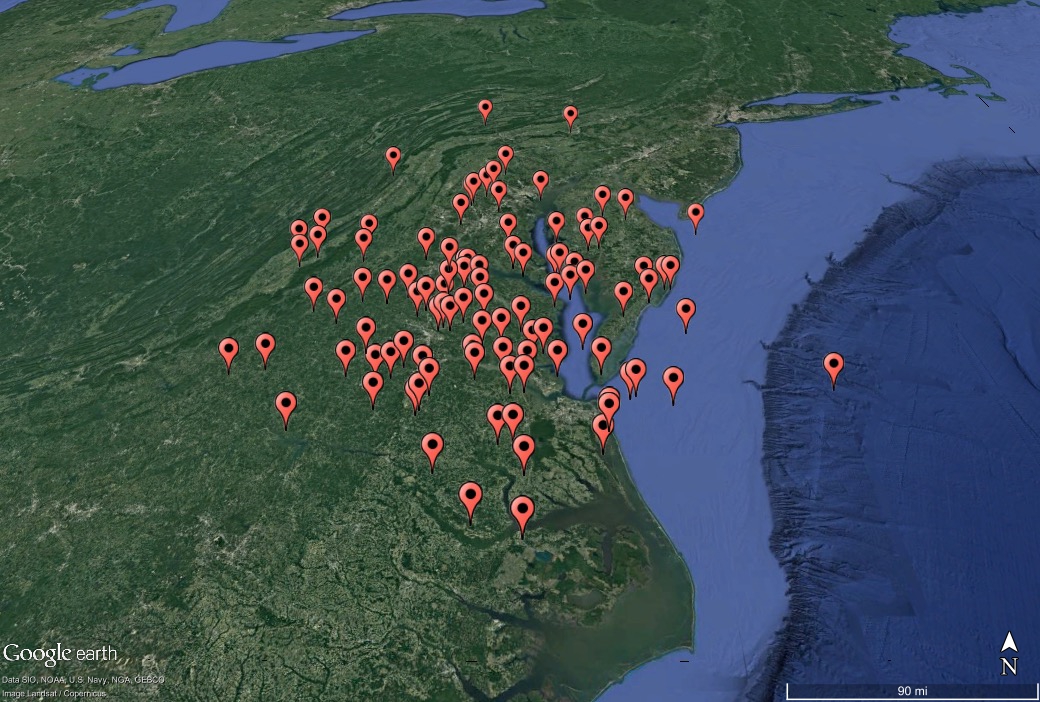
KML files
Making KML files in Stata is now easy! Here’s an example using dta2kml:
ssc install dta2kml

clear
	set obs 100
	gen lat = rnormal() +38
	gen lon = rnormal() -77

dta2kml using "demo.kml" , lat(lat) lon(lon) replace
Knapsack solver
Stata can now solve constrained optimization problems of the “knapsack” variety! Given a budget constraint and a dataset of items with prices and values, knapsack will calculate the most valuable obtainable combination under the given budget, and returns those items and their total value. Here’s an example:
ssc install knapsack
. sysuse auto.dta, clear
(1978 Automobile Data)

. keep mpg price
. rename (mpg price)(cost value)

. knapsack 500, p(cost) v(value) gen(chosen)
(74 missing values generated)
Maximum Total Price = 253853

. di "`r(max)'"
253853

. table chosen , c(sum cost sum value)
----------------------------------
   chosen |  sum(cost)  sum(value)
----------+-----------------------
        0 |       1076      202376
        1 |        500      253853
----------------------------------
QR codes
Making QR codes with Stata is now easy! Here’s an example using txt2qr:
txt2qr this is a test using "test.png", replace

txt2qr saves a QR code containing text to the location specified in using. The file extension .png is recommended. Spaces and special characters are not currently supported in text. Internet connection is required.