Visualization Examples
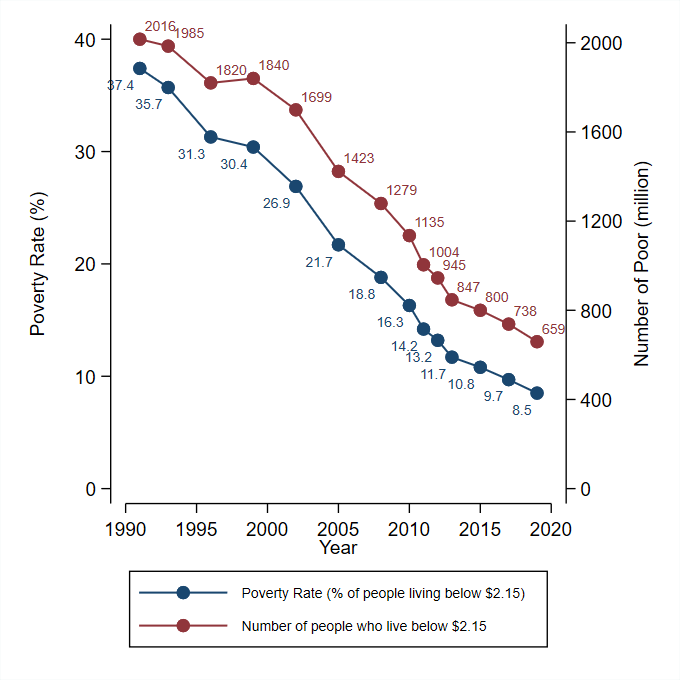
Global Poverty Trends 1990-2020 (reference year)
pip wb,  clear

local years = "1991|1993|1996|1999|2002|2005|2008|2010|2011|2012|2013|2015|2017|2019|2020"
keep if regexm(strofreal(year), "`years'")
keep if region_code == "WLD"

gen poorpop = headcount * population/ 1000000
gen hcpercent = round(headcount*100, 0.1)
gen poorpopround = round(poorpop, 1)

twoway (sc hcpercent year, ///
       yaxis(1) mlab(hcpercent) mlabpos(7) mlabsize(vsmall) c(l)) ///
       (sc poorpopround year,  ///
       yaxis(2) mlab(poorpopround) mlabsize(vsmall) mlabpos(1) c(l)), ///
  yti("Poverty Rate (%)" " ", size(small) axis(1))  ///
  ylab(0(10)40, labs(small) nogrid angle(0) axis(1))  ///
  yti("Number of Poor (million)", size(small) axis(2)) ///
  ylab(0(400)2000, labs(small) angle(0) axis(2))  ///
  xlabel(,labs(small)) xtitle("Year", size(small))  ///
  graphregion(c(white)) ysize(5) xsize(5)  ///
xlabel(1990(5)2020) xscale(range(1990 2020) noextend)  ///
  legend(order( ///
  1 "Poverty Rate (% of people living below $2.15)"  ///
  2 "Number of people who live below $2.15") si(vsmall) row(2)) scheme(s2color)
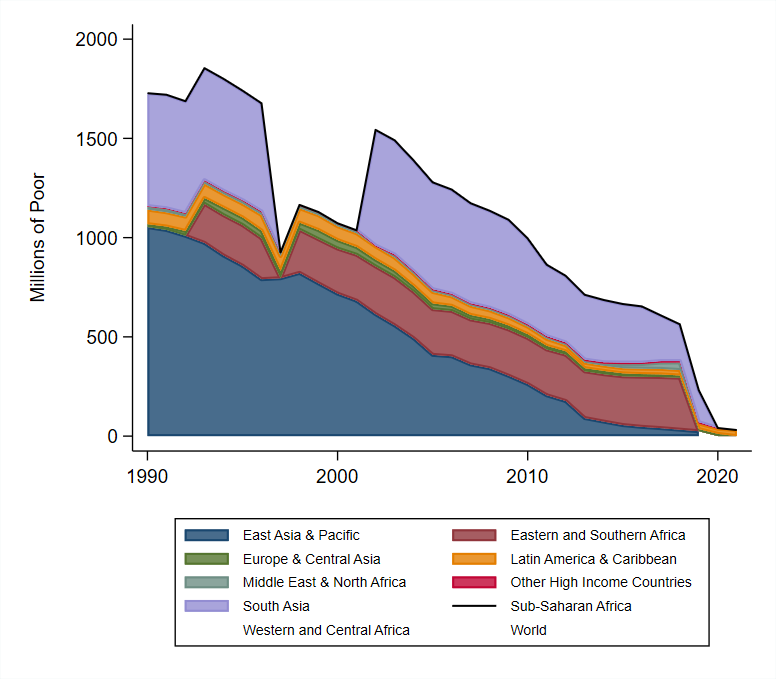
Millions of poor by region (reference year)
pip wb, clear
keep if year > 1989
local years = "1990|1993|1996|1999|2002|2005|2008|2010|2011|2012|2013|2015|2017|2019|2020"
gen poorpop = headcount * population/ 1000000
gen hcpercent = round(headcount*100, 0.1)
gen poorpopround = round(poorpop, 1)
encode region_name, gen(rid)

levelsof rid, local(regions)
foreach region_name of local regions {
	local legend = `"`legend' `region_name' "`: label rid `region_name''" "'
}

keep year rid poorpop
reshape wide poorpop,i(year) j(rid)
foreach i of numlist 2(1)7{
	egen poorpopacc`i'=rowtotal(poorpop1 - poorpop`i')
}


twoway (area poorpop1 year) ///
(rarea poorpopacc2 poorpop1 year) ///
(rarea poorpopacc3 poorpopacc2 year) ///
(rarea poorpopacc4 poorpopacc3 year) ///
(rarea poorpopacc5 poorpopacc4 year) ///
(rarea poorpopacc6 poorpopacc5 year) ///
(rarea poorpopacc7 poorpopacc6 year) ///
(line poorpopacc7 year, lwidth(midthick) lcolor(gs0)), ///
ytitle("Millions of Poor" " ", size(small))  ///
xtitle(" " "", size(small)) scheme(s2color)  ///
graphregion(c(white)) ysize(7) xsize(8)  ///
ylabel(,labs(small) nogrid angle(verticle)) xlabel(,labs(small)) ///
legend(order(`legend') si(vsmall) symxsize(*.5) symysize(*.5))
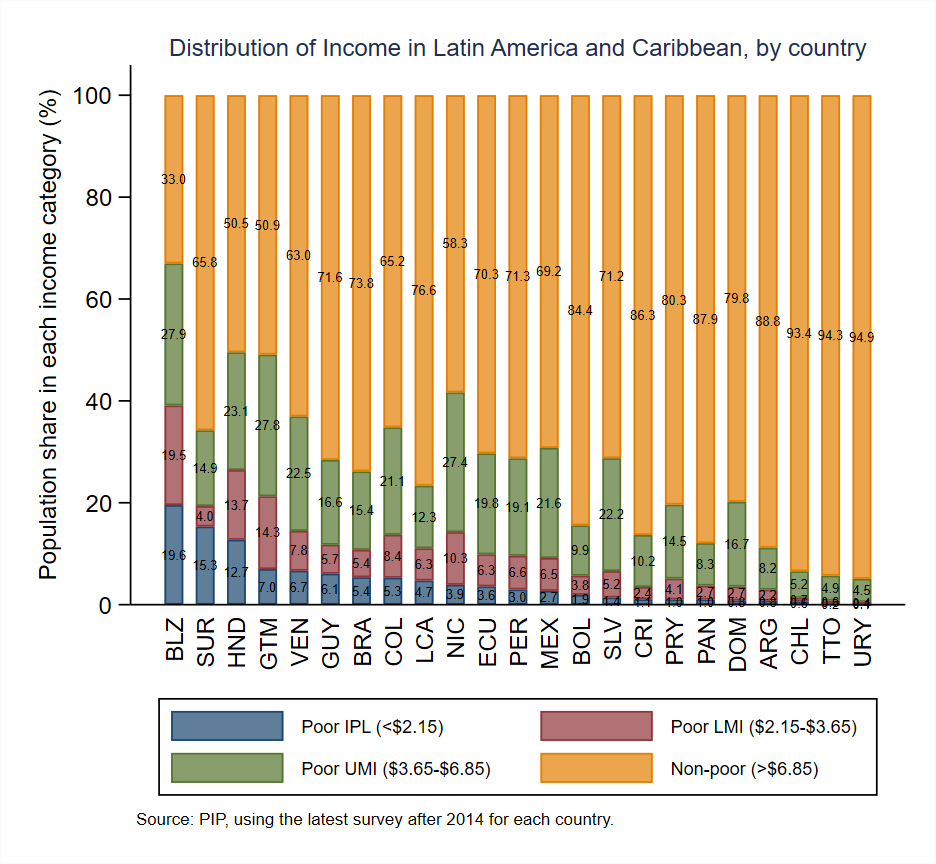
Distribution of Income in Latin America and Caribbean, by country
pip, region(lac) year(last) povline(2.15 3.65 6.85) fillgaps clear
keep if welfare_type==2 & year>=2014 // keep income surveys
keep poverty_line country_code country_name year headcount
replace poverty_line = poverty_line*100
replace headcount = headcount*100
tostring poverty_line, replace format(%12.0f) force
reshape wide  headcount,i(year country_code country_name ) j(poverty_line) string
gen percentage_0 = headcount215
gen percentage_1 = headcount365 - headcount215
gen percentage_2 = headcount685 - headcount365
gen percentage_3 = 100 - headcount685
keep country_code country_name year  percentage_*
reshape long  percentage_,i(year country_code country_name ) j(category)
la define category 0 "Poor IPL (<$2.15)" 1 "Poor LMI ($2.15-$3.65)" 2 "Poor UMI ($3.65-$6.85)" ///
3 "Non-poor (>$6.85)"
la val category category
la var category ""

graph bar (mean) percentage, inten(*0.7) o(category)  ///
o(country_code, lab(labsi(small) angle(vertical)) sort(1) descending) stack asy ///
blab(bar, pos(center) format(%3.1f) size(6.5pt)) ///
ti("Distribution of Income in Latin America and Caribbean, by country", si(small)) ///
note("Source: PIP, using the latest survey after 2014 for each country. ", si(*.7)) ///
graphregion(c(white)) ysize(6) xsize(6.5) legend(si(vsmall) r(3))  ///
yti("Population share in each income category (%)", si(small)) ///
ylab(,labs(small) nogrid angle(0)) scheme(s2color)
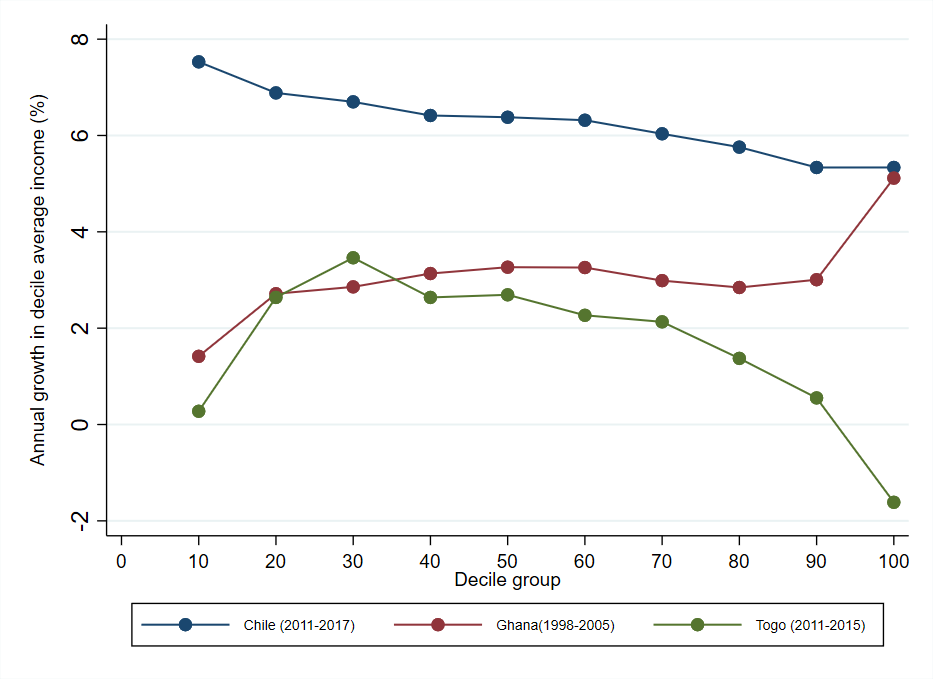
Growth Incidence Curves for Chile, Ghana, and Togo
 pip, country(chl gha tgo) year(all)  clear
 keep if (country_code == "CHL" & survey_comparability == 1) | ///
 (country_code == "GHA" & survey_comparability == 1) | ///
 (country_code == "TGO" & survey_comparability == 0)
 reshape long decile, i(country_code welfare_time) j(dec)
 egen panelid = group(country_code dec)
 replace welfare_time = int(welfare_time)
 xtset panelid welfare_time
 replace decile = 10*decile*mean
 gen g =(((decile/L6.decile)^(1/6))-1)*100
 replace g =(((decile/L7.decile)^(1/7))-1)*100 if country_code =="GHA"
 replace g =(((decile/L4.decile)^(1/4))-1)*100 if country_code =="TGO"

 replace dec=10*dec

 twoway (sc g dec if welfare_time == 2017 & country_code == "CHL", c(l)) ///
 		(sc g dec if welfare_time == 2005 & country_code == "GHA", c(l))    ///
 		(sc g dec if welfare_time == 2015 & country_code == "TGO", c(l)),   ///
 		yti("Annual growth in decile average income (%)" " ",      ///
 		size(small))  xlabel(0(10)100,labs(small))                 ///
 		xtitle("Decile group", size(small)) graphregion(c(white)) ///
 		legend(order(1 "Chile (2011-2017)"                      ///
 		2 "Ghana(1998-2005)" 3 "Togo (2011-2015)")              ///
 		si(vsmall) row(1)) scheme(s2color)
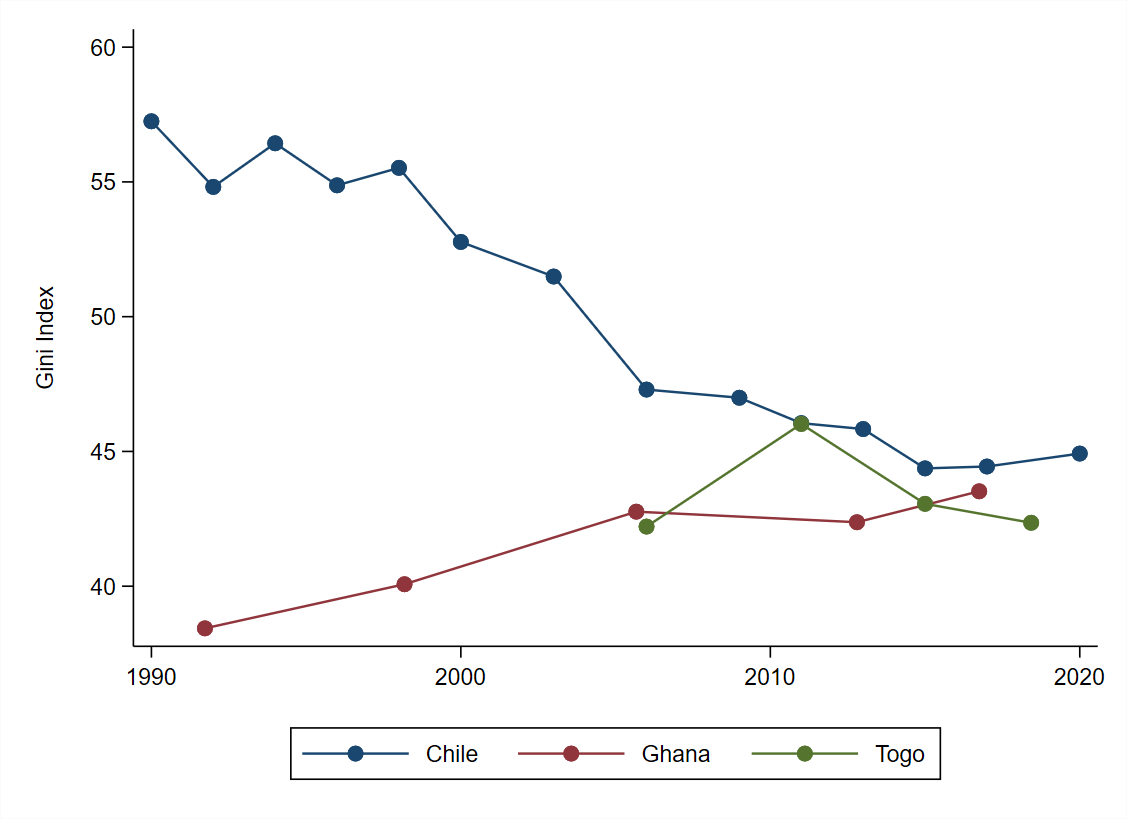
Gini Indices for Chile, Ghana, and Togo
pip,  country(chl gha tgo) year(all) clear
	replace gini = gini * 100
	keep if welfare_time > 1989
	twoway (connected gini welfare_time if country_code == "CHL")  ///
		(connected gini welfare_time if country_code == "GHA")       ///
		(connected gini welfare_time if country_code == "TGO"),      ///
		ylabel(, format(%2.0f)) ///
		ytitle("Gini Index" " ", size(small))                   ///
		xtitle(" " "", size(small)) ylabel(,labs(small) nogrid  ///
		angle(verticle)) xlabel(,labs(small))                   ///
		graphregion(c(white)) scheme(s2color)                   ///
		legend(order(1 "Chile" 2 "Ghana" 3 "Togo") si(small) row(1))
graph export Gini.png, as(png) hei(1000) replace
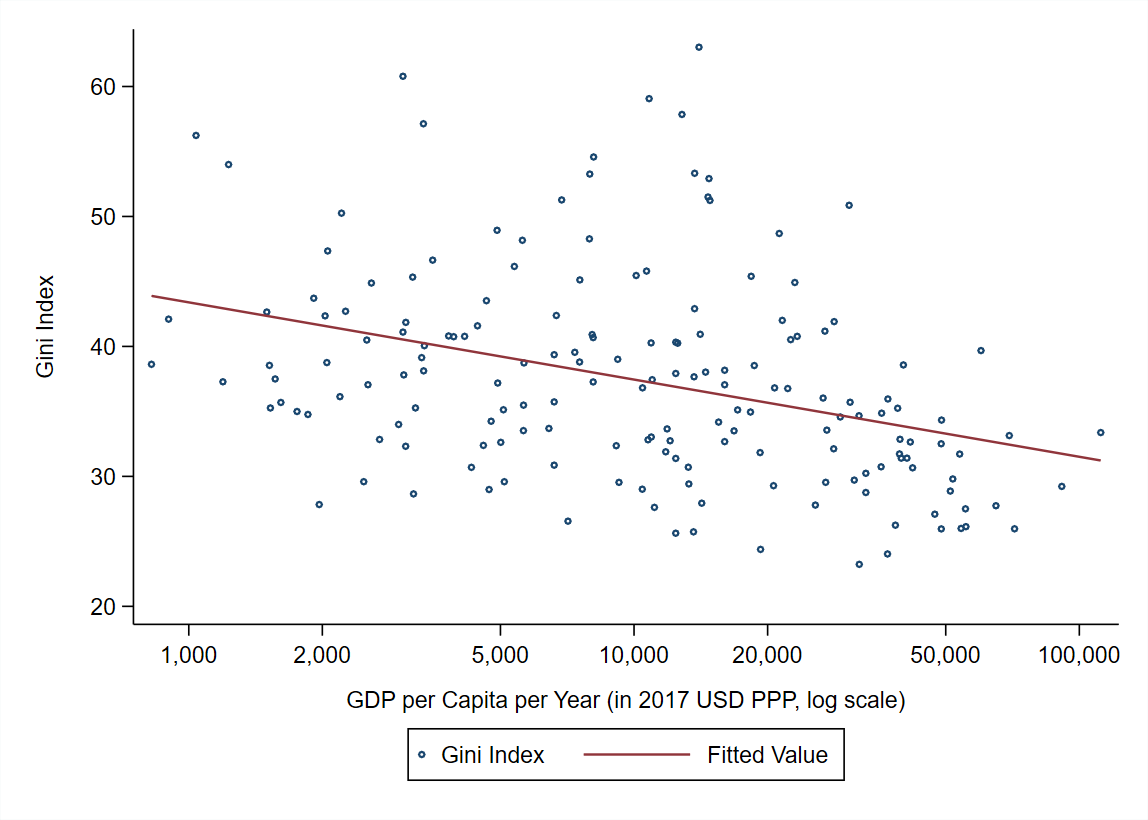
Relationship between inequality and GDP
set checksum off
wbopendata, indicator(NY.GDP.PCAP.PP.KD) long clear
rename countrycode country_code
tempfile PerCapitaGDP
save `PerCapitaGDP', replace

pip, country(all) year(last) clear
keep country_code country_name year gini
drop if gini == -1
* Merge Gini coefficient with per capita GDP
merge m:1 country_code year using `PerCapitaGDP', keep(match)
replace gini = gini * 100
drop if ny_gdp_pcap_pp_kd == .

gen loggdp = log10(ny_gdp_pcap_pp_kd)

twoway (scatter gini loggdp, mfcolor(%0) ///
msize(vsmall)) (lfit gini loggdp), ///
ylabel(, format(%2.0f)) ///
ytitle("Gini Index" " ", size(small))  ///
xtitle(" " "GDP per Capita per Year (in 2017 USD PPP, log scale)", size(small))  ///
xlab(3 "1,000" 3.3 "2,000" 3.7 "5,000" 4 "10,000" 4.3 "20,000" 4.7 "50,000" 5 "100,000") ///
graphregion(c(white)) ysize(5) xsize(7)  ///
ylabel(,labs(small) nogrid angle(verticle)) xlabel(,labs(small)) ///
legend(order(1 "Gini Index" 2 "Fitted Value") si(small)) scheme(s2color)
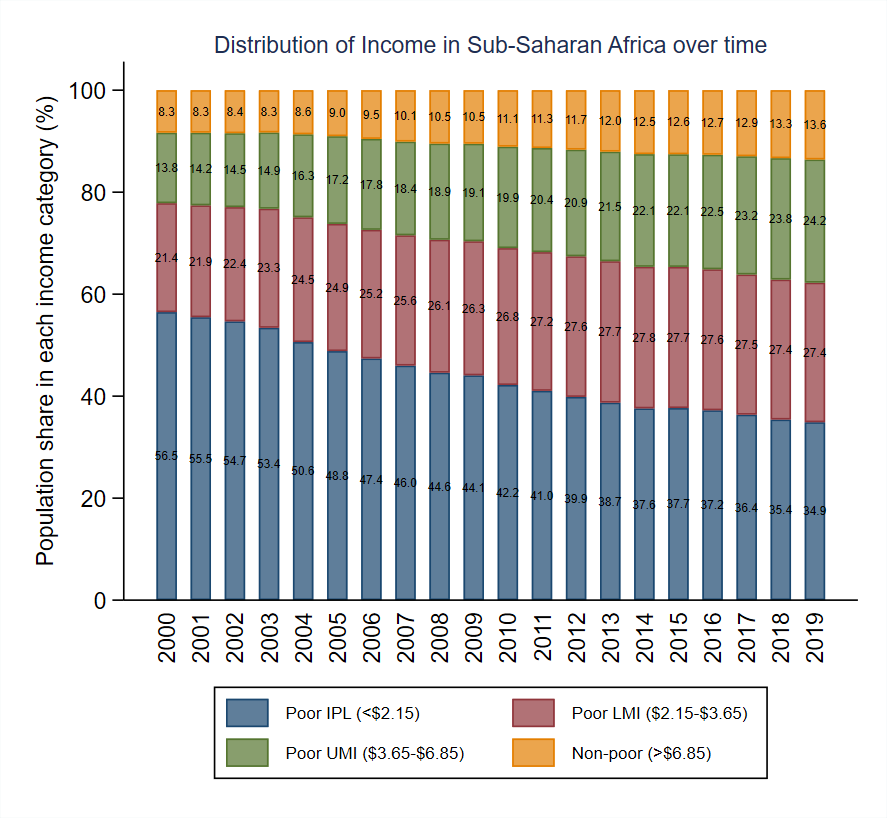
Distribution of Income in Sub-Saharan Africa and East Asia and Pacific over time
pip wb, povline(2.15 3.65 6.85) clear
keep if year >= 2000
keep poverty_line region_code region_name year headcount
replace poverty_line = poverty_line*100
replace headcount = headcount*100
tostring poverty_line, replace format(%12.0f) force
reshape wide headcount,i(year region_code region_name) j(poverty_line) string
gen percentage_0 = headcount215
gen percentage_1 = headcount365 - headcount215
gen percentage_2 = headcount685 - headcount365
gen percentage_3 = 100 - headcount685
keep region_code region_name year percentage_*
reshape long percentage_,i(year region_code region_name) j(category)
la define category 0 "Poor IPL (<$2.15)" 1 "Poor LMI ($2.15-$3.65)" 2 "Poor UMI ($3.65-$6.85)" ///
3 "Non-poor (>$6.85)"
la val category category
la var category ""
graph bar (mean) percentage if region_code=="SSA" & (year >= 2000 & year<=2019), inten(*0.7) o(category) ///
o(year, lab(labsi(small) angle(vertical))) stack asy ///
blab(bar, pos(center) format(%3.1f) size(6.5pt)) ///
ti("Distribution of Income in Sub-Saharan Africa over time", si(small)) ///
graphregion(c(white)) ysize(6) xsize(6.5) legend(si(vsmall) r(2) symxsize(*.4)) ///
yti("Population share in each income category (%)", si(small)) ///
ylab(,labs(small) nogrid angle(0)) scheme(s2color) name(ssa, replace)
graph export ssa.png, as(png) hei(1000) replace
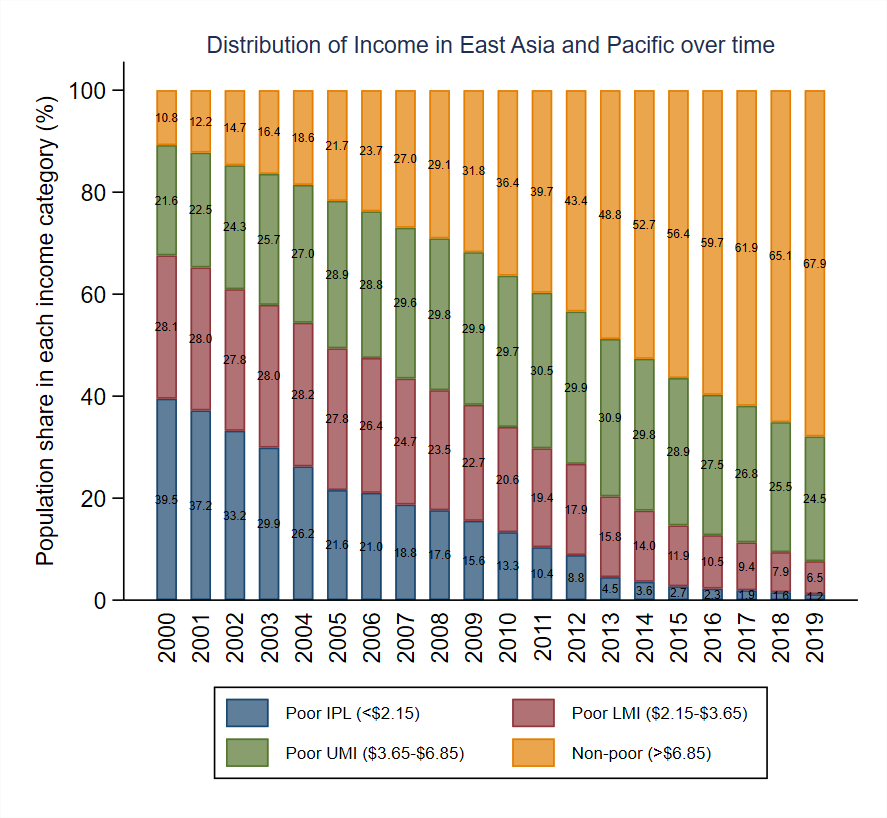
graph bar (mean) percentage if region_code=="EAP" & (year >= 2000 & year<=2019), inten(*0.7) o(category) ///
o(year, lab(labsi(small) angle(vertical))) stack asy ///
blab(bar, pos(center) format(%3.1f) size(6.5pt)) ///
ti("Distribution of Income in East Asia and Pacific over time", si(small)) ///
graphregion(c(white)) ysize(6) xsize(6.5) legend(si(vsmall) r(2) symxsize(*.4)) ///
yti("Population share in each income category (%)", si(small)) ///
ylab(,labs(small) nogrid angle(0)) scheme(s2color) name(eap, replace)
graph export eap.png, as(png) hei(1000) replace
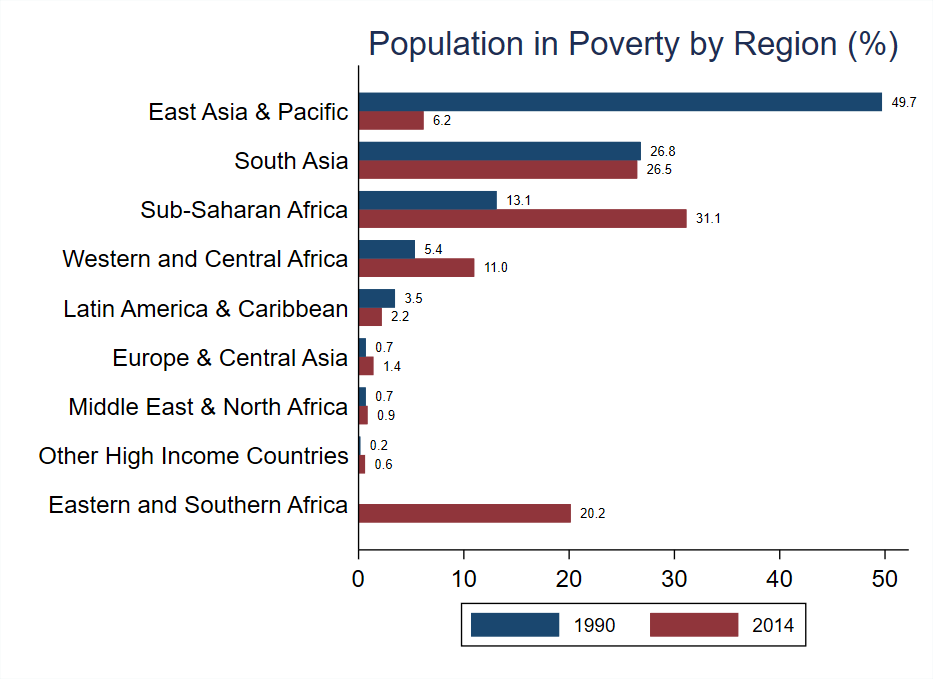
Population in poverty by region for 1990 and 2014
pip wb, year(1990 2014) clear
drop if region_code=="WLD"
keep region_name year pop_in_poverty
egen tot1990 = sum(pop_in_poverty) if year == 1990
egen tot2014 = sum(pop_in_poverty) if year == 2014
gen pop = (pop_in_poverty /tot1990) * 100
replace pop = (pop_in_poverty /tot2014) * 100 if pop ==.
drop pop_in_poverty tot1990 tot2014
reshape wide pop , i(region_name ) j( year)

la var pop1990 "1990"
la var pop2014 "2014"
graph hbar (asis) pop1990 pop2014, over(region_name, sort(1) descending) ///
blab(bar, pos(outside) format(%2.1f) size(5.5pt)) graphregion(color(white)) ///
ylabel(, nogrid) legend(size(small)) title(Population in Poverty by Region (%))