Plot a histogram for a PTI variable
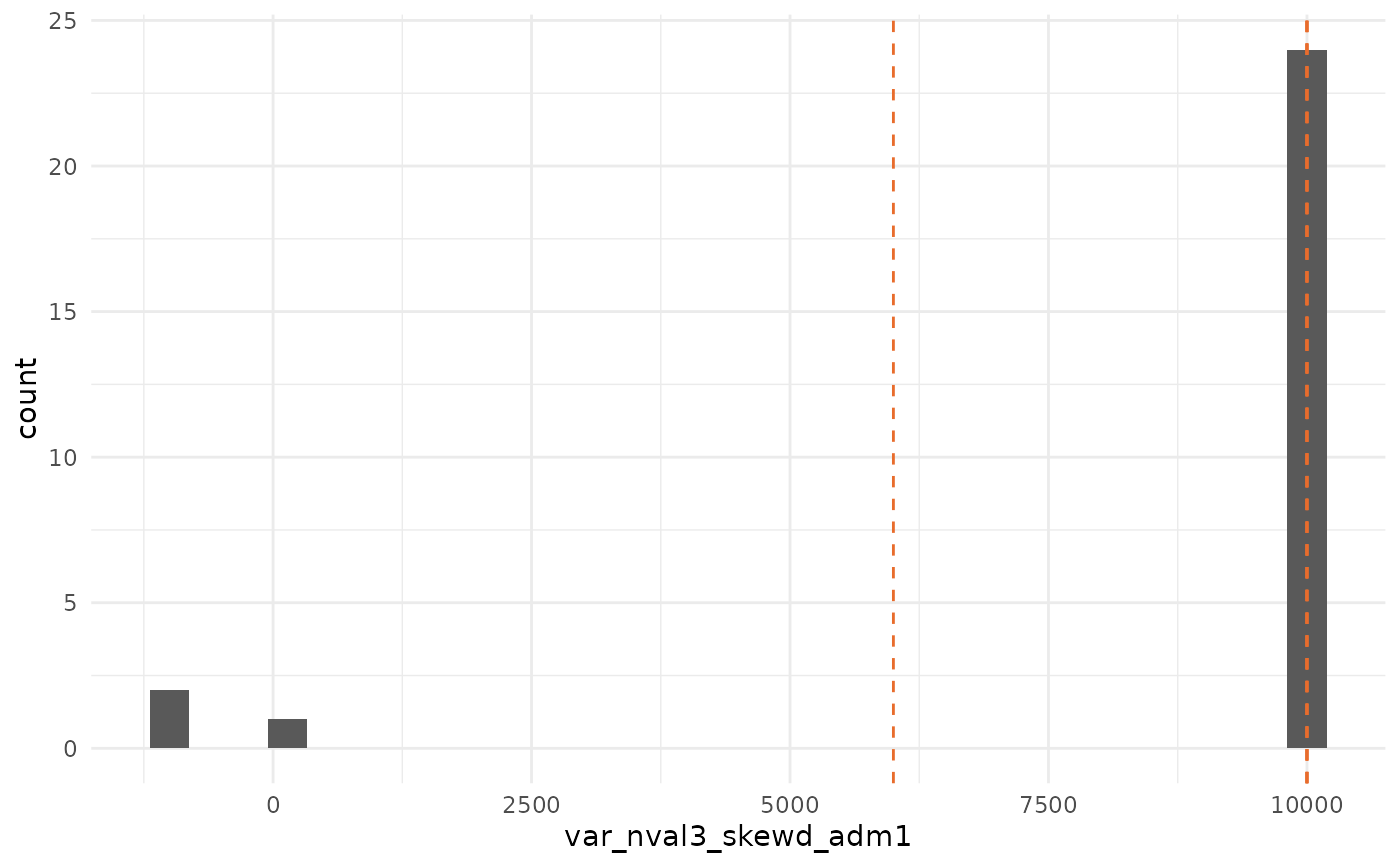
pti_plot_histogram.RdBuilds a histogram for a named variable in a data frame or `sf` object, with optional dashed vertical lines marking requested percentiles.
Usage
pti_plot_histogram(
  data,
  var,
  bins = 30,
  percentiles = c(0.1, 0.25, 0.5, 0.75, 0.9)
)See also
Other pti-report:
pti_plot_boundaries(),
pti_summary_table()
Examples
data(ukr_mtdt_full)
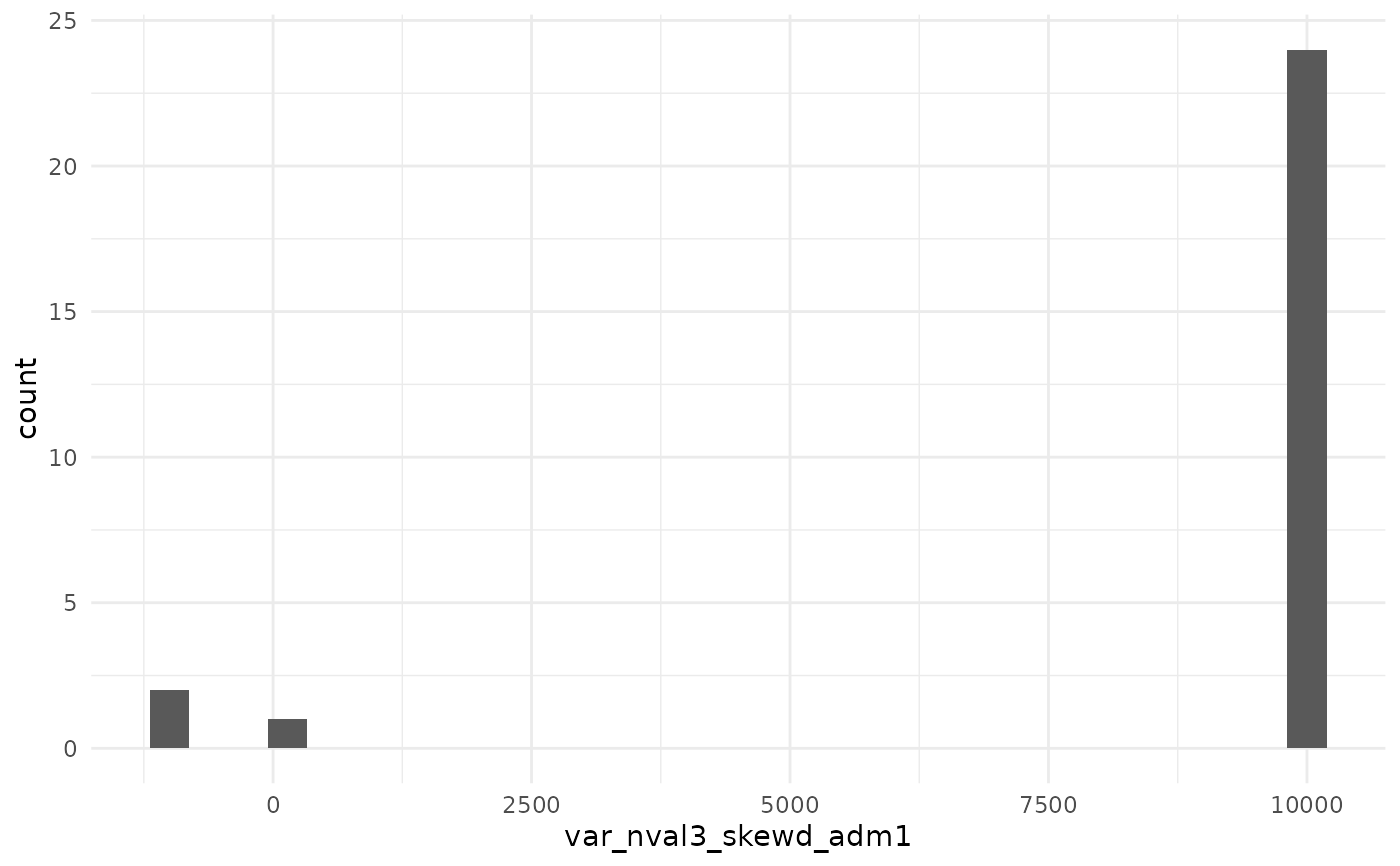
pti_plot_histogram(ukr_mtdt_full$admin1_Oblast, "var_nval3_skewd_adm1")
 pti_plot_histogram(
ukr_mtdt_full$admin1_Oblast,
"var_nval3_skewd_adm1",
percentiles = NULL
)
pti_plot_histogram(
ukr_mtdt_full$admin1_Oblast,
"var_nval3_skewd_adm1",
percentiles = NULL
)