Plot administrative boundary layers by level
pti_plot_boundaries.RdCreates a faceted `ggplot2` map from a named list of `sf` layers, with one panel for each administrative level and an optional highlighted level.
See also
Other pti-report:
pti_plot_histogram(),
pti_summary_table()
Examples
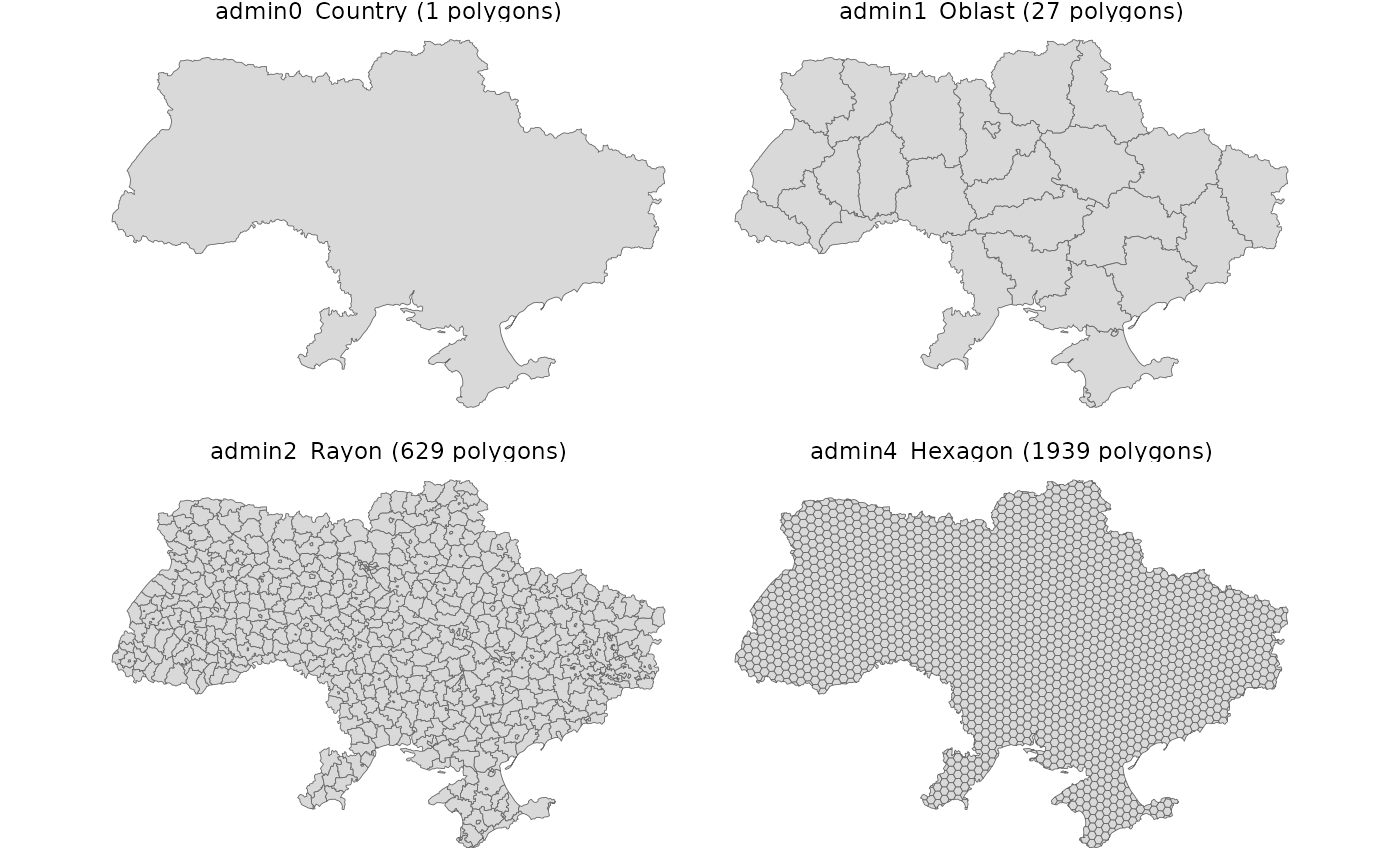
data(ukr_shp)
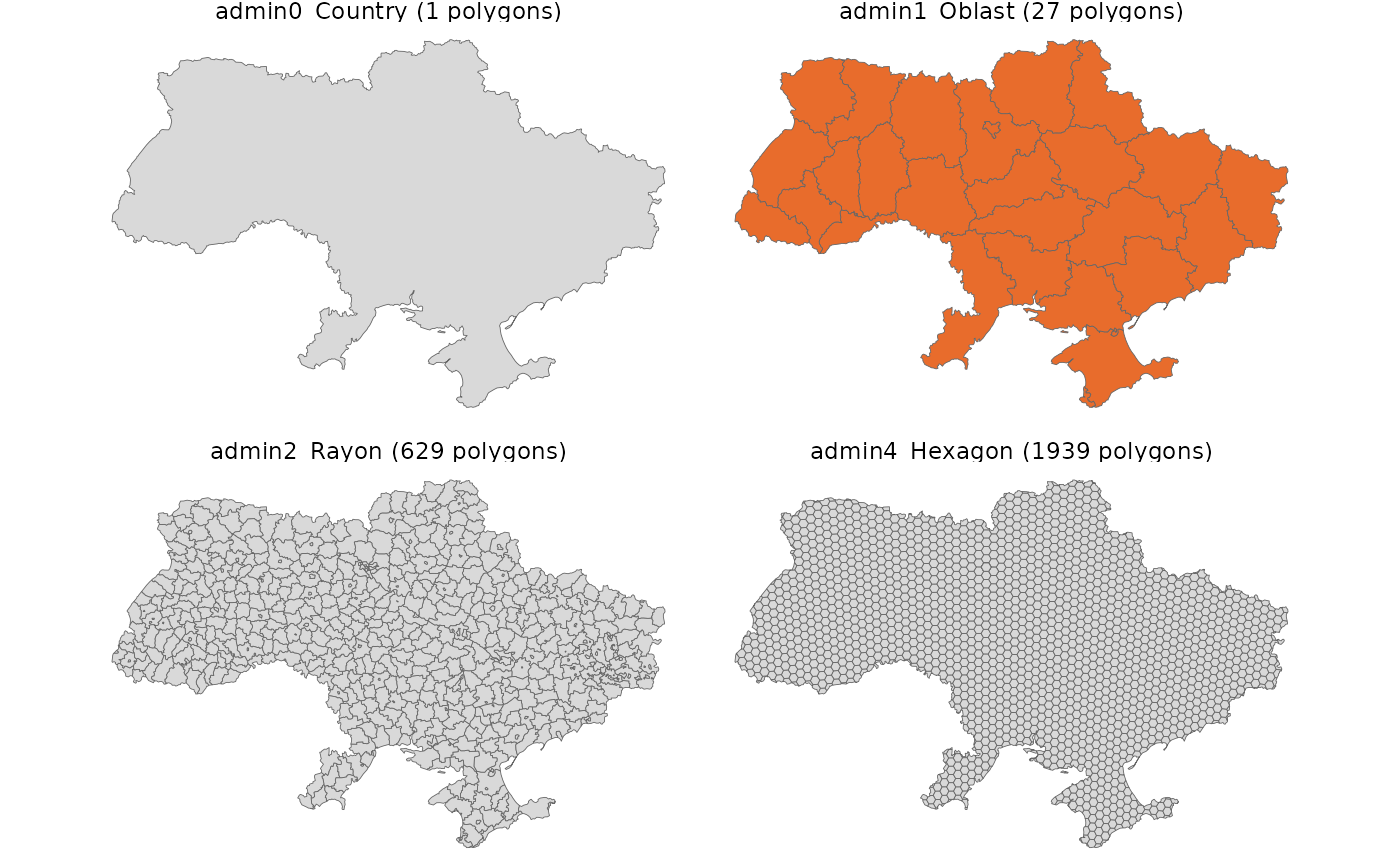
pti_plot_boundaries(ukr_shp)
 pti_plot_boundaries(ukr_shp, highlight_level = "admin1_Oblast")