Using BlackMarblePy#
![]()
![]()
This notebook provides a hands-on introduction to the BlackMarblePy package and demonstrates how to retrieve, visualize, and analyze NASA Black Marble nighttime lights data. Through a series of guided examples, you will learn how to:
Retrieve daily, monthly, and annual nighttime lights data for specific dates, regions, and bounding boxes.
Automatically download and mosaic all required NASA Black Marble tiles for a region of interest.
Monitor download progress and data volume using built-in progress indicators.
Visualize nighttime lights data using maps and charts.
Explore temporal and spatial patterns in nighttime illumination data.
Requirements#
To download and/or extract NASA Black Marble data, first ensure that the following prerequisites are in place:
📦 Install blackmarblepy#
To use this library, install the BlackMarblePy package. It is highly recommended to install it inside a Python virtual environment to avoid dependency conflicts.
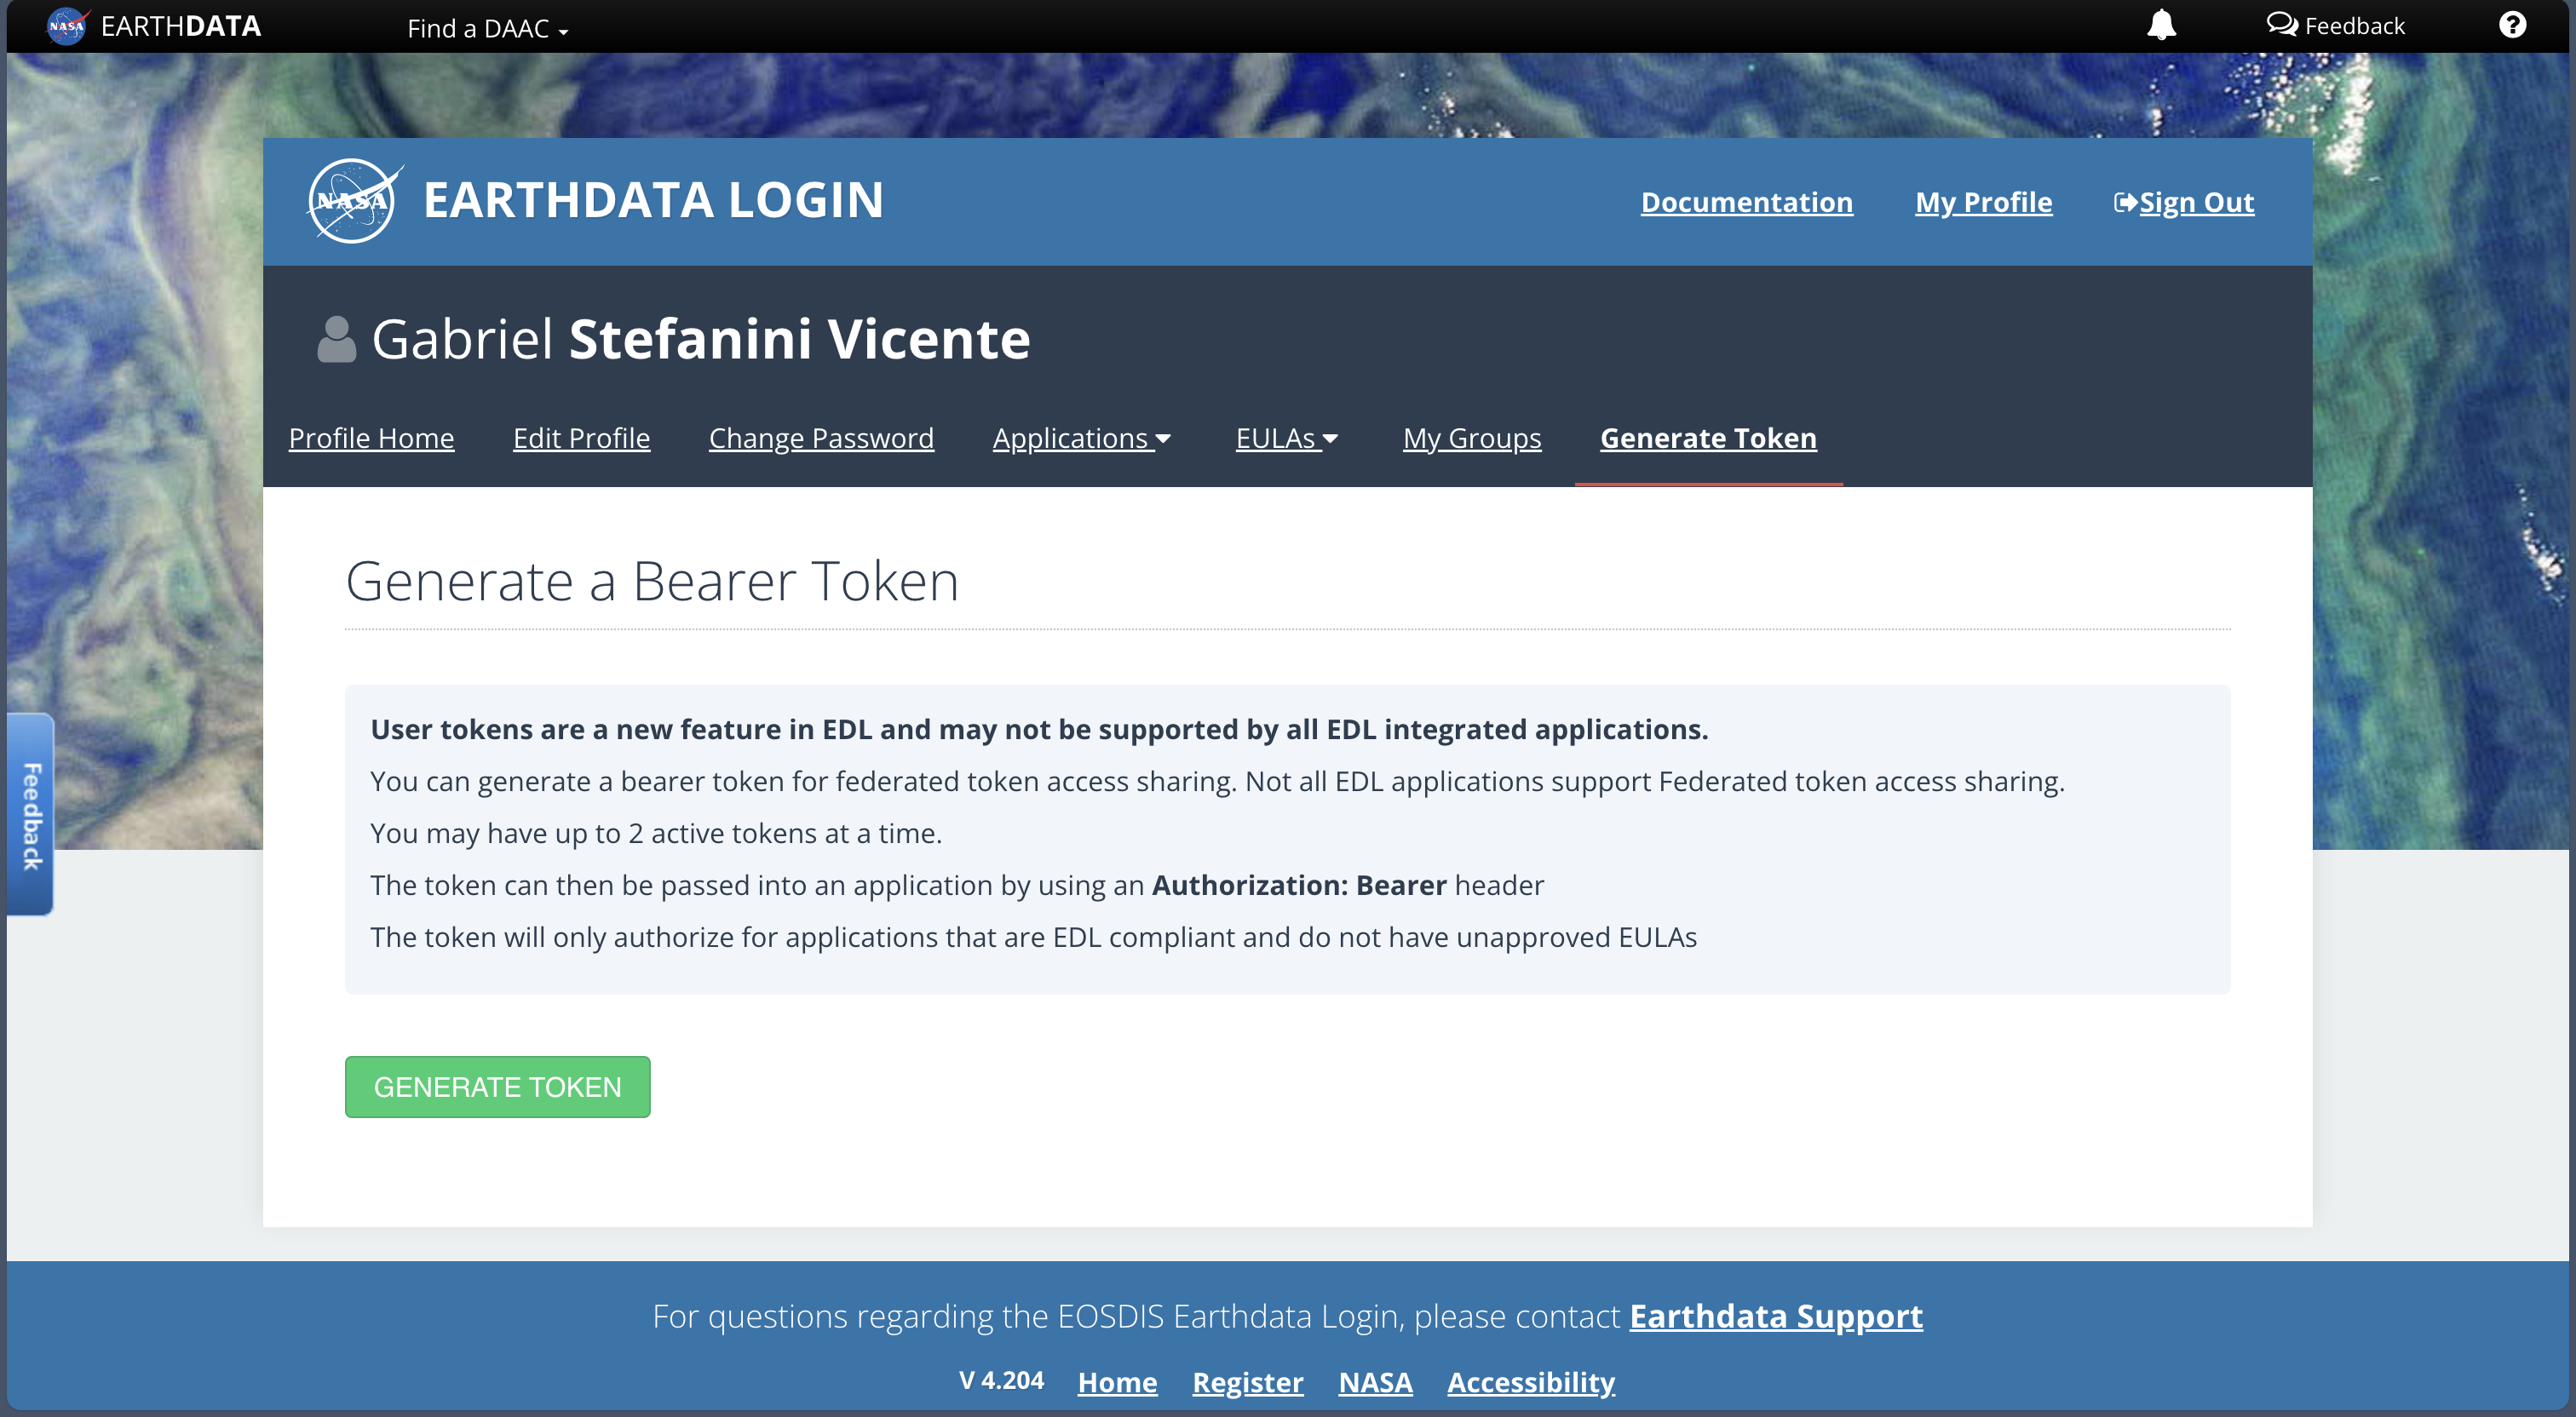
✅ Set Up NASA Earthdata Token#
BlackMarblePy requires a valid, unexpired NASA Earthdata bearer token, which you can retrieve from your Earthdata profile. For convenience and security, we recommend setting this as the BLACKMARBLE_TOKEN environment variable on your system.
Access Earthdata Login. In case you haven’t already, you must register.
Select Generate Token. If the token is expired or you are in need of one, click the Generate Token button.
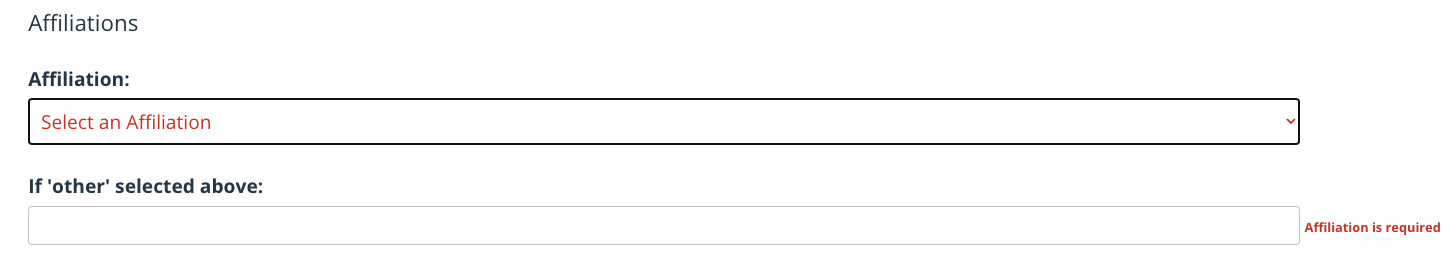
Caution
Please be aware that the “Affiliation” information on your Earthdata profile is mandatory. Without this information, the NASA Earthdata token will be invalid. In case of a download error, try visiting the URL which is failing, as you may be prompted to grant permissions.
Use your token securely. We recommend setting it as a secret or an environment variable rather than hardcoding it. For example, you can set the
BLACKMARBLE_TOKENenvironment variable to store your token safely in Unix-like systems:export BLACKMARBLE_TOKEN=<YOUR_NASA_EARTHDATA_TOKEN>
Important
Using a secret token securely in Python code involves several practices to ensure the token is not exposed unintentionally. For instance, storing the secret token in an environment variable, in configuration files or using secret management services. In this example, we set up an environment variable.
🌍 Define Region of Interest#
You must define a region of interest which represents the geographic area you want to extract data for.
Fig. 1 This map shows the region of interest used in the examples below. Data source: https://datacatalog.worldbank.org/search/dataset/0038272/world-bank-official-boundaries#
Examples#
In this section, we demonstrate how to use BlackMarblePy to retrieve, process, and visualize NASA Black Marble data. BlackMarblePy provides two primary interfaces:
A class-based interface (
BlackMarble) that preserves configuration settings, such as the bearer token and output directory, across multiple executions.A procedural API (
bm_extract,bm_raster) povides the same core functionality through standalone functions.
The examples that follow use the BlackMarble class-based interface. Thus, we instantiate:
bm = BlackMarble()
# Optional: configure options
# bm = BlackMarble(
#     token="your_token_here",           # NASA Earthdata bearer token (can also be set via env var)
#     check_all_tiles_exist=True,        # Skip dates if any tile is missing
#     drop_values_by_quality_flag=[255], # Mask out invalid data (e.g., fill value)
#     output_directory="data",           # Directory to save outputs
#     output_skip_if_exists=True         # Skip downloading if file already exists
# )
Create Nighttime Lights Rasters#
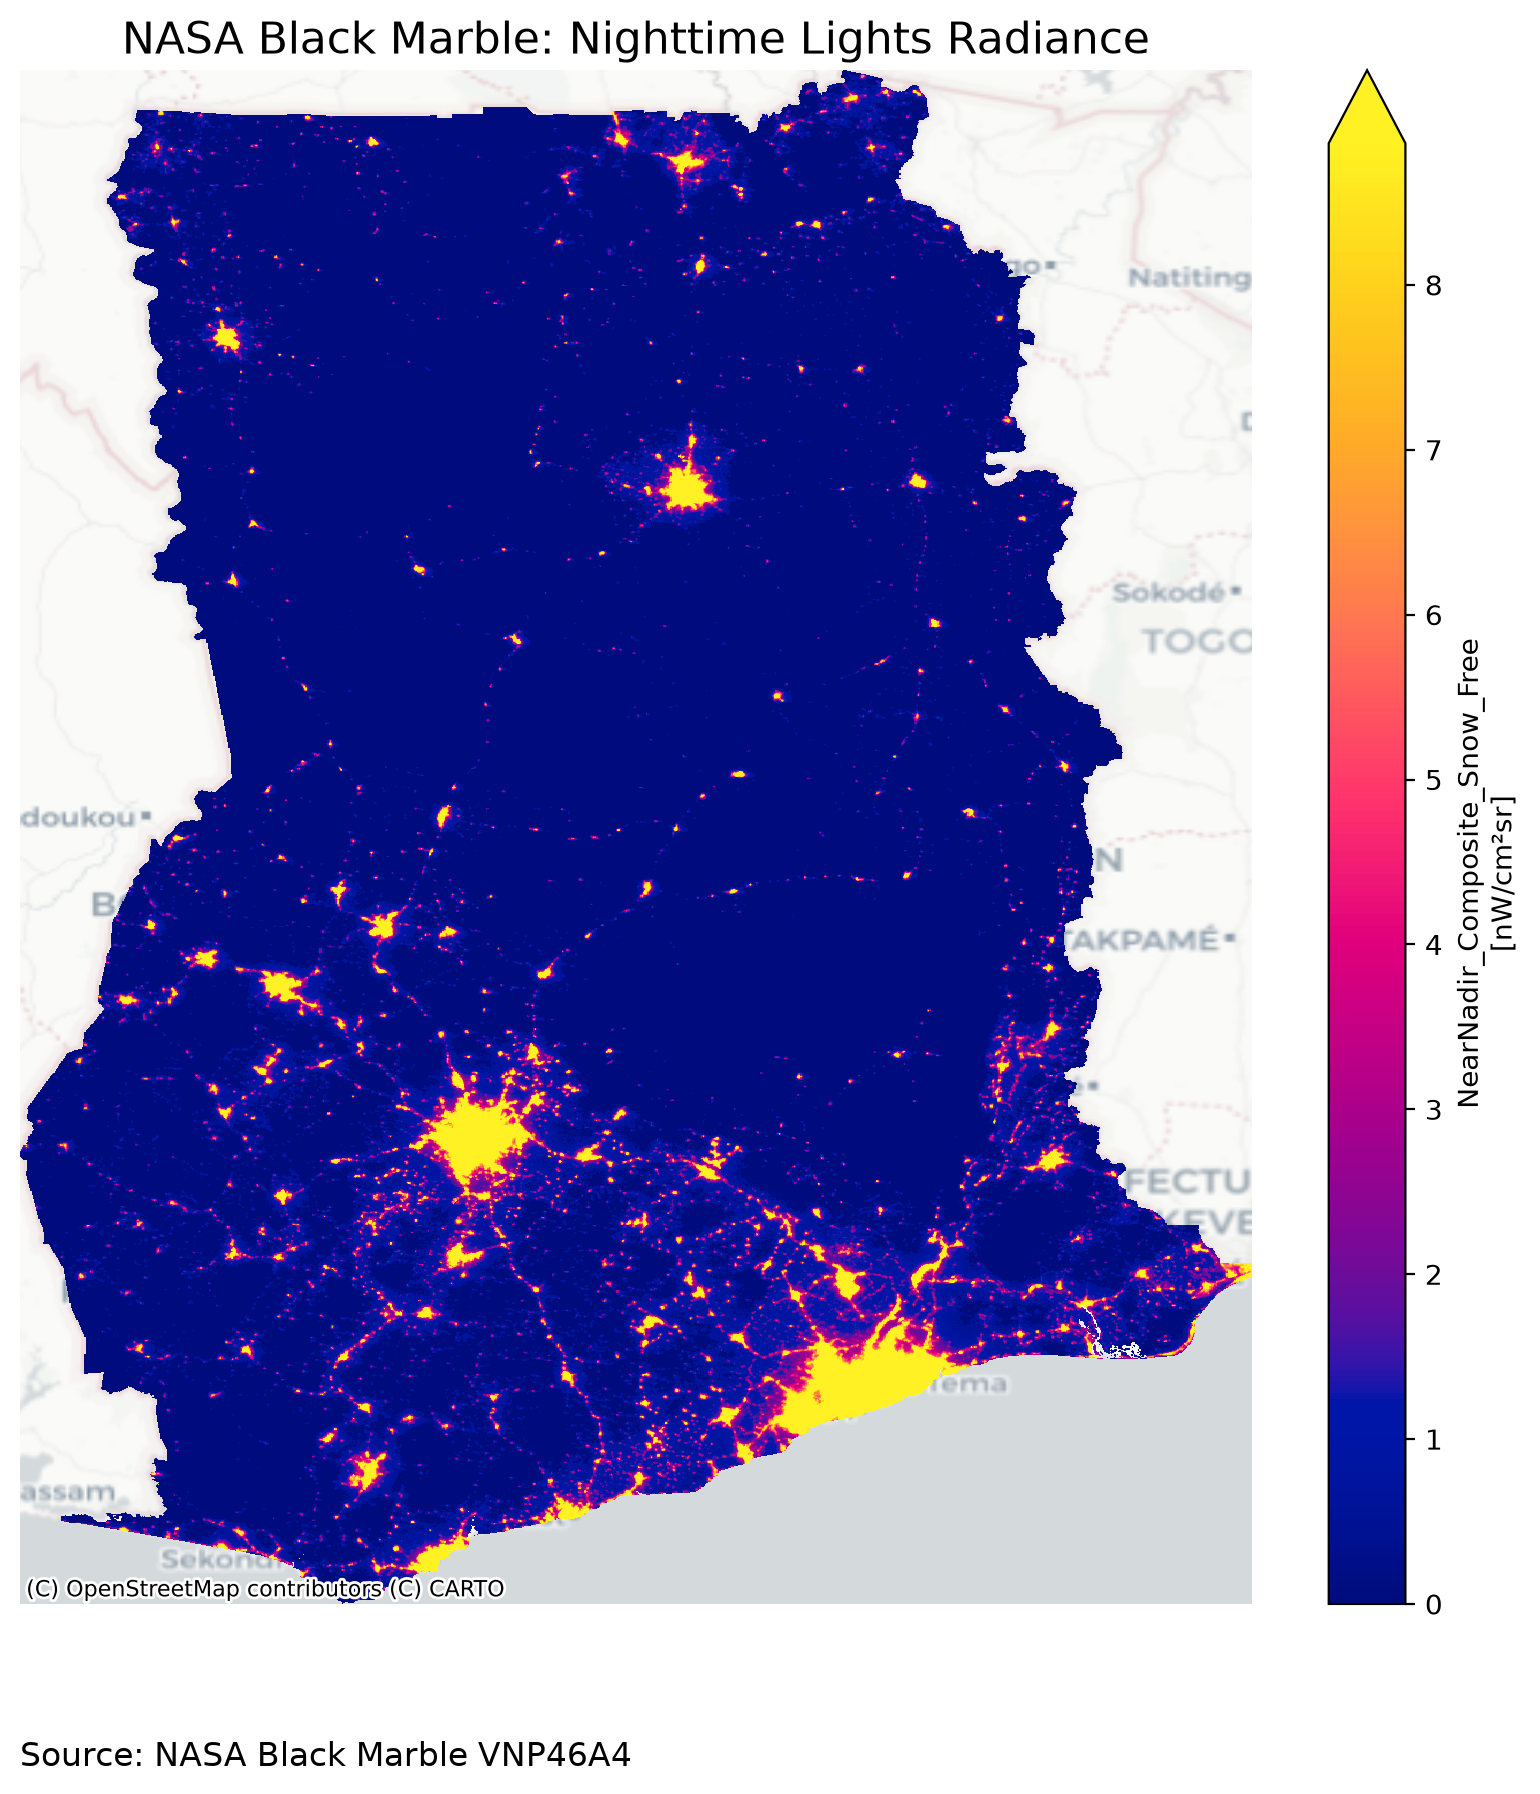
In this section, we demonstrate how to retrieve data and generate an annual nighttime lights raster for the selected Region of Interest (ROI). We then visualize the radiance values for a specific year.
NTL = bm.raster(
    gdf,
    product_id="VNP46A4",
    date_range="2025-01-01",
)
Tip
This example uses the the annual VNP46A4 product, but you can also use the daily or monthly products, VNP46A2 and VNP46A3, respectively.
Create a Raster Stack of Nighttime Lights Across Multiple Time Periods#
This section demonstrates how to retrieve and extract NASA Black Marble data for multiple dates and combine the results into a raster stack. In the resulting dataset, each raster band represents nighttime light observations for a different date. The examples below use pd.date_range to generate a sequence of dates over a specified time period.
Daily#
In this example, we demonstrate the use of the daily VNP46A2 product.
# Raster stack of daily data
r_daily = bm.raster(
    gdf,
    product_id="VNP46A2",
    date_range=pd.date_range("2026-01-01", "2026-03-01", freq="D").date.tolist(),
)
<xarray.Dataset> Size: 793MB
Dimensions:                 (x: 1070, y: 1544, time: 60)
Coordinates:
  * x                       (x) float64 9kB -3.256 -3.252 -3.248 ... 1.194 1.198
  * y                       (y) float64 12kB 11.17 11.17 11.16 ... 4.748 4.744
  * time                    (time) datetime64[ns] 480B 2026-01-01 ... 2026-03-01
Data variables:
    DNB_BRDF-Corrected_NTL  (time, y, x) float64 793MB nan nan nan ... nan nan
Attributes: (12/42)
    AlgorithmType:                     b'SCI'
    AlgorithmVersion:                  b'NPP_PR46A2 1.0.3'
    comment:                           b'For additional information regarding...
    Conventions:                       b'CF-1.6'
    creator_email:                     b'modis-ops@lists.nasa.gov'
    creator_name:                      b'VIIRS Land SIPS Processing Group'
    ...                                ...
    VerticalTileNumber:                b'07'
    WestBoundingCoord:                 -10.0
    AREA_OR_POINT:                     Area
    scale_factor:                      1.0
    add_offset:                        0.0
    _FillValue:                        nan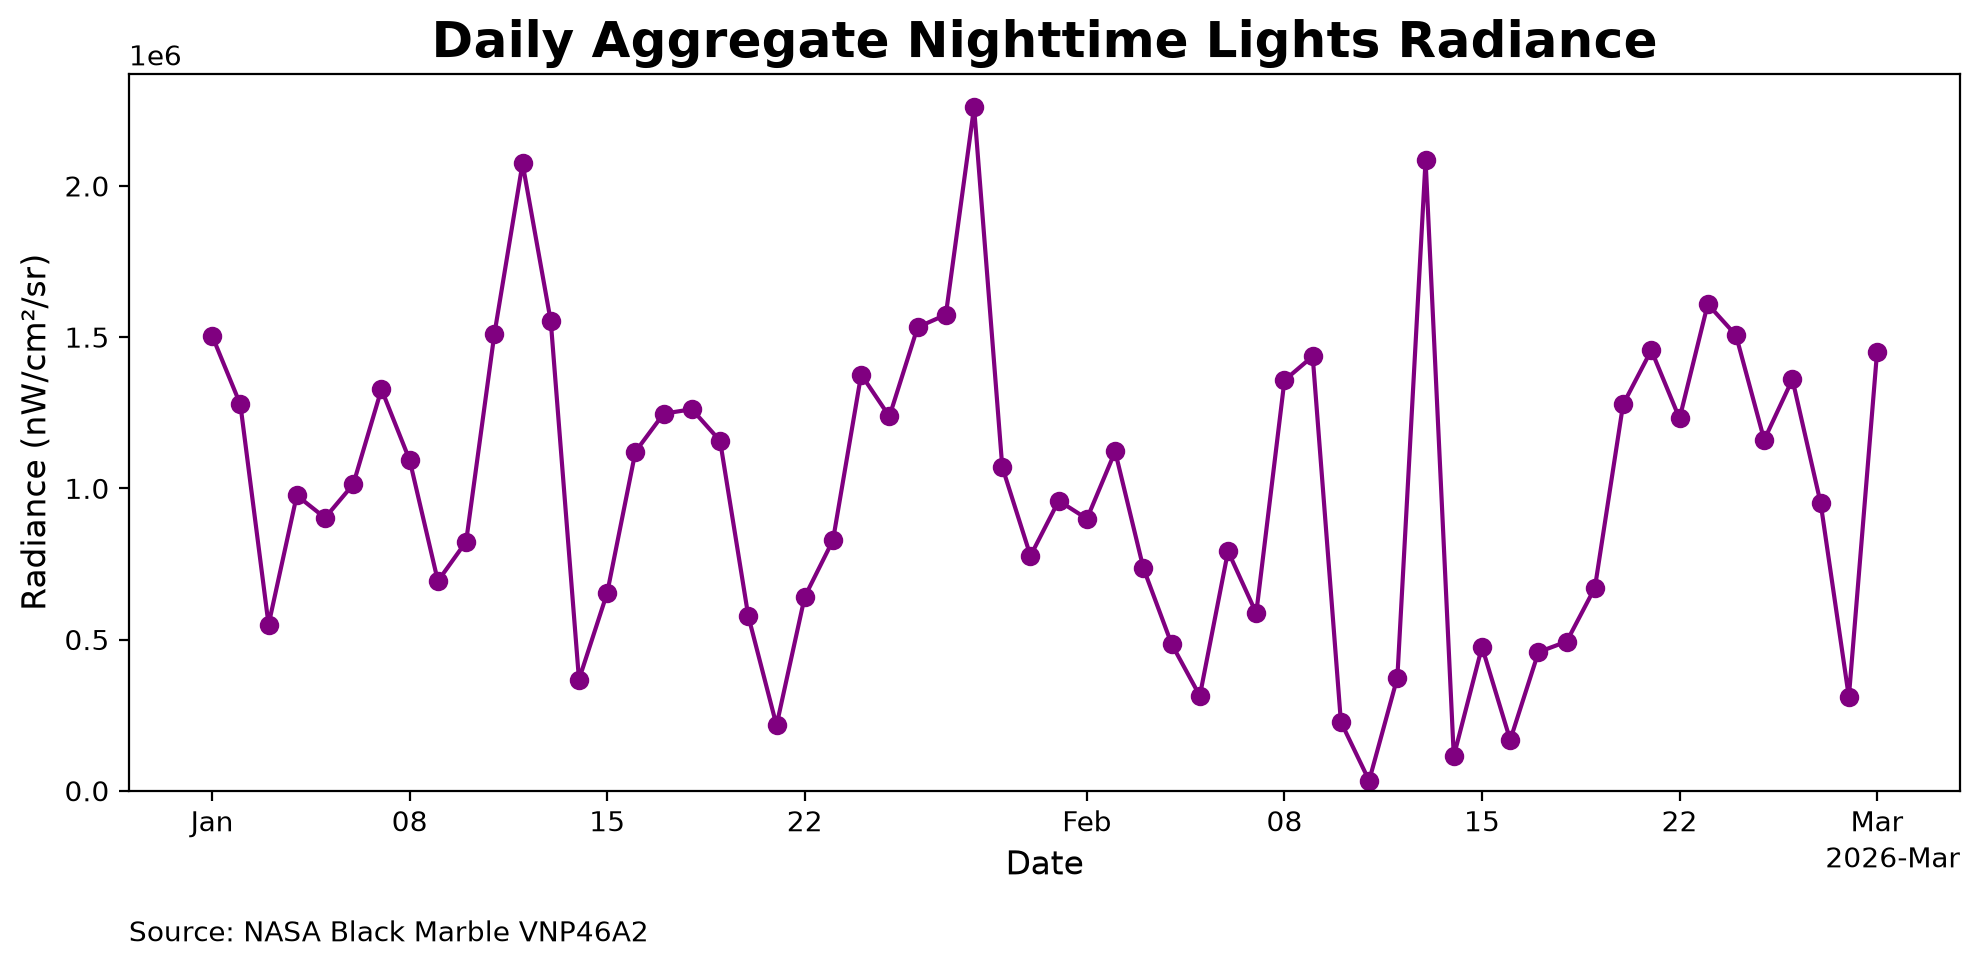

Fig. 2 This figure shows the daily aggregate nighttime lights radiance data plotted over time. The data reflects fluctuations in radiance levels due to varying cloud cover, affecting the accuracy of the measurements#
Monthly#
In this section, we provide an example demonstrating the use of the yearly VNP46A3 product. Any date supplied is automatically normalized to the corresponding month by using the first day of that month.
# Raster stack of monthly data
r_monthly = bm.raster(
    gdf,
    product_id="VNP46A3",
    date_range=pd.date_range("2020-01-01", "2026-03-01", freq="MS").date.tolist(),
)
<xarray.Dataset> Size: 991MB
Dimensions:                        (x: 1070, y: 1544, time: 75)
Coordinates:
  * x                              (x) float64 9kB -3.256 -3.252 ... 1.194 1.198
  * y                              (y) float64 12kB 11.17 11.17 ... 4.748 4.744
  * time                           (time) datetime64[ns] 600B 2020-01-01 ... ...
Data variables:
    NearNadir_Composite_Snow_Free  (time, y, x) float64 991MB nan nan ... nan
Attributes: (12/42)
    AlgorithmType:                     b'SCI'
    AlgorithmVersion:                  b'NPP_PR46A3 2.0.0'
    Conventions:                       b'CF-1.6'
    creator_email:                     b'modis-ops@lists.nasa.gov'
    creator_name:                      b'VIIRS Land SIPS Processing Group'
    creator_url:                       b'https://ladsweb.modaps.eosdis.nasa.gov'
    ...                                ...
    VerticalTileNumber:                b'07'
    WestBoundingCoord:                 -10.0
    AREA_OR_POINT:                     Area
    scale_factor:                      1.0
    add_offset:                        0.0
    _FillValue:                        nan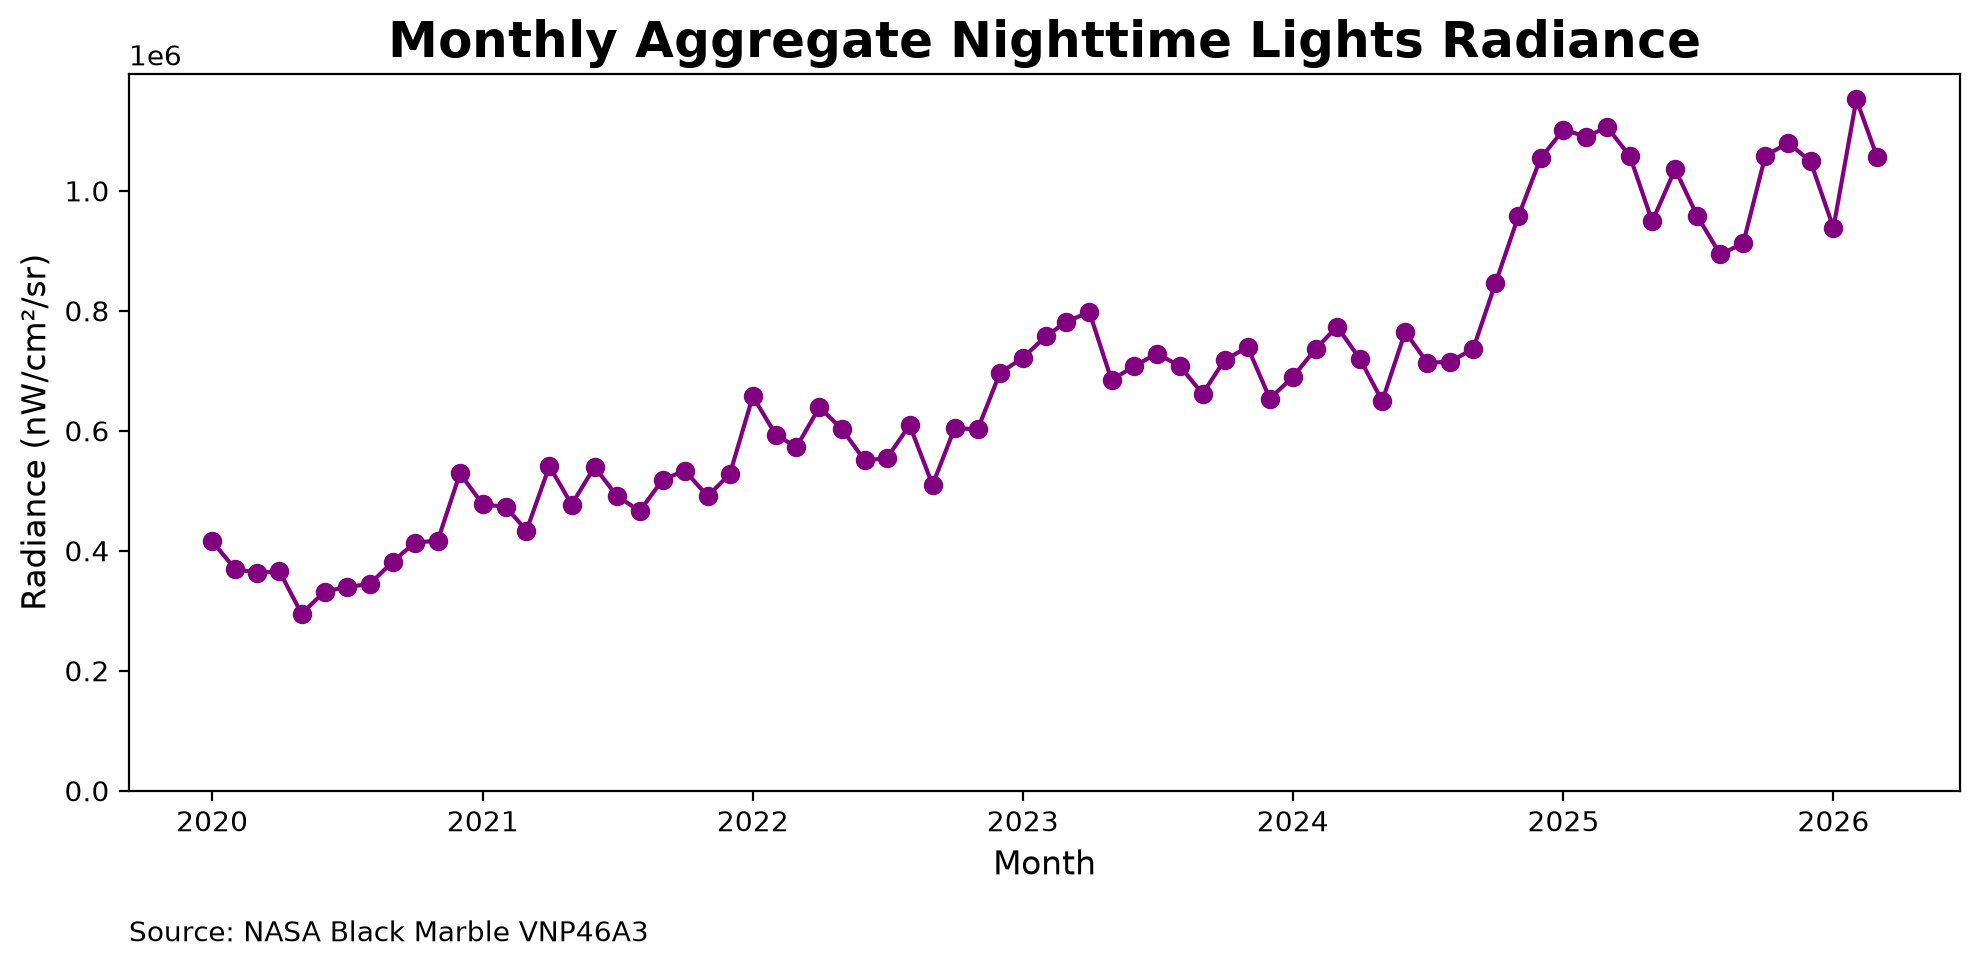
Fig. 3 This figures describes the monthly average nighttime lights radiance data plotted over time. The data reflects fluctuations in radiance levels due to varying cloud cover, affecting the accuracy of the measurements#
Yearly#
In this section, we provide an example demonstrating the use of the yearly VNP46A4 product. Any date supplied is automatically normalized to the corresponding year by using the first day of that year.
# Raster stack of yearly data
r_yearly = bm.raster(
    gdf,
    product_id="VNP46A4",
    date_range=pd.date_range("2020-01-01", "2025-01-01", freq="YS").date.tolist(),
)
<xarray.Dataset> Size: 79MB
Dimensions:                        (x: 1070, y: 1544, time: 6)
Coordinates:
  * x                              (x) float64 9kB -3.256 -3.252 ... 1.194 1.198
  * y                              (y) float64 12kB 11.17 11.17 ... 4.748 4.744
  * time                           (time) datetime64[ns] 48B 2020-01-01 ... 2...
Data variables:
    NearNadir_Composite_Snow_Free  (time, y, x) float64 79MB nan nan ... nan nan
Attributes: (12/42)
    AlgorithmType:                     b'SCI'
    AlgorithmVersion:                  b'NPP_PR46A3 2.0.0'
    Conventions:                       b'CF-1.6'
    creator_email:                     b'modis-ops@lists.nasa.gov'
    creator_name:                      b'VIIRS Land SIPS Processing Group'
    creator_url:                       b'https://ladsweb.modaps.eosdis.nasa.gov'
    ...                                ...
    VerticalTileNumber:                b'07'
    WestBoundingCoord:                 -10.0
    AREA_OR_POINT:                     Area
    scale_factor:                      1.0
    add_offset:                        0.0
    _FillValue:                        nan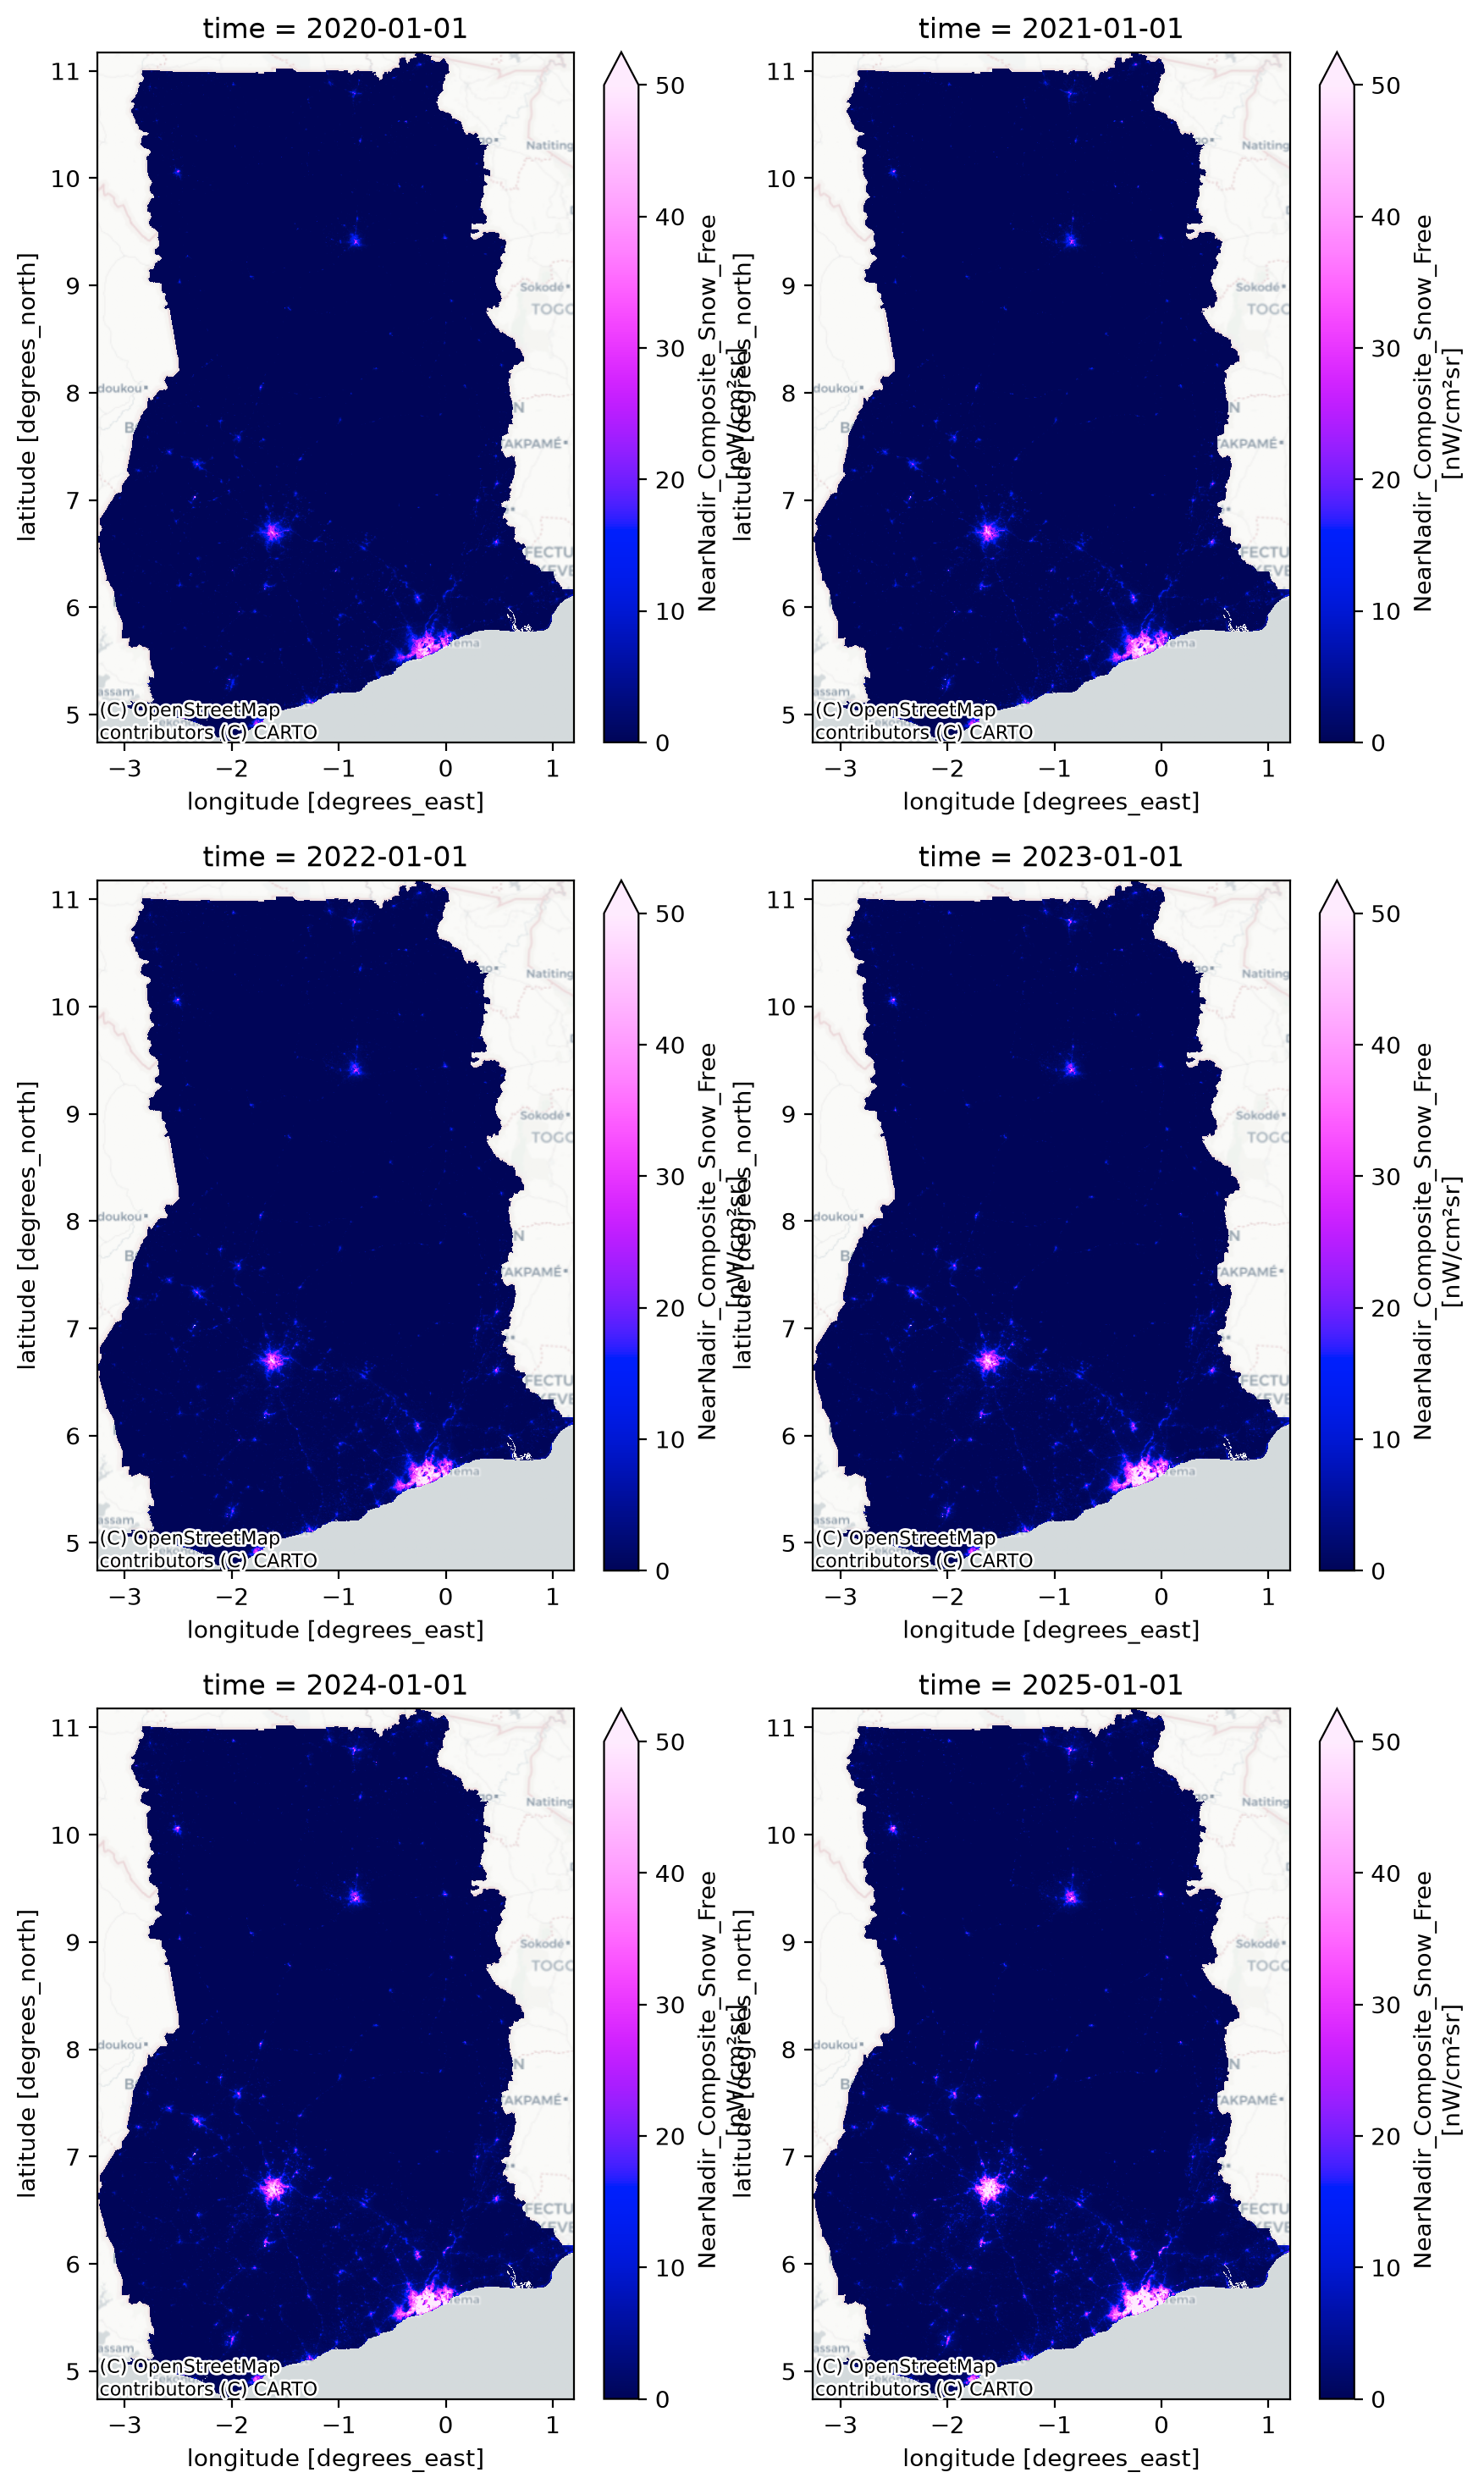
Fig. 4 Temporal variation of NearNadir_Composite_Snow_Free mapped over multiple years. Each subplot represents a different time period overlaid with a basemap.#
Visualizing difference in radiance year over year#
Lastly, we are now able to compare and calculate the increase/decrease in nighttime lights radiance levels across different points in time.
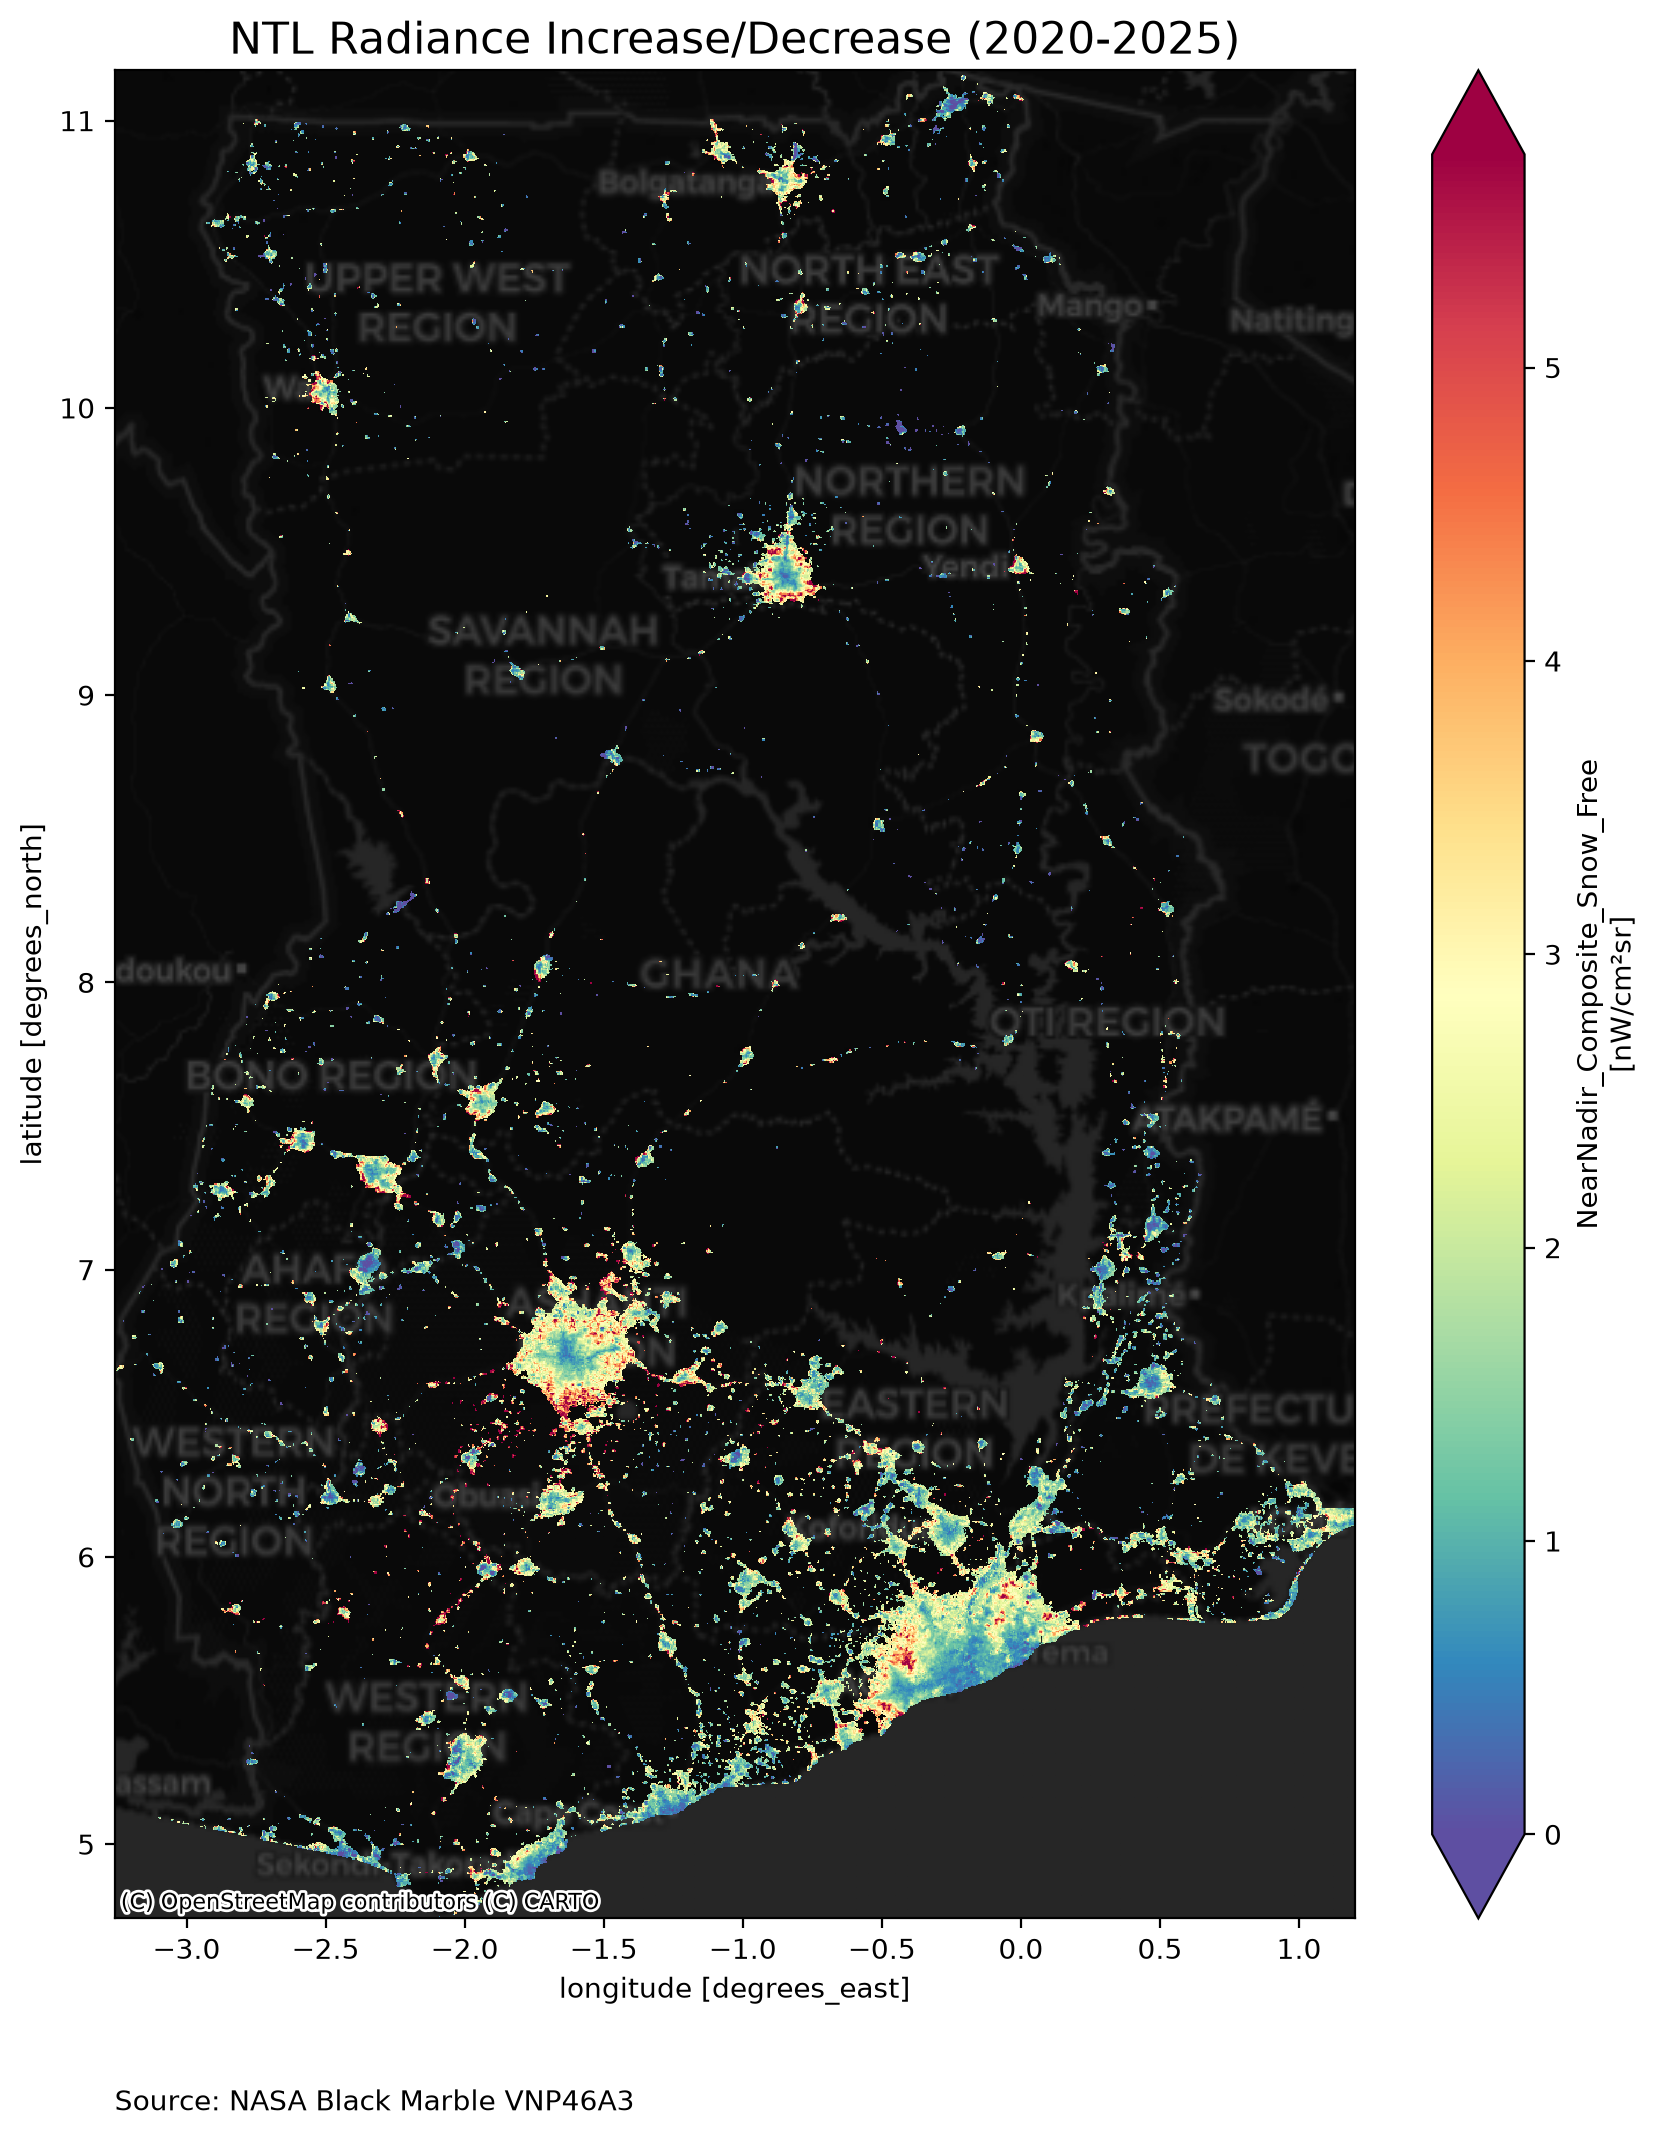
Fig. 5 This figure displays the percentage change in radiance over the years. The data are sourced from NASA’s Black Marble VNP46A3 product.#
Compute nighttime lights zonal statistics over time#
In this section, we use the bm_extract function to observe trends in nighttime lights over time. The bm_extract function leverages the rasterstats package to aggregate nighttime lights data to polygons. In the following example, we show trends in annual nighttime lights data across first-administrative divisions.
NTL_ZONAL_TIMESERIES_DF = bm.extract(
    gdf,
    "VNP46A4",
    pd.date_range("2012-01-01", "2025-01-01", freq="YS").date.tolist(),
)
Fig. 6 This figure illustrates the trend in nighttime lights radiance over the years. The X-axis represents the years while the Y-axis measures the radiance in nanowatts per square centimeter per steradian (nW/cm²/sr). The data highlights changes in light intensity, which can be indicative of economic activity, urbanization, and infrastructure development. Data source: NASA Black Marble VNP46A4 retrieved with BlackMarblePy.#
Downloading and Storing Black Marble data#
In this section, we provide a guide on using BlackMarblePy to download NASA Black Marble data and save it to a specified local directory. You can use the output_directory parameter to designate the directory for saving the files. By default, files that have already been downloaded will not be re-downloaded in subsequent executions.
BlackMarble(
    output_directory="data/",     # Save files to local data/ directory
    output_skip_if_exists=True,   # Set to skip if exists
).raster(
    gdf,
    product_id,
    date_range,
)
Alternatively, set output_skip_if_exists=False to force the redownload of files from NASA.
References#
- 1
Miguel O. Román, Zhuosen Wang, Qingsong Sun, Virginia Kalb, Steven D. Miller, Andrew Molthan, Lori Schultz, Jordan Bell, Eleanor C. Stokes, Bhartendu Pandey, Karen C. Seto, Dorothy Hall, Tomohiro Oda, Robert E. Wolfe, Gary Lin, Navid Golpayegani, Sadashiva Devadiga, Carol Davidson, Sudipta Sarkar, Cid Praderas, Jeffrey Schmaltz, Ryan Boller, Joshua Stevens, Olga M. Ramos González, Elizabeth Padilla, José Alonso, Yasmín Detrés, Roy Armstrong, Ismael Miranda, Yasmín Conte, Nitza Marrero, Kytt MacManus, Thomas Esch, and Edward J. Masuoka. Nasa's black marble nighttime lights product suite. Remote Sensing of Environment, 210:113–143, 2018. URL: https://www.sciencedirect.com/science/article/pii/S003442571830110X, doi:https://doi.org/10.1016/j.rse.2018.03.017.
- 2
Gabriel Stefanini Vicente and Robert Marty. BlackMarblePy: Georeferenced Rasters and Statistics of Nighttime Lights from NASA Black Marble. https://worldbank.github.io/blackmarblepy, 2023. URL: https://worldbank.github.io/blackmarblepy, doi:10.5281/zenodo.10667907.