SPARC Building Scan
Welcome to the SPARC Building Scan page. This website provides an introduction to the Building Scan data product, serves as a guide for technical users, and documents the detailed methodology behind the analysis.
The Building Scan product provides detailed insights into a city’s building stock, including building types, heights, footprints, and other relevant attributes. This enables city planners, policymakers, and investors to make informed decisions regarding urban development, infrastructure planning, and risk assessment.
Building Scan Workflow
The Building Scan product generates high-quality, analysis-ready building footprints for a given city. Building footprints are digitized polygons outlining each building across an area of interest. They are a foundational data layer for urban planning, climate risk and resilience analytics, infrastructure and service gap assessments, and cadastral systems.
Project teams often default to public sources such as OpenStreetMap or Google Open Buildings. While these are valuable resources, their accuracy varies greatly by location. Their buildings may be outdated or missing in informal and recently developed areas, contain faulty polygons, or lack key attributes. Building Scan provides a consolidated workflow to help teams choose the most suitable building layer from three options.
1. Open-Source Layers
Integrates public datasets (Overture, OSM, 3D GlobFP), with cleaning to remove duplicates and false positives.
2. AI Extraction
Option 1, supplemented with AI extraction in poorly mapped areas (missing or outdated buildings), using high-resolution satellite imagery and the open-source Segment Anything Model (SAM3).
3. Manual Digitization
Digitization carried out by a specialist firm using procured imagery.
| Option 1 — Open-Source | Option 2 — AI Extraction | Option 3 — Digitization | |
|---|---|---|---|
| Approach | Integration of public datasets | Option 1 plus AI-derived buildings from imagery | Digitization by a specialist firm using procured imagery |
| Output | Footprints with height and year, plus completeness assessment | High-coverage footprints with height and year | Full-coverage footprints with height and year |
| Cost | < $5k | ~$10k | ~30k |
| Turnaround | 2 weeks | 4 to 6 weeks | 3–6 months |
| Accuracy | Moderate | High (~0.8) | Very high (~0.9) |
Data Attributes
Each building is assigned the following attributes.
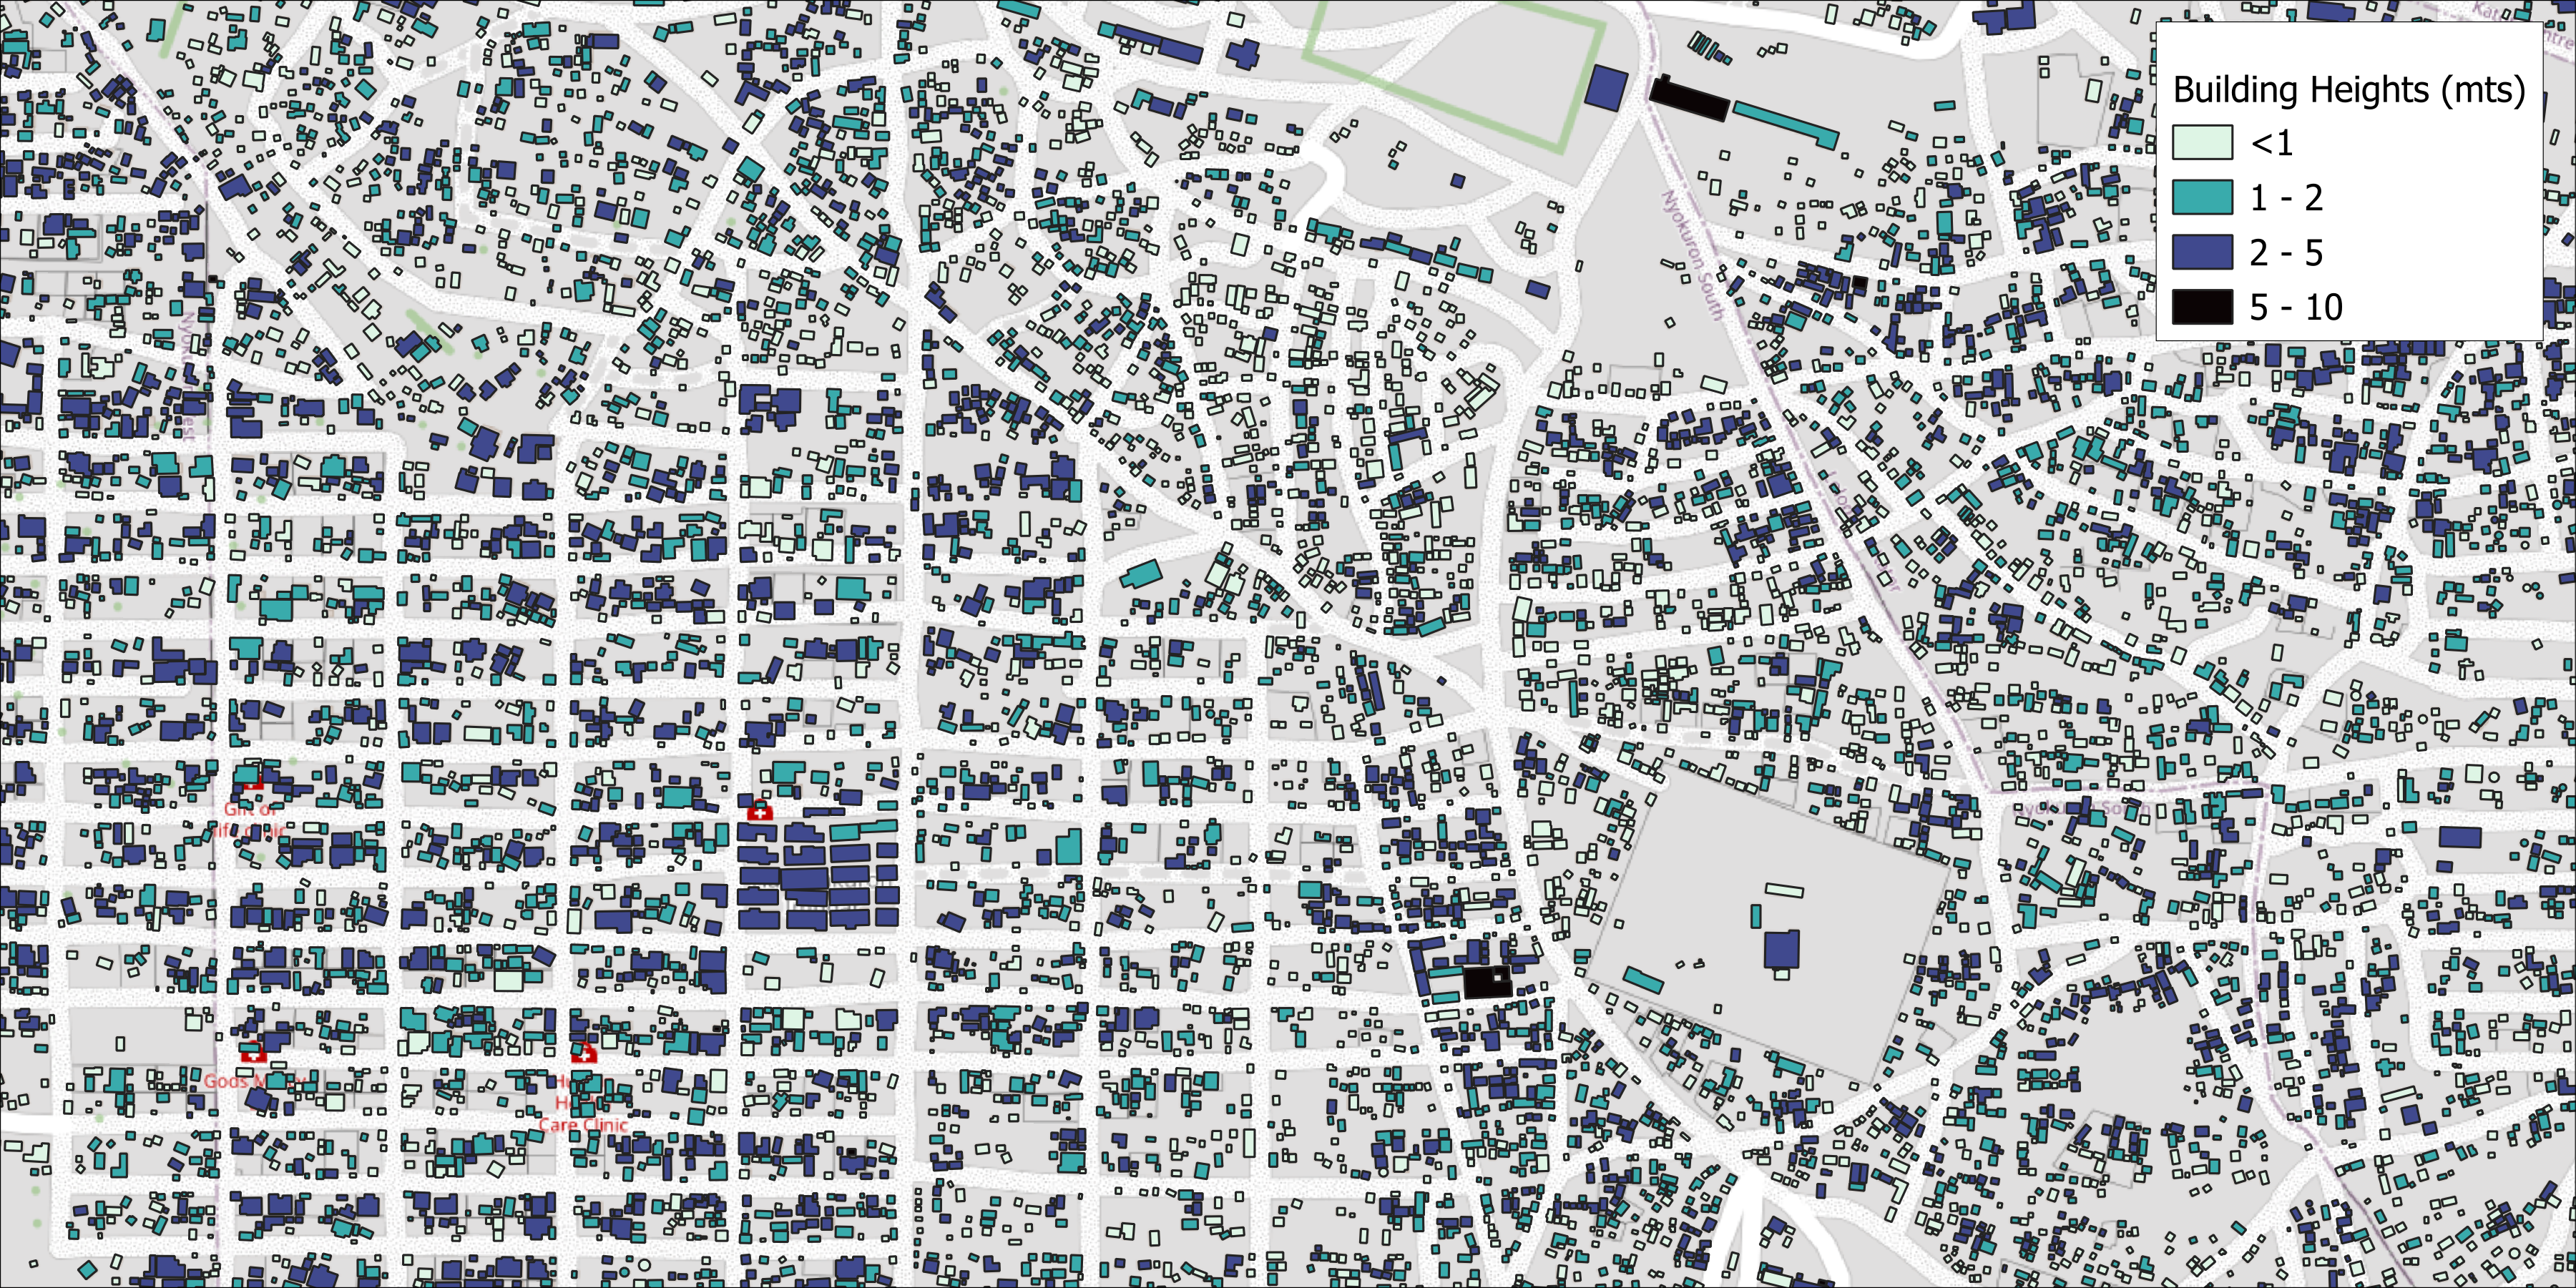
- Building Heights: Information on the vertical dimension of buildings, which is crucial for urban planning and risk assessment.
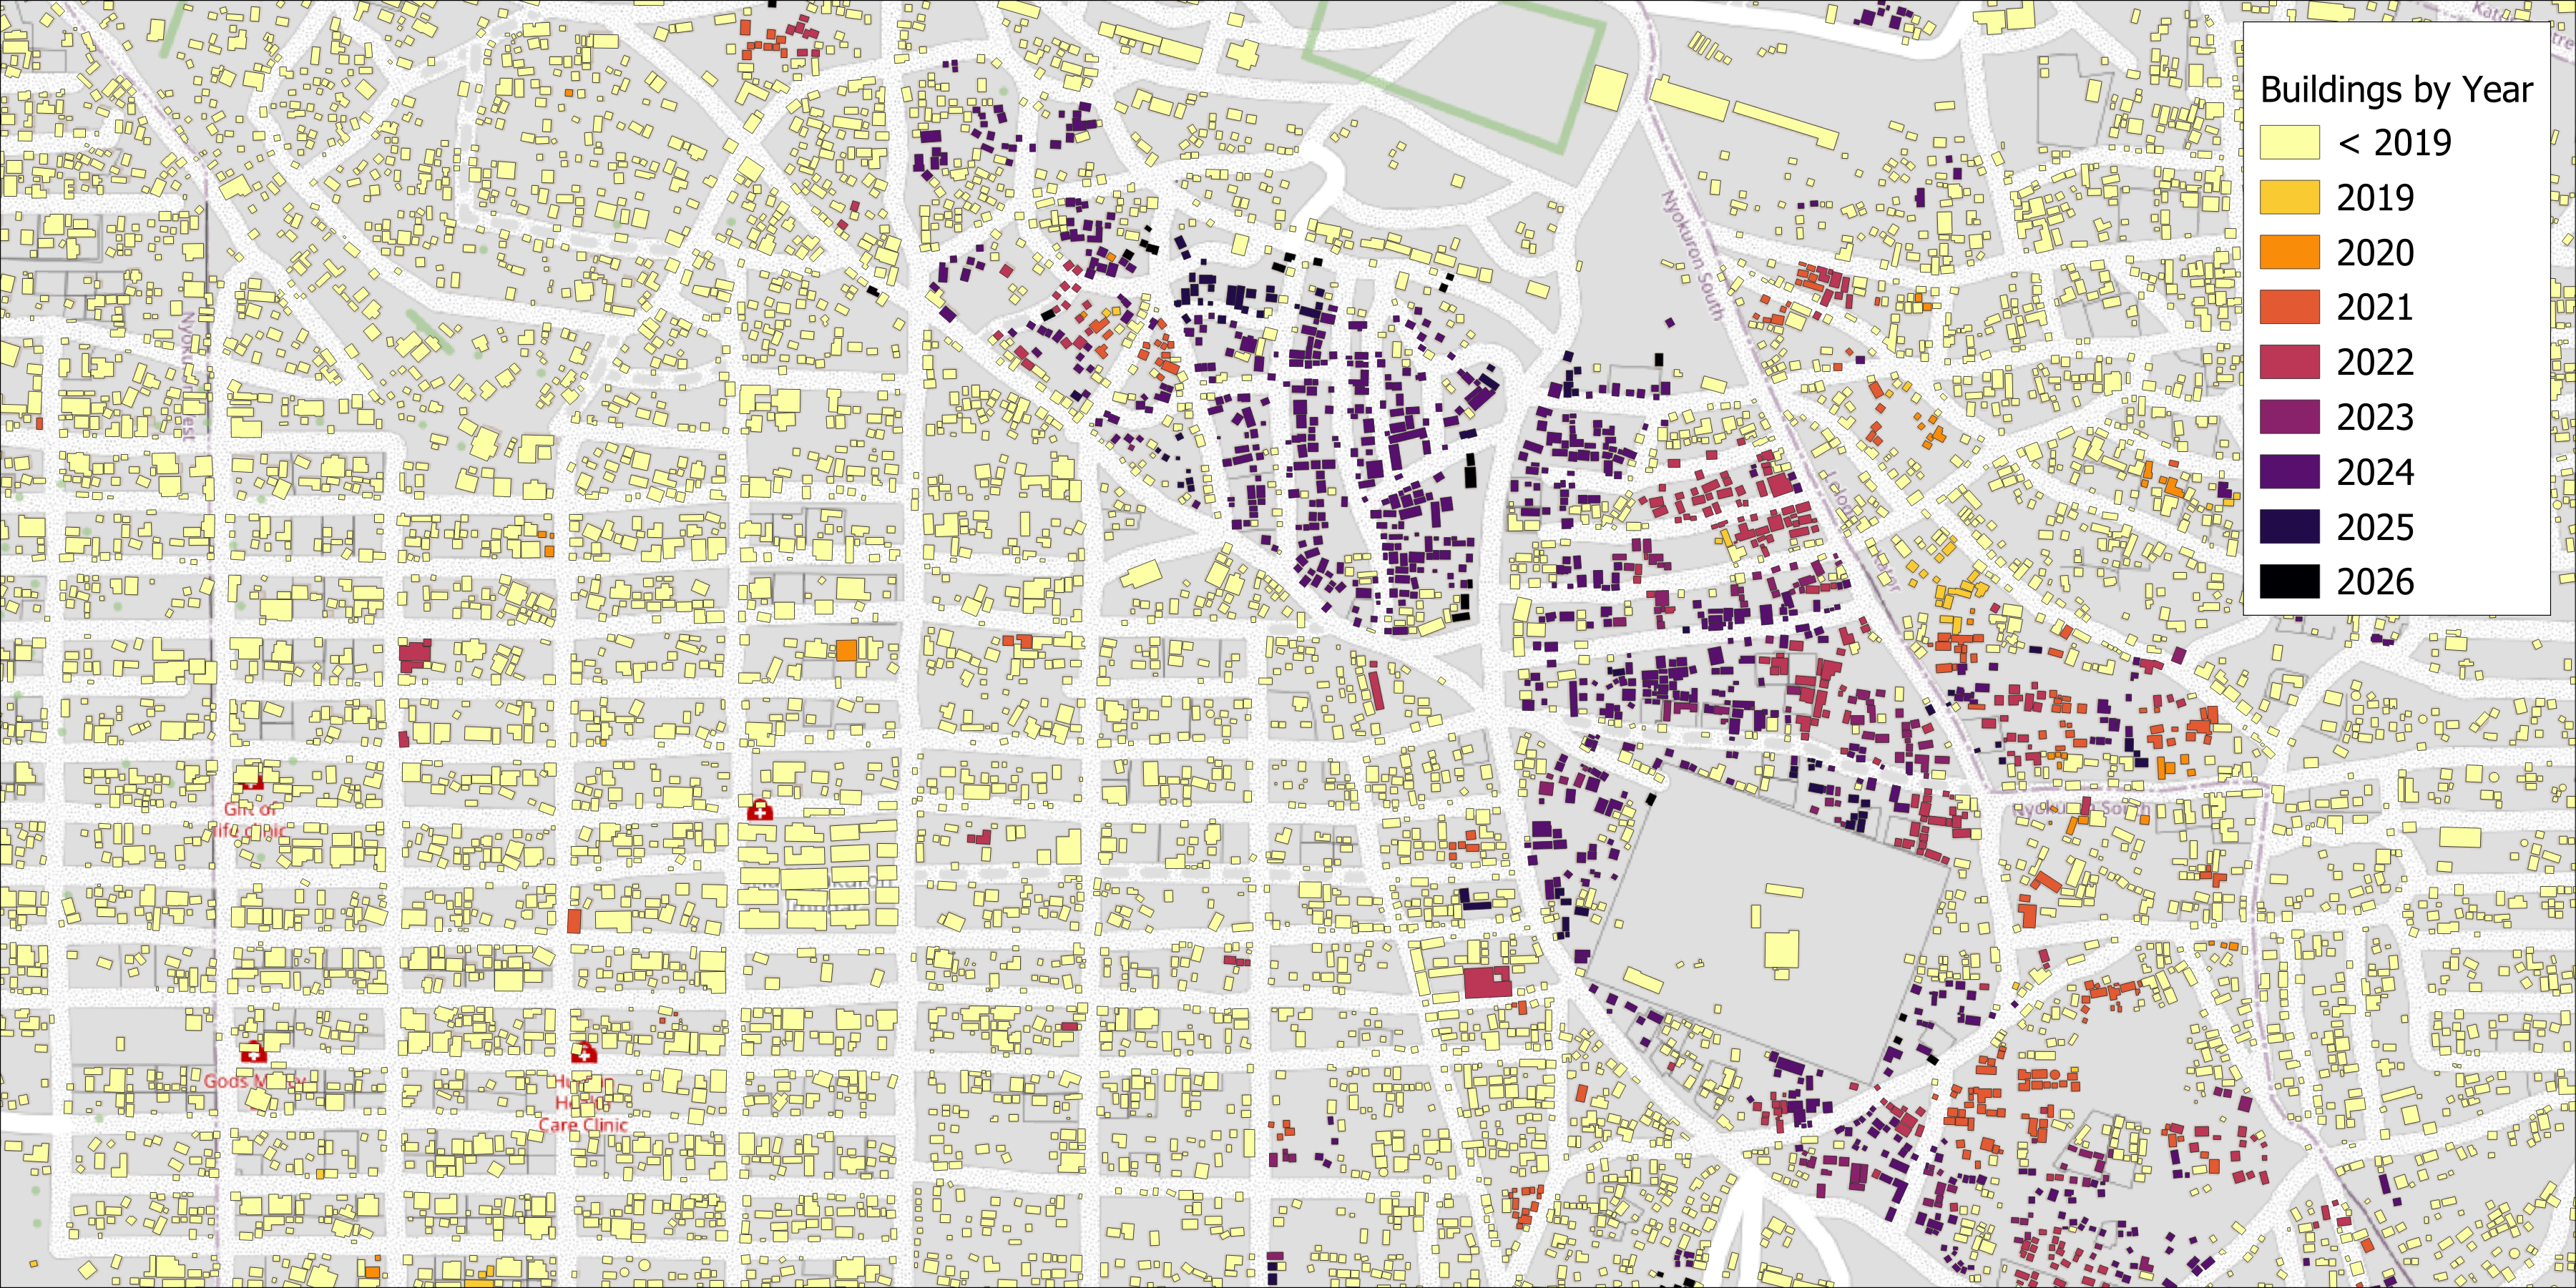
- Building Age: Information on the age of buildings, which can be important for understanding the historical development of the city and for assessing the need for maintenance or retrofitting.
SPARC Project Background
Cities in developing countries often lack current, reliable, and accessible geospatial data. Existing information is frequently fragmented across analog or disconnected systems, costly to acquire and analyze, and difficult to reuse because of inconsistent licensing and limited technical capacity. The Smart Parcel Atlas for Resilient Cities (SPARC) program addresses this gap by creating a shared, scalable platform for urban geospatial intelligence. There are three tiers of the SPARC program: 1. Tier 1 — Global urban data and analytics 2. Tier 2 — City-specific geospatial intelligence 3. Tier 3 — Operational uptake and client integration
Tier 1 — Global urban data and analytics
Provides standardized, quality-assured geospatial data and automated statistics for approximately 10,000 cities worldwide. Supports early operational scoping and serves as a “conversation starter” for country and city engagements. Made available through the SPARC Toolkit on GeoInsights for internal and external users.
Tier 2 — City-specific geospatial intelligence
Delivers higher-resolution, on-demand analytics for up to 100 priority cities. Supports investment option assessment and site prioritization through six initial services: buildings and parcels; urban public infrastructure; extreme heat exposure; multi-hazard exposure; green infrastructure; and urban settlement forecasts.
Tier 3 — Operational uptake and client integration
Connects SPARC analytics directly to World Bank Group operations and client decision-making. Regional operational teams lead demand identification, client engagement, local validation, and incorporation of findings into projects and local systems.