Conflict Impact Analysis in MENAAP (2000 & 2024)#
Geography: MENA + AP countries (MENAAP). Afghanistan, Pakistan, Algeria, Morocco, Libya, Yemen, Iran, Iraq, Syria, Egypt, Lebanon, Djibouti, United Arab Emirates, Jordan, West Bank and Gaza, Oman, Qatar, Saudi Arabia, Kuwait, Tunisia, Bahrain.
Timeline: 2000 and 2024.
Data Sources:
ACLED conflict events (acled_data_all_10022025.csv)
UCDP GED v.25.1 (ged251-csv.zip)
WorldPop 2020 UN-adjusted constrained 100m raster (for 2024 analysis)
WorldPop 2000 UN-adjusted unconstrained 1km raster (for 2000 analysis)
Conflict Definition
ACLED
Only events with at least one fatality are included in event and fatality counts.
Excluded: Peaceful protests
Included: Protests when fatality threshold is met (“Protest with intervention” and “Excessive force against protesters”)
Filter applied: ≥10 cumulative fatalities per grid tile to identify high-impact conflict zones
“People living in the same grid tile with a cumulative ≥10 conflict fatalities during the study period”
A tile is considered impacted if cumulative conflict events in that tile had at least ten fatalities during the study period.
Exposed population is the sum of population living in impacted tiles within that country.
UCDP GED v.25.1
UCDP has a strict definition of conflict event defined as “An incident where armed force was used by an organized actor against another organized actor, or against civilians, resulting in at least 1 direct death at a specific location and a specific date”
Armed force: use of arms in order to promote the parties’ general position in the conflict, resulting in deaths.
arms: any material means e.g. manufactured weapons but also sticks, stones, fire, water etc.
Organized actor: a government of an independent state, a formally organized group or an informally organized group according to UCDP criteria:
a. Government of an independent state: The party controlling the capital of a state.
b. Formally organized group: Any non-governmental group of people having announced a name for their group and using armed force against a government (state-based), another similarly formalized group (non-state conflict) or unorganized civilians (one-sided violence). The focus is on armed conflict involving consciously conducted and planned political campaigns rather than spontaneous violence.
c. Informally organized groups: Any group without an announced name, but which uses armed force against another similarly organized group (non-state conflict), where the violent activity indicates a clear pattern of violent incidents that are connected and in which both groups use armed force against the other
UCDP Filters Applied:
Precision level 1 events only (where_prec == 1)
≥1 fatality (best estimate)
Given ACLED has a looser conflict definition, we apply the additional filter of >=10 fatalities to estimate number of people living in affected areas. Given UCDP has a stricter conflict definition, we do not apply the same filter. The validity of this approach is still being evaluated.
Population Data
Population data for 2024 analysis:
WorldPop 2020 UN-adjusted constrained 100m population raster
Uses building footprints to allocate population
Source file: MENAAP_pop_quad12.gpkg
Population data for 2000 analysis:
WorldPop 2000 UN-adjusted unconstrained 1km population raster
Does not use building footprints
Source file: pop_highfat_ucdp_acled_2000.csv
Important Notes on Population Data:
Population data for 2024 uses a constrained methodology which includes building footprints. Population data for 2000 uses the unconstrained methodology.This means that the population in 2000 could be undercounting urban population and misallocating people in uninhabited areas, while the 2024 population could be overallocating people where building estimates are missed.Population totals are obtained by summing WorldPop populations (not official census totals), so country totals may differ from World Bank official figures.
Exposed population calculations use the population data corresponding to the analysis year (2020 data for 2024 analysis, 2000 data for 2000 analysis).
Spatial Aggregation and Grid Size
Gridding scheme: Bing quadkey tiles zoom level 12 (~60–80 km² per tile)
Tiles clipped to country boundaries using MENAP_regional_quadkey12.gpkg
Conflict events geocoded to quadkey tiles using latitude/longitude coordinates
Grid area varies with latitude; figures are approximate
Analysis Outputs
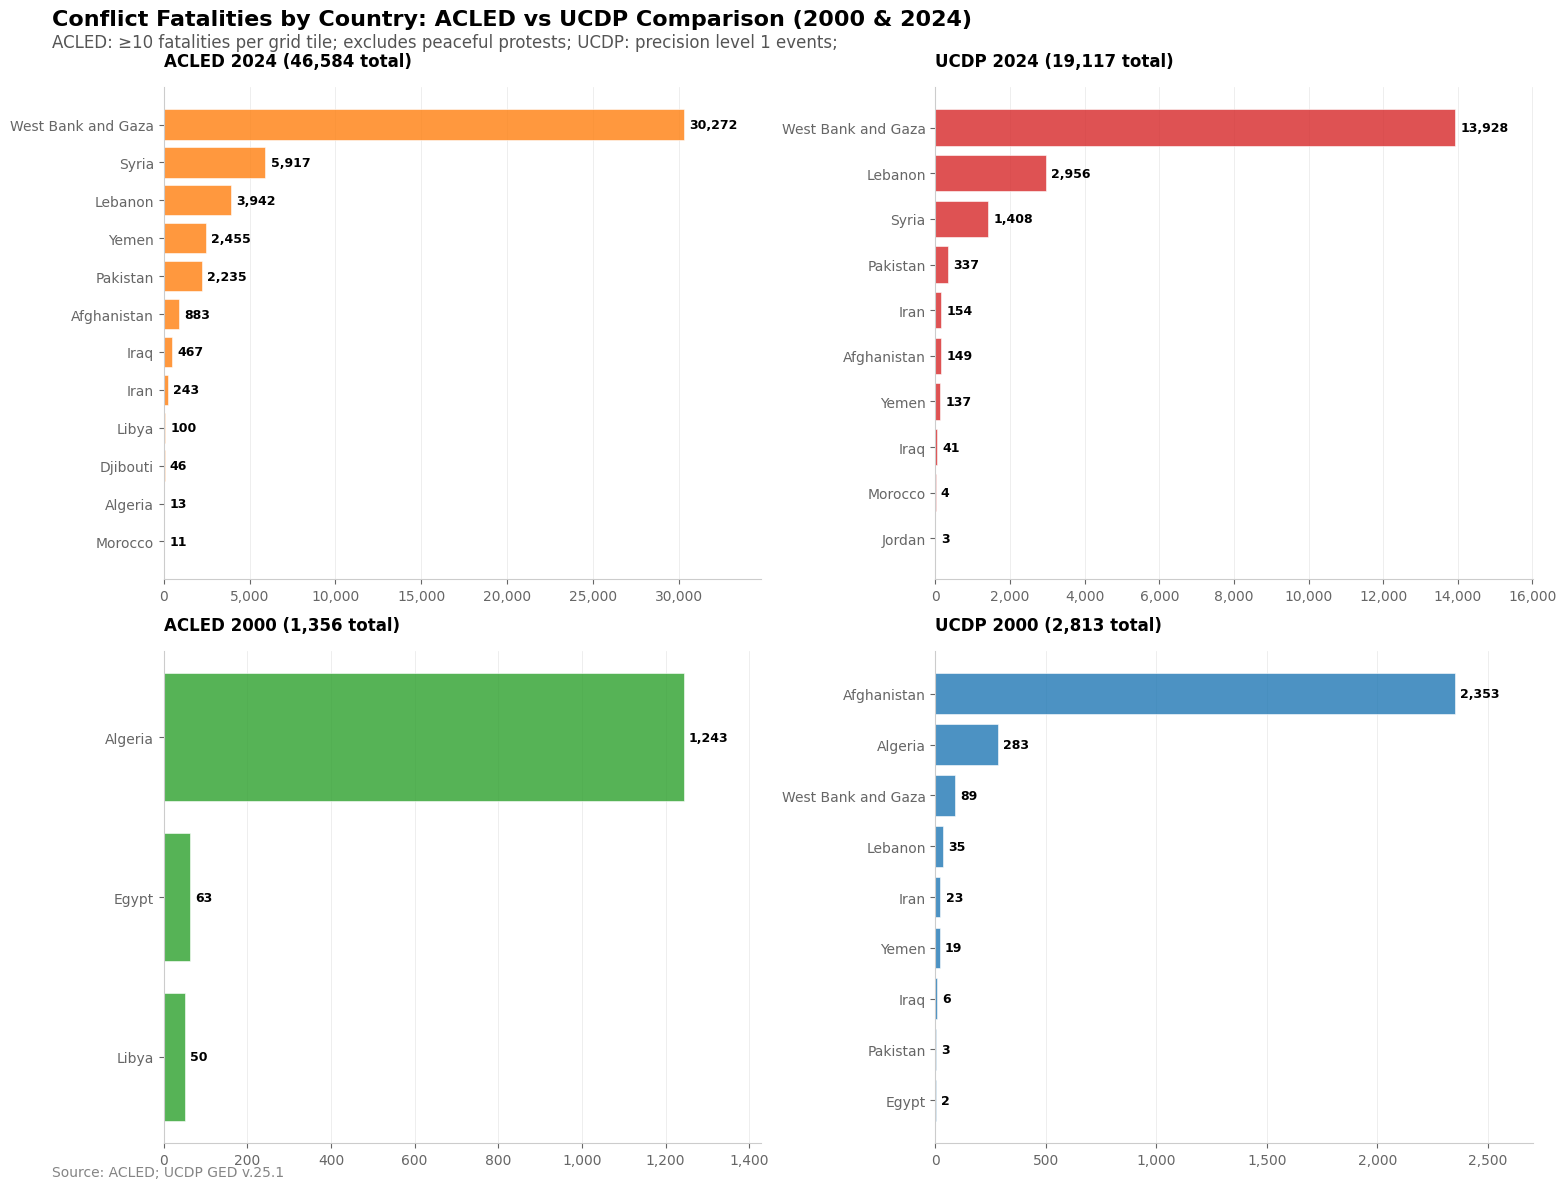
Fatality Comparison Chart: 4-subplot bar chart comparing ACLED vs UCDP fatalities by country for 2000 and 2024
Output: fatalities_country_breakdown_acled_ucdp_2000_2024.png
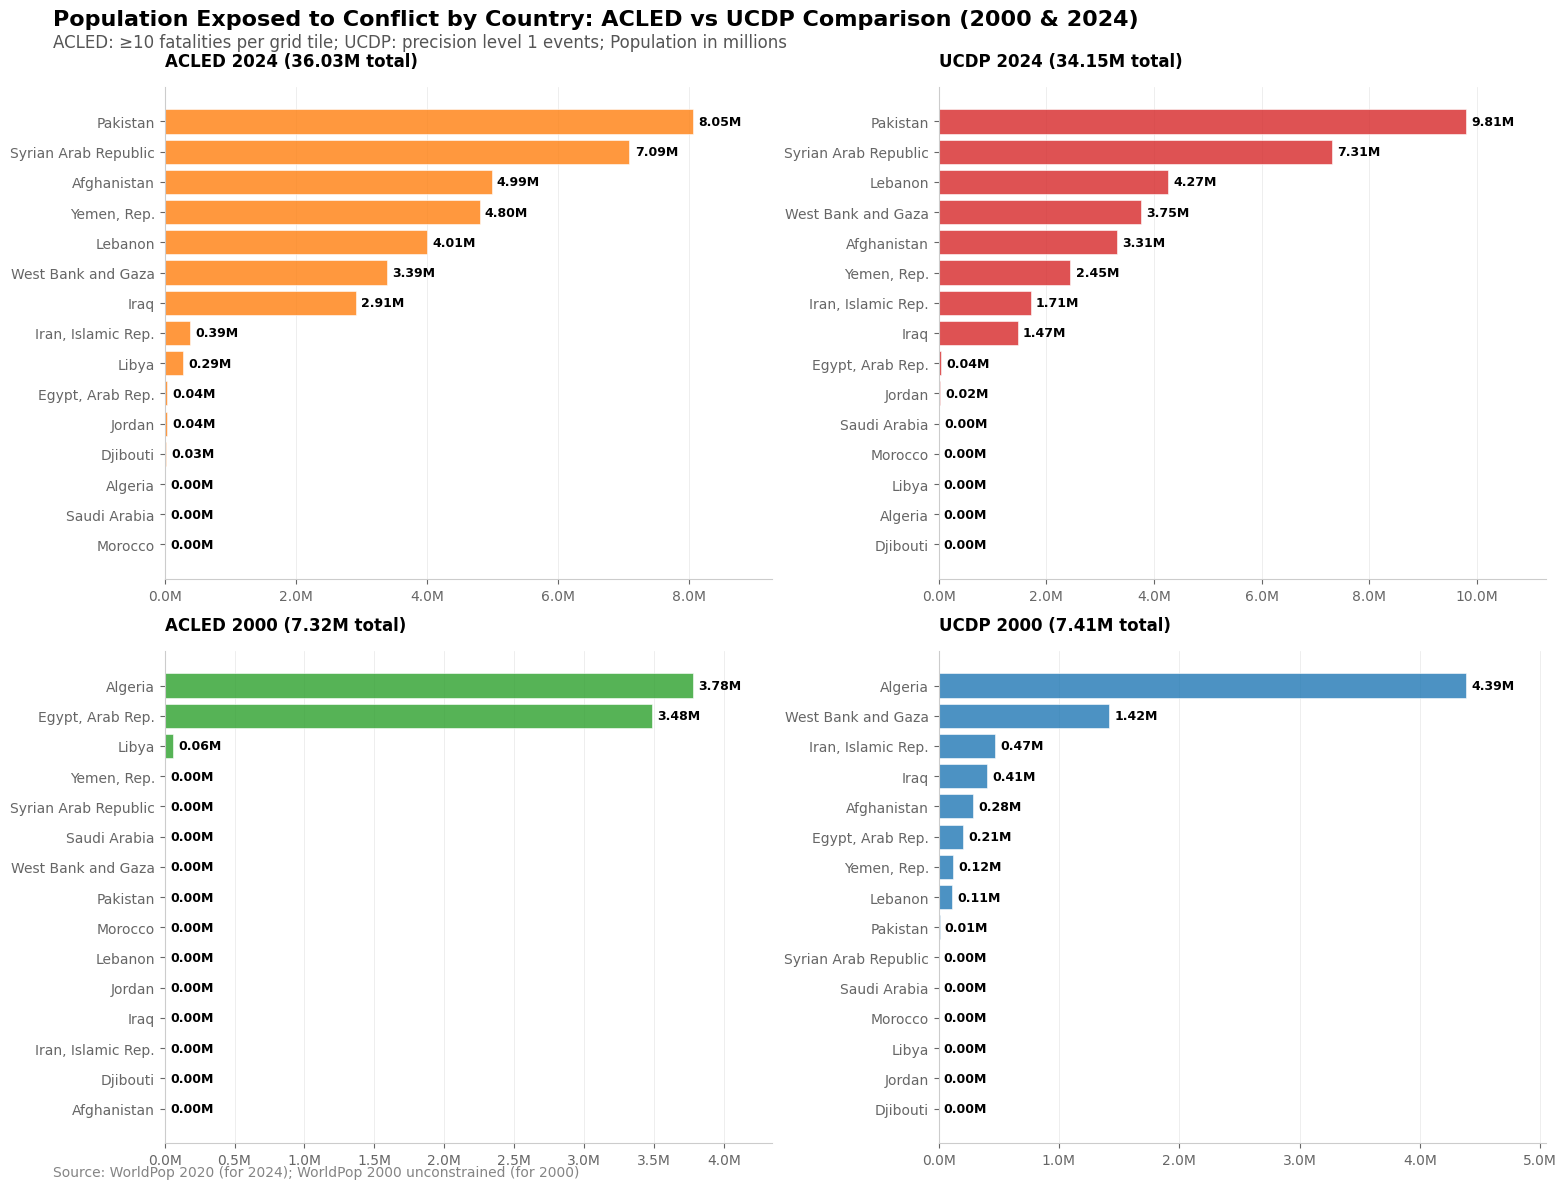
Population Exposed Chart: 4-subplot bar chart showing population (in millions) exposed to conflict by country
Output: population_exposed_country_breakdown_acled_ucdp_2000_2024.png
Interactive Map: Folium map with 6 toggleable layers showing conflict zones with population and fatality tooltips
Layers: UCDP only 2000, ACLED only 2000, Both 2000, UCDP only 2024, ACLED only 2024, Both 2024
Output: conflict_comparison_2000_2024_layered.html
Notes and Caveats
Grid area varies with latitude; figures are approximate.
Excluding “Peaceful protest” and zero-fatality events reduces counts relative to broader unrest measures.
ACLED event geocoding precision varies; results should be interpreted with this uncertainty in mind.
UCDP precision level filtering means only events with precise location data are included.
Population estimates use WorldPop data which may differ from official census figures.
Different population methodologies between 2000 and 2024 may affect comparability.
Country name standardization applied for consistency across datasets.
Comparing availability of data in ACLED and UCDP#
| country | acled_first_year | ucdp_first_year | |
|---|---|---|---|
| 0 | Afghanistan | 2017 | 1989 |
| 1 | Algeria | 1997 | 1990 |
| 2 | Bahrain | 2016 | 2011 |
| 3 | Djibouti | 1998 | 1989 |
| 4 | Egypt | 1997 | 1990 |
| 5 | Iran | 2016 | 1990 |
| 6 | Iraq | 2016 | 1989 |
| 7 | Jordan | 2016 | 1992 |
| 8 | Kuwait | 2020 | 1990 |
| 9 | Lebanon | 2016 | 1989 |
| 10 | Libya | 1997 | 2008 |
| 11 | Morocco | 1997 | 1989 |
| 12 | Oman | 2021 | <NA> |
| 13 | Pakistan | 2010 | 1989 |
| 14 | Qatar | 2025 | 2004 |
| 15 | Saudi Arabia | 2015 | 1991 |
| 16 | Syria | 2017 | 2004 |
| 17 | Tunisia | 1999 | 2002 |
| 18 | United Arab Emirates | 2020 | 2010 |
| 19 | West Bank and Gaza | 2016 | 1989 |
| 20 | Yemen | 2015 | 1994 |
Conflict Fatalities Comparison#
Population Exposed Summary 2024 (using 2020 WorldPop data)#
Population Exposed Comparison by Country#
pop_ucdp_2000
| country_code | population | |
|---|---|---|
| 0 | AFG | 2.835790e+05 |
| 1 | DZA | 4.386837e+06 |
| 2 | EGY | 2.064662e+05 |
| 3 | IRN | 4.706774e+05 |
| 4 | IRQ | 4.060537e+05 |
| 5 | LBN | 1.100517e+05 |
| 6 | PAK | 7.825366e+03 |
| 7 | PSE | 1.416476e+06 |
| 8 | YEM | 1.207514e+05 |
df = data[data['index'].isin(acled_2000_highfat['index'])]
df = df.groupby(['index', 'country'])['fatalities'].sum().reset_index()
df.country.value_counts()
country
Algeria    32
Egypt       3
Libya       1
Name: count, dtype: int64
duplicate_check = pop_highfat_ucdp_acled_2000.groupby(['index'])['country_code'].nunique().reset_index()
duplicate_check[duplicate_check['country_code']>1]
| index | country_code | |
|---|---|---|
| 104 | 122130002101 | 2 |
| 111 | 123002022312 | 2 |
| 132 | 123020120032 | 2 |
pop_highfat_ucdp_acled_2000['geometry'] = pop_highfat_ucdp_acled_2000['index'].apply(lambda x: quadkey_to_bounds(x, as_polygon=True))
pop_highfat_ucdp_acled_2000 = gpd.GeoDataFrame(pop_highfat_ucdp_acled_2000, geometry='geometry', crs='EPSG:4326')

# Transform to World Mercator (EPSG:3395) for area calculations in meters
pop_highfat_ucdp_acled_2000_projected = pop_highfat_ucdp_acled_2000.to_crs(epsg=32636)

# Calculate area in square meters, then convert to square kilometers
area_sqm = pop_highfat_ucdp_acled_2000_projected['geometry'].iloc[4].area
area_sqkm = area_sqm / 1_000_000
print(f"Area: {area_sqm:,.2f} m² = {area_sqkm:.2f} km²")
Area: 68,348,937.89 m² = 68.35 km²
pop_highfat_ucdp_acled_2000[pop_highfat_ucdp_acled_2000['index']=='122130002101']
| Unnamed: 0 | index | population | country_code | geometry | |
|---|---|---|---|---|---|
| 11 | 11 | 122130002101 | 91270.828125 | PSE | POLYGON ((34.27734 31.27855, 34.27734 31.35364... |
| 118 | 118 | 122130002101 | 16030.285156 | EGY | POLYGON ((34.27734 31.27855, 34.27734 31.35364... |
============================================================
2000 Comparison:
  UCDP only: 118, ACLED only: 23, Both: 13
  Total unique grids: 154

2024 Comparison:
  UCDP only: 262, ACLED only: 253, Both: 237
  Total unique grids: 752
============================================================
Spatial Proximity of Grids from ACLED and UCDP#
Analyzing spatial proximity of UCDP and ACLED grids in 2024...
UCDP-only grids: 262
ACLED-only grids: 253
Overlapping grids (both): 237

Analyzing UCDP-only grids...
Analyzing ACLED-only grids...

======================================================================
SPATIAL PROXIMITY ANALYSIS - DISTANCE DISTRIBUTION (2024)
======================================================================

UCDP-only grids - Distance to nearest ACLED-only grid:
----------------------------------------------------------------------
  1 grid away (adjacent)   :   95 grids ( 36.3%)
  2 grids away             :   56 grids ( 21.4%)
  3 grids away             :   30 grids ( 11.5%)
  3+ grids away            :   81 grids ( 30.9%)

ACLED-only grids - Distance to nearest UCDP-only grid:
----------------------------------------------------------------------
  1 grid away (adjacent)   :   79 grids ( 31.2%)
  2 grids away             :   44 grids ( 17.4%)
  3 grids away             :   26 grids ( 10.3%)
  3+ grids away            :  104 grids ( 41.1%)

======================================================================
SUMMARY
======================================================================
UCDP-only grids within 2 tiles of ACLED: 151/262 (57.6%)
ACLED-only grids within 2 tiles of UCDP: 123/253 (48.6%)
Event similarity between ACLED and UCDP#

UCDP 2024: 4332 headlines
ACLED 2024: 10241 event notes
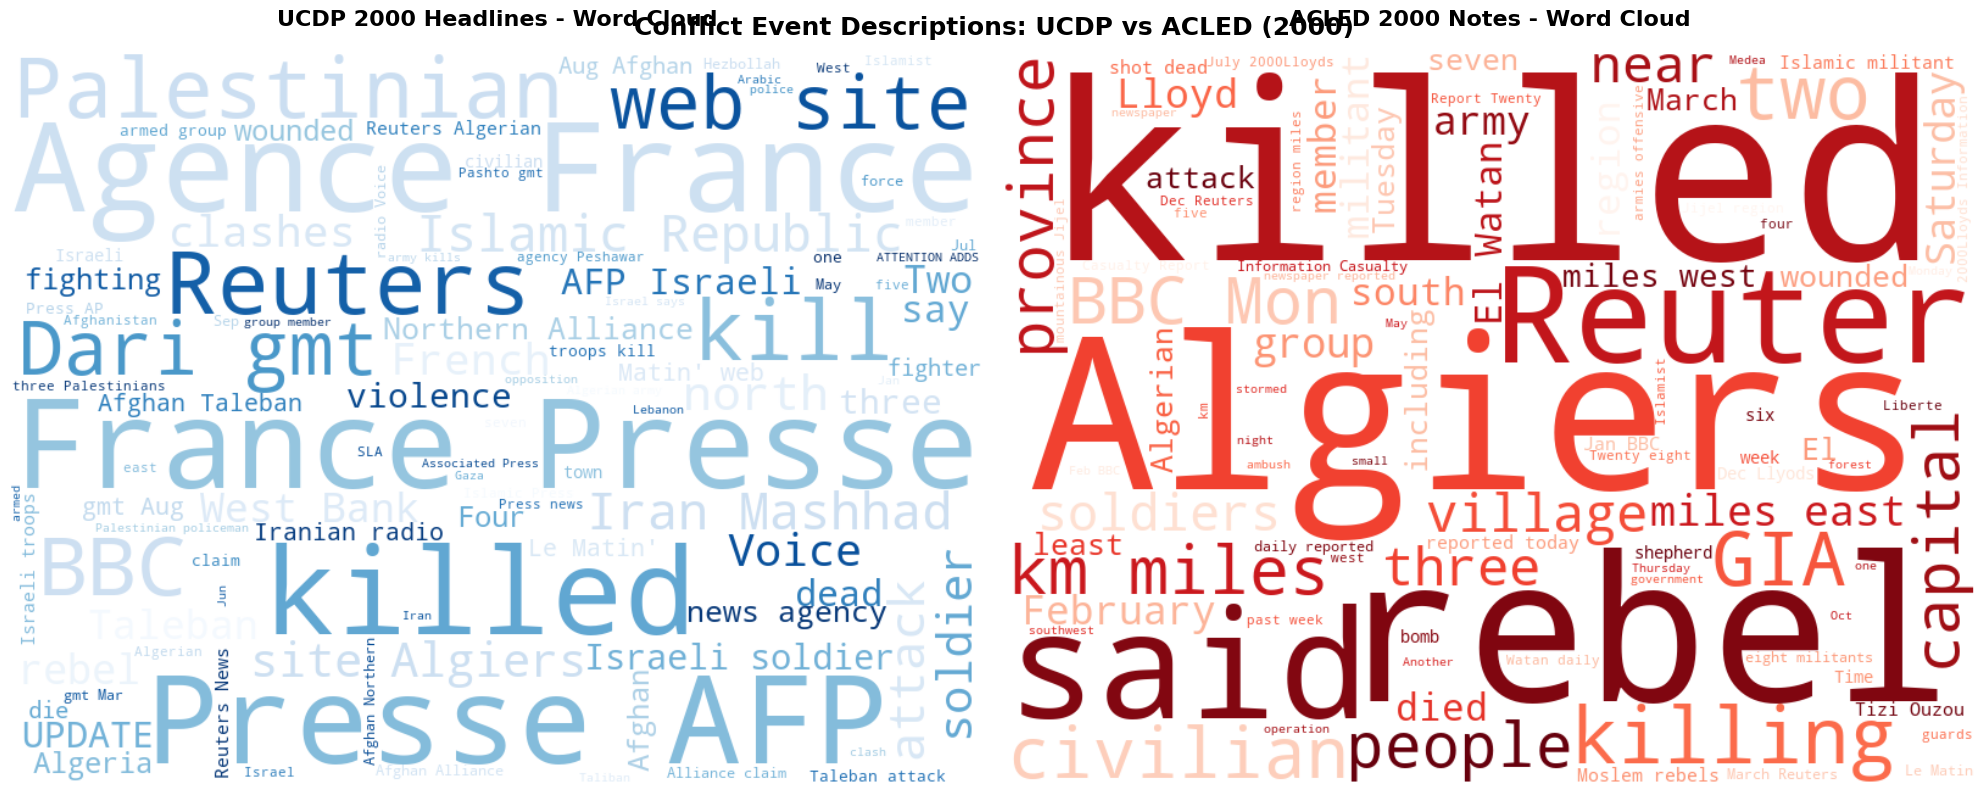
UCDP 2000: 218 headlines
ACLED 2000: 133 event notes