
Navigation#
The GeoE3 plugin interface is intuitive and easy to navigate. In this section, the streamlined workflow ensures an efficient transition from setup to core spatial analysis. For detailed instructions on each step, refer to the sections below.
Accessing the Plugin#
After installing the plugin, its interface should automatically appear:

Locate the Toolbar Icon
Find the plugin’s icon in the QGIS toolbar.
Open the Plugin Click on the plugin’s toolbar icon to open its main window.
Project Setup#
Once the plugin window is open, press the right arrow buttons highlighted in red to navigate through the pages:
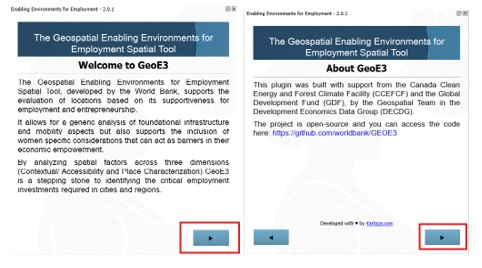
Welcome to GeoE3 Page: This is the introductory page of the plugin, providing an overview of its purpose and functionality. It serves as the starting point to familiarize users with the plugin’s capabilities and its relevance to geospatial analysis.
About Page: This page offers detailed information about the plugin, including its contributors, development background, and licensing. It highlights the open-source nature of the tool and acknowledges the organizations or individuals involved in its creation.
GeoE3 Project Selection#
In this step, you need to select a project folder to begin your work. The plugin provides you with two options:
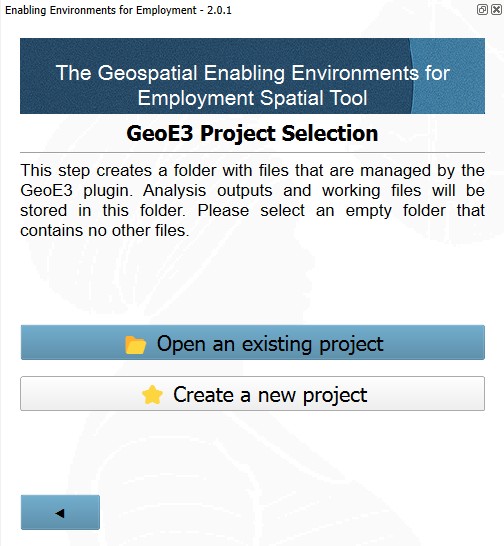
Option 1: Open an Existing Project: Select this option if you already have a project folder created previously. Choosing this will load the project along with all its associated files. Once loaded, press the right arrow button to proceed to the data input and processing interface for further analysis.
Option 2: Create a New Project: Choose this option to start a new project. The plugin will guide you through creating a new folder that will store the GeoE3 project files and working analysis results for spatial processing.
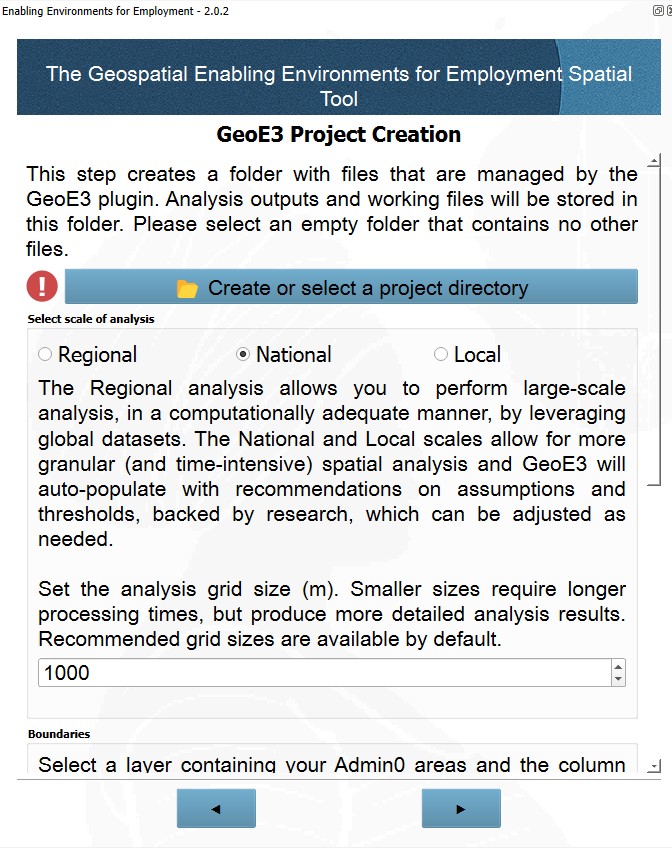
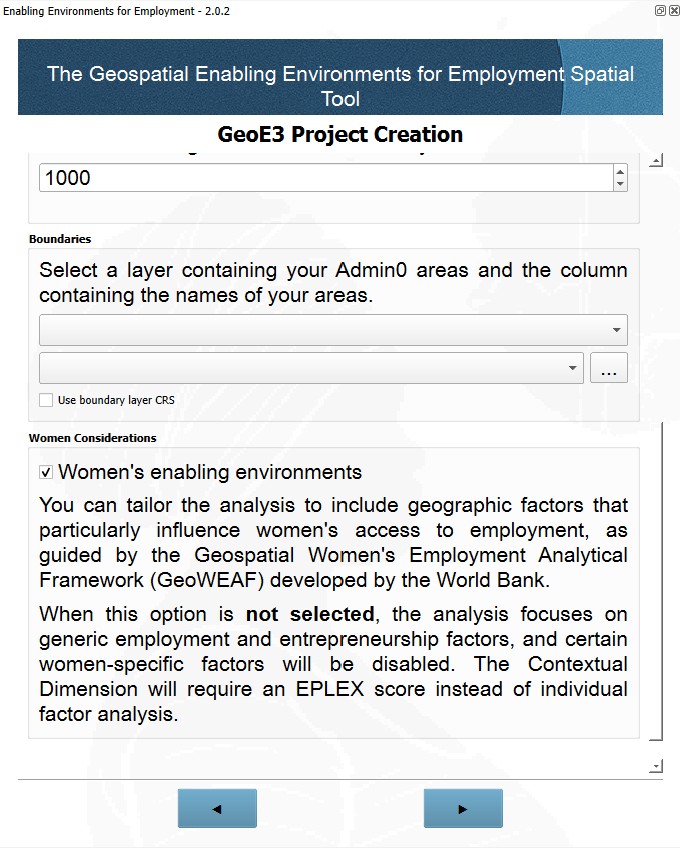
Important Considerations
⚠️ Warning: Ensure the folder is empty. Using a folder with other files may lead to errors or accidental overwrites.
💡 Tip: Use a descriptive name for the folder, incorporating details such as the name of the country or region you want to analyze and a timestamp. The timestamp could reflect either the time of the analysis process or the date of the input datasets. This will help you easily identify the folder for future reference and maintain better organization.
🔒 Reminder: Ensure the folder is stored in a location with adequate storage space for analysis outputs. The contents of the selected folder will be managed by the plugin, ensuring proper organization of project-related files.
Additional Steps After Creating the Folder#
Select a Layer:
Click on the three dots button to choose a layer containing your Admin0 areas (country or region boundaries). The input layer must be in either SHP or GPKG format. Once selected, use the dropdown menu to specify the column that contains the names of the areas. Ensure the column is correctly populated to avoid errors during analysis.
Set the Analysis Cell Size:
Enter a value between 100m and 1000m:
Smaller values (e.g., 100m) will provide more detailed results but require longer processing times.
Larger values (e.g., 1000m) will reduce processing time but result in coarser outputs.
Coordinate System Configuration:If your boundary layer uses a valid projected CRS (e.g., UTM or EPSG:3857), select the checkbox Use Coordinate System of your boundary layer. This ensures that spatial calculations, such as distances and areas, are accurate and aligned with your layer’s CRS.
⚠️ Note: This option is automatically disabled if the map units of your boundary layer are in degrees (e.g., EPSG:4326). Spatial analysis requires projected coordinate systems with units in meters for precision.
💡 Tip: If your data uses geographic coordinates (latitude/longitude in degrees), reproject it to a projected CRS before proceeding with the analysis.
Pre-Processing#
Locate the right arrow button at the bottom-right corner of the interface (highlighted in red in the image).
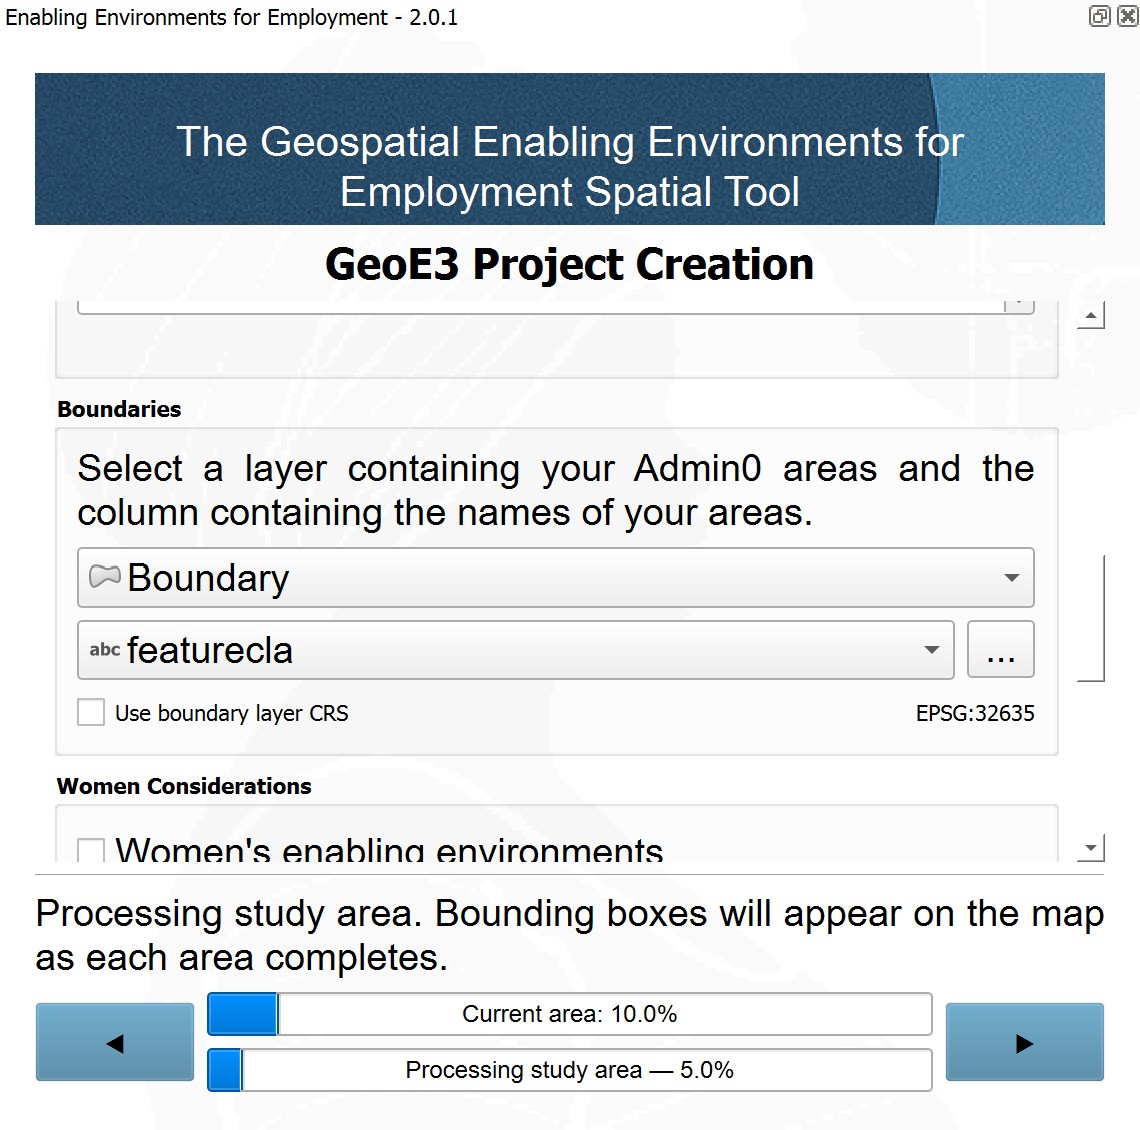
Clicking this button confirms all selected settings and initiates the first step of the processing workflow — splitting the study area into grids. After the area is successfully split into grids, the interface transitions to the Processing Data Interface, where you can initiate the main analysis.
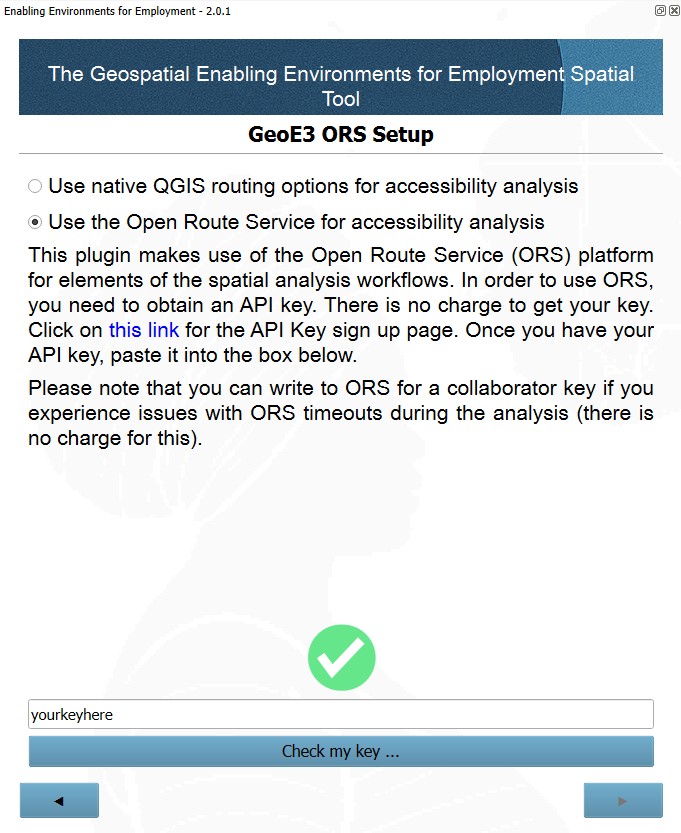
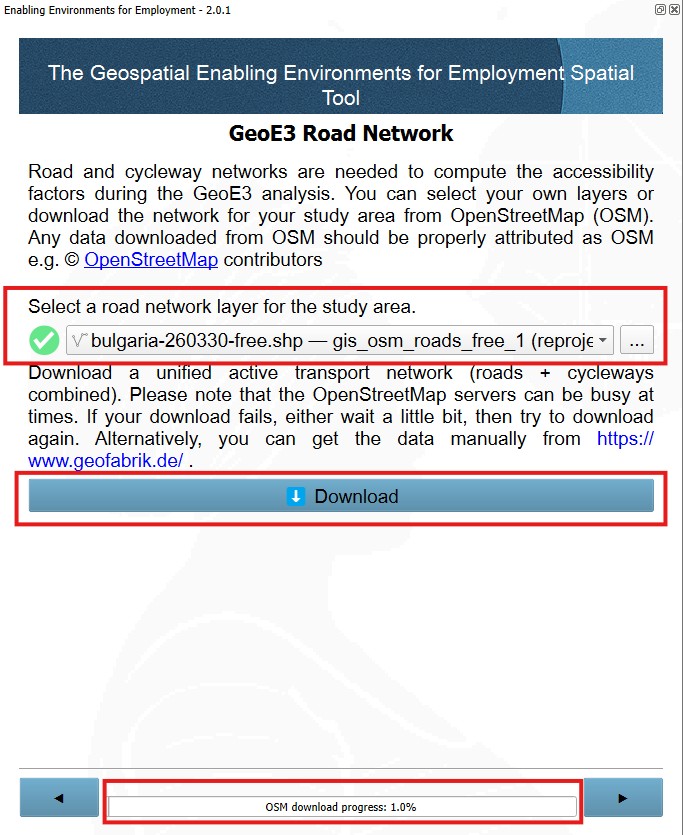
Download or select the road network: To conduct the analysis for the Accessibility dimension, a road network is required. The process uses geospatial area analysis based on road network data to evaluate accessibility. If you have a key to use the ORS service, you can input it here. Alternatively, you can provide this data in two ways: either upload an existing road network or download it directly from OpenStreetMap (OSM) by clicking the Download from Open Street Map button. Once the download is complete, proceed by clicking the arrow in the bottom-right corner to continue.
Processing Data Interface#
The data processing interface serves as the central hub for managing, configuring, and processing inputs across multiple dimensions and factors within the project. This interface is designed to streamline workflows and provide users with a clear overview of the processing status. Below is a guide to understanding the key components of this interface:
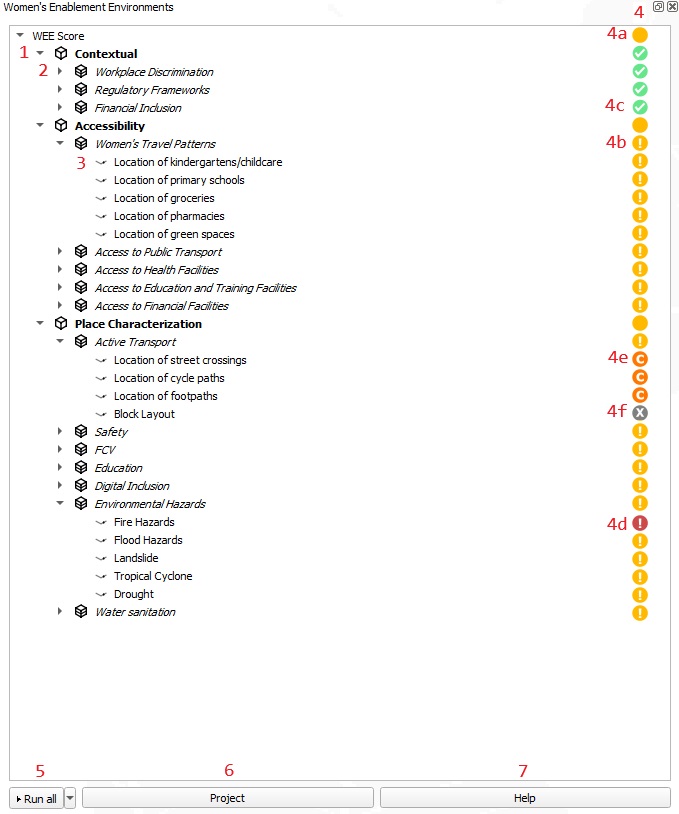
🖥️ Key Elements of the Interface
| 1. The Three Dimensions | The interface organizes the analysis into three primary dimensions: Contextual, Accessibility, and Place Characterization. |
| 2. Fifteen Factors | Each dimension consists of factors representing the main themes of analysis. |
| 3. Fourteen Subfactors | Certain factors include subfactors for additional granularity. |
| 4. Processing Status Widgets | - 4a Configured, not run: Inputs are set up but processing has not started. |
| - 4b Required and not configured: Essential inputs are missing and need configuration. | |
| - 4c Completed successfully: Processing finished without errors. | |
| - 4d Workflow failed: The process encountered an error and requires troubleshooting. | |
| - 4e Not configured (optional): Inputs are optional and not configured. | |
| - 4f Excluded from analysis: Intentionally excluded factors or subfactors. | |
| 5. Run All/Run Incomplete | - Run All: Executes all workflows, regardless of configuration or status. |
| - Run Incomplete: Focuses only on workflows that are incomplete. | |
| 6. Project Setup Pages | The Project button opens setup pages to configure the project folder and analysis parameters. |
| 7. Help | Clicking the Help button redirects to the tool’s GitHub page for detailed documentation and support resources. |
🗂️ Key Considerations
Consideration |
Details |
|---|---|
📁 Organize Your Folder |
Ensure your project folder is empty before starting to avoid accidental overwrites. |
🕒 Start with Large Cells |
Begin with larger cell sizes for initial testing and refine later for greater detail. |
🖥️ Monitor Progress |
Use status widgets to track progress and troubleshoot errors promptly. |
📖 Use Help Resources |
Refer to the Help section or GitHub documentation for additional support. |
By keeping these considerations in mind, you can ensure a smooth and efficient workflow while minimizing errors and maximizing the utility of the GeoE3 plugin.