Reproducibility package#
A replication package has been verified and published in the World Bank Reproducible Research Repository: Reproducibility package for Climate Risk Scorecard Vision Indicator 2021. The package includes all code and partial data to estimate the indicator. Code files are also available from the Github repository.
Data availability statements and instructions to replicate results are provided in the package README and duplicated below.
Overview#
This repository includes instructions and code to replicate estimates of the population at high risk from climate-related hazards using R and Stata. There are two types of data used: (1) data from household surveys and related national/subnational data, and (2) spatial data.
Data Availability#
Some data cannot be made publicly available.
Spatial data#
Access to some input spatial datasets is restricted and processing this data is very resource intensive (> 14 days, 1 TB storage recommended). Therefore, intermediate spatial data is provided for replication. Instructions to access input data files are provided below and all code used to process them is included in the package.
Location |
Provided |
Citation |
Accessed |
|
|---|---|---|---|---|
Fathom Global v2 |
|
FALSE |
Sampson et al. (2015) |
November 2023 |
Deltares Global Flood Map |
|
FALSE |
Deltares (2021) |
November 2023 |
FAO Historic Drought Frequency |
|
FALSE |
FAO (2023) |
August 2023 |
STORM tropical cyclone wind speed return periods |
|
FALSE |
Russell (2024) Bloemendaal et al (2023) |
April 2024 |
CCKP Environmental Stress Index (ESI) max 5-day heatwave |
|
FALSE |
World Bank, Climate Change Knowledge Platform (2024) |
April 2024 |
GHS-POP - R2023A |
|
FALSE |
Schiavina et al. (2023) |
August 2023 |
GHS-SMOD - R2023A |
|
FALSE |
Schiavina M., Melchiorri M., Pesaresi M. (2023) |
August 2023 |
SDSN RAI Inaccessibility Index |
|
FALSE |
Guilherme et al. (2024) |
June 2024 |
World Bank AM24 VUL boundaries |
|
TRUE |
World Bank (2024) |
July 2024 |
Intermediate data included in the replication package |
||||
Combined hazard and Degree of Urbanization |
|
TRUE |
||
RAI population |
|
TRUE |
A list of data files for each Data.Name is included in spatial_data_files.csv.
Fathom Global v2 flood hazard data was obtained from the World Bank Development Data Hub. The FATHOM Global Flood Hazard Data has been supplied to the World Bank under a perpetual license for internal use only. The data remains confidential to The World Bank and FATHOM Ltd. All terms of the General World Bank Data Policy for confidential data apply. The Data may not be resold or made publicly available. The Data may not be shared with subcontractors, external consultancies or any other firms or individuals beyond the World Bank without written specific agreement from FATHOM. FATHOM retains all Intellectual Property Rights in the Data. The full clause of caution that accompanies the Data and describes the limitations and uncertainties surrounding the Data must be read before using the Data.
Within the World Bank, the Fathom Global flood hazard dataset can be requested from https://datacatalog.worldbank.org/int/search/dataset/0021728/Global-Flood-Hazard–FATHOM- A URL provides users with access to an internal SharePoint folder containing 231 .zip files, one for each country or region (AD_andorra.zip; AE_UAE.zip; …). These contain .tif format files for different return periods and flood types. Data for all flood types, return periods and regions are required.
The data files (263 GB) should be saved here: 02.input/flood_fathom/
License: Custom license (see above).
Citation: Sampson et al. (2015)
Deltares Global Flood Map coastal flood hazard data was obtained from The Microsoft Planetary Computer Data Catalog. The data is produced by Deltares and hosted by Microsoft via Azure Blob Storage. The “MERITDEM”, “90m” resolution version of data for the current climate (2018 sea level) are required for return periods ranging between 5 and 100 years.
The direct download links are: https://deltaresfloodssa.blob.core.windows.net/floods/v2021.06/global/MERITDEM/90m/GFM_global_MERITDEM90m_2018slr_rp0005_masked.nc https://deltaresfloodssa.blob.core.windows.net/floods/v2021.06/global/MERITDEM/90m/GFM_global_MERITDEM90m_2018slr_rp0010_masked.nc https://deltaresfloodssa.blob.core.windows.net/floods/v2021.06/global/MERITDEM/90m/GFM_global_MERITDEM90m_2018slr_rp0025_masked.nc https://deltaresfloodssa.blob.core.windows.net/floods/v2021.06/global/MERITDEM/90m/GFM_global_MERITDEM90m_2018slr_rp0050_masked.nc https://deltaresfloodssa.blob.core.windows.net/floods/v2021.06/global/MERITDEM/90m/GFM_global_MERITDEM90m_2018slr_rp0100_masked.nc
The .nc format files (5.3 GB) should be saved here: 02.input/flood_deltares/
License: Community Data License Agreement - Permissive, Version 1.0 https://cdla.dev/permissive-1-0/
Citation: Deltares (2021)
FAO Historic Drought Frequency data was obtained from FAO Agricultural Stress Index System. The data files were downloaded via Google Earth Engine after requesting access by sending an email to giews1@fao.org, following the instructions here: https://www.fao.org/giews/earthobservation/access.jsp?lang=en The data is available with an open license allowing redistribution subject to specific terms (see below).
The cropland and pasture Historic Drought Frequency data files for season 1 and season 2, and both available thresholds (>30% land affected, >50% land affected) are required. At the time data was accessed, these covered 1984-2022.
The .tif format files (185 MB) should be saved here: 02.input/drought_fao/
License: Creative Commons Attribution-NonCommercial-ShareAlike 4.0 (CC BY-NC-SA 4.0) https://creativecommons.org/licenses/by-nc-sa/4.0/
Additional terms of use for datasets: https://www.fao.org/contact-us/terms/db-terms-of-use/en
Citation: FAO (2023)
STORM tropical cyclone wind speed return periods data was obtained from https://doi.org/10.5281/zenodo.10931452 (Version v2). The global GeoTIFFs for the present-day scenario were derived with minimal processing from the dataset created by Bloemendaal et al (2023), released with a CC0 license.
The STORM_FIXED_RETURN_PERIODS.zip (1.1 Gb) includes all data files. Only data files for the present day, baseline climate scenario are required for the analysis. These have the filename pattern: STORM_FIXED_RETURN_PERIODS_CONSTANT_{STORM_RP}_YR_RP.tif, where STORM_RP is ranges between 10 and 10000.
The .tif format files (228 MB) should be saved here: 02.input/cyclone_storm/
License: CC0 1.0 https://creativecommons.org/publicdomain/zero/1.0/
Citation: Russell (2024)
CCKP Environmental Stress Index (ESI) max 5-day heatwave data was obtained from the World Bank Climate Change Knowledge Portal (CCKP) team who produced the dataset for this project. The data are based on the ECMWF ERA5 reanalysis (Hersbach H. et al. 2017), which is distributed with an open license (CC BY 4.0). These ESI data files will be provided by the project team on request and are not available from the CCKP platform. The “median” version data files for return periods ranging between 5 and 100 years are required.
The .nc format files (5 MB) should be saved here: 02.input/heatwave_cckp/
License: Creative Commons Attribution 4.0 International License (CC BY 4.0) https://creativecommons.org/licenses/by/4.0/
Citation: World Bank, Climate Change Knowledge Platform (2024)
GHS-POP - R2023A gridded population data is obtained from the European Commission, Joint Research Centre (JRC) Global Human Settlement Layer (GHSL), available from: https://human-settlement.emergency.copernicus.eu/download.php?ds=pop. The “2020” epoch global data file with “3 arcsec” resolution (“WGS84” coordinate system) is required. This data is required for replication from the intermediate spatial data.
The .tif format data file (11 Gb) should be saved here: 02.input/population_ghsl/
License: The GHSL has been produced by the EC JRC as open and free data. Reuse is authorised, provided the source is acknowledged. For more information, please read the use conditions European Commission Reuse and Copyright Notice.
Citation: Schiavina et al. (2023)
GHS-SMOD - R2023A gridded degree of urbanization data is obtained from the European Commission, Joint Research Centre (JRC) Global Human Settlement Layer (GHSL), available from: https://human-settlement.emergency.copernicus.eu/download.php?ds=smod. The “2020” epoch global data files with “1 km” resolution (“Mollweide” coordinate system) is required.
The .tif format data file (18 Mb) should be saved here: 02.input/degurban_ghsl/
License: The GHSL has been produced by the EC JRC as open and free data. Reuse is authorised, provided the source is acknowledged. For more information, please read the use conditions European Commission Reuse and Copyright Notice.
Citation: Schiavina M., Melchiorri M., Pesaresi M. (2023)
SDSN RAI Inaccessibility Index data is obtained from the UN Sustainable Development Solutions Network (SDSN). The dataset is produced as part of tracking SDG Indicator 9.1.1 Rural Access Index by the UN SDSN and provided directly to the project team. The data can be accessed through Google Earth Engine using the code and instructions at https://gee-community-catalog.org/projects/rai/, and is hosted by the awesome-gee-community-catalog.
The .tif format file (5.8 GB) should be saved here: 02.input/rai_sdsn/
License: Creative Commons Attribution Noncommercial Share Alike License (CC BY-NC-SA-4.0)
Citation: Guilherme et al. (2024); Roy et al. (2024)
World Bank AM24 VUL boundaries data were produced by the project team. The dataset is derived from administrative boundary data sources including Global Administrative Unit Layers (GAUL) 2015, Nomenclature of Territorial Units for Statistics (NUTS), GADM, United Nations Common Operational Datasets, and National Statistical Offices (NSOs). The boundary data is required for replication from the intermediate spatial data.
The replication package includes the .gpkg format file (110 MB) here: 02.input/boundaries/
License: Creative Commons Attribution 4.0 International License (CC BY 4.0) https://creativecommons.org/licenses/by/4.0/
Citation: World Bank (2024)
Intermediate spatial data
Combined hazard and Degree of Urbanization intermediate data is included for replication. It is derived from the input datasets using code included in the replication package. The data includes one .tif format file (1.4 GB) and auxiliary .csv files here: 03.intermediate/Hazard/
RAI population is provided as intermediate data for replication. It is derived from the input datasets using code included in the replication package. The .tif format data file (1.9 GB) is located here: 03.intermediate/RAI/
Household survey and other data#
Location |
Provided |
Citation |
Accessed |
|
|---|---|---|---|---|
Joint Monitoring Programme (JMP) |
|
TRUE |
JMP |
April 2024 |
Global Electricity Database |
|
TRUE |
GED |
March 2024 |
UNESCO |
|
TRUE |
UNESCO |
April 2024 |
Findex |
|
TRUE |
Findex |
March 2024 |
WDI |
|
TRUE |
WDI |
March 2024 |
Global Monitoring Database (GMD) |
FALSE |
World Bank, GMD (2024) |
June 2024 |
|
Luxembourg Income Study Database (LIS) |
FALSE |
LIS |
June 2024 |
|
Intermediate data included in the replication package |
||||
Poverty and Inequality Platform |
|
TRUE |
World Bank (2024), Poverty and Inequality Platform |
September 2024 |
Joint Monitoring Programme (JMP) data on access to drinking water was obtained from the WHO/UNICEF Joint Monitoring Programme for Water Supply, Sanitation and Hygiene (JMP), available from: https://washdata.org/data/downloads#WLD. R scripts included in 02.input/jmp/code/ were used to download and combine data for all countries from the “country file” and “inequality” excel files available from the website. The combined formatted .xlsx data file is included in the replication package here: 02.input/jmp/data/
License: Creative Commons Attribution 4.0 International License (CC BY 4.0) https://creativecommons.org/licenses/by/4.0/
Citation: WHO/UNICEF Joint Monitoring Programme (2024)
Global Electricity Database data on electricity access was obtained from the IEA, IRENA, UNSD, World Bank and WHO 2023 Tracking SDG 7: The Energy Progress Report. The data are available from: https://trackingsdg7.esmap.org/downloads. The SDG7.1.1 - Access to Electricity.xlsx file was downloaded and is included in the replication package here: 02.input/GED/
License: Creative Commons Attribution 4.0 International License (CC BY 4.0) https://creativecommons.org/licenses/by/4.0/
Citation: IEA, IRENA, UNSD, World Bank, WHO (2023).
UNESCO data on education completion was obtained from the UNESCO Institute for Statistics (UIS), available from the UIS.Stat Bulk Data Download Service: https://apiportal.uis.unesco.org/bdds.
License: Attribution-Sharealike 3.0 Intergovernmental Organization (CC BY-SA 3.0 IGO) https://creativecommons.org/licenses/by-sa/3.0/igo/
Citation: UNESCO Institute for Statistics (UIS) (2024).
Findex data on financial inclusion was obtained from the World Bank Microdata Library. Registered uses can download the 2021 data file (in .dta format) from https://microdata.worldbank.org/index.php/catalog/4607. Before gaining access, users are asked to register and to read and agree to Public Use Files conditions (see below). The data file is included in the replication package here: 02.input/Findex/
License: Public Use Files, see: https://microdata.worldbank.org/index.php/terms-of-use
Citation: Demirgüç-Kunt et al. (2022); Development Research Group, Finance and Private Sector Development Unit (2022).
WDI World Development Indicators (WDI) data was obtained from the World Bank, available using the API through the Stata package wbopendata and R package wbstats. Data for the following variables are called from the code: EG.ELC.ACCS.ZS, SP.POP.TOTL.
License: Creative Commons Attribution 4.0 International License (CC BY 4.0) https://creativecommons.org/licenses/by/4.0/
Citation: World Bank (2024).
Global Monitoring Database (GMD) data is obtained from the World Bank Datalibweb platform using the Stata package datalibweb. Access to the Survey data in the Global Monitoring Database (GMD) is provided only for World Bank staff working with Bank managed computers, and the data is not available for external users. Most of the surveys in the GMD is available internally, however for some data users need to request access to the data in the Datalibweb platform. Users need to install the datalibweb ado package following the instructions in the About tab of the Datalibweb website.
License: Restricted access, exact license varies across surveys.
Citation: World Bank (2024).
Additional GMD Datasets:
Survey_price_framework.dta
Source: Datalibweb, World Bank Access Code: dlw, country(support) year(2005) type(gmdraw) filename(Survey_price_framework.dta) files surveyid(Support_2005_CPI_v11_M) Location: After running the code, add the dataset to 02.input/Survey_price_framework.dta.
Final_CPI_PPP_to_be_used.dta
Source: Datalibweb, World Bank Access Code: dlw, country(support) year(2005) type(gmdraw) filename(Final_CPI_PPP_to_be_used.dta) files surveyid(Support_2005_CPI_v11_M) Location: After running the code, add the dataset to 02.input/Final_CPI_PPP_to_be_used.dta.
repo_AM24all.dta
Source: Datalibweb, World Bank Access Code: dlw, country(support) year(2005) type(gmdraw) filename(repo_AM24all.dta) files surveyid(Support_2005_CPI_v11_M) Location: After running the code, add the dataset to 02.input/repo_AM24all.dta.
Luxembourg Income Study Database (LIS) data was obtained using the remote-execution system LISSY. More details can be found at https://www.lisdatacenter.org/data-access/lissy/.
License: There are restrictions on data use and access. Users must agree to the LIS Microdata User Agreement.
Citation: Luxembourg Income Study (2024).
Poverty and Inequality Platform data was obtained from the World Bank Poverty and Inequality Platform (PIP) using the Stata package pip to access the API. Documentation for the package is available here: https://worldbank.github.io/pip/.
License: Creative Commons Attribution 4.0 International License (CC BY 4.0) https://creativecommons.org/licenses/by/4.0/
Citation: World Bank (2024).
Instructions for Replicators#
Replication from intermediate spatial data#
Follow these steps to reproduce results from the intermediate spatial data:
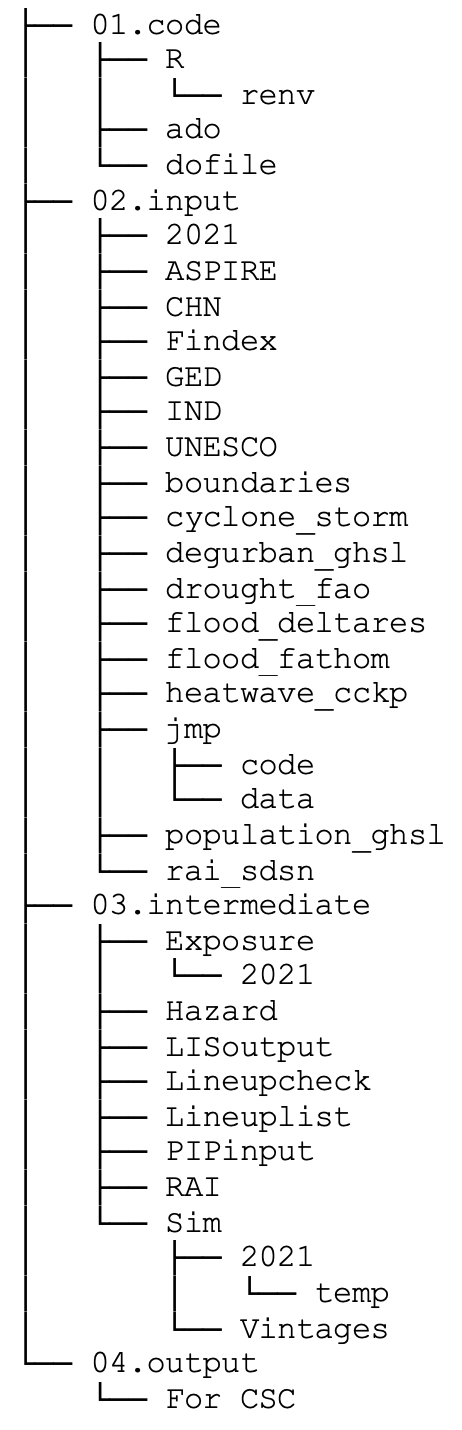
Clone the reproducibility package (see folder structure below)
Run the R master script
01.code/R/00_MASTER.ROpen the Stata master do-file
01.code/dofile/MASTER dofile.doChange the current directory on line 4 to the reproducibility package path
Run the Stata do-files following the sequence in the Excel sheet “Stata code” in the Excel file
Read me - folder and file structure.xlsx.
Replication from source data#
Note, the size of all input spatial data files exceeds 400 GB. It is recommended that 1TB of storage is available for intermediate and temporary data files generated when processing these input files. The total run time is likely to exceed 14 days but will depend on system specifications. To prepare the intermediate spatial data from source data files and run the analysis, do the following instead of step 1 above:
Access and download all datasets described in the Data Availability “Spatial data” section that are not included in the reproducibility package. Data files should be placed in the specified folders.
Run the R script
01.code/R/00_MASTER.Rafter changing line 13from_intermediate = TRUEtofrom_intermediate = FALSE.
List of Exhibits#
The provided code reproduces:
Exhibit name |
Output filename |
Script |
Note |
|---|---|---|---|
Climate risk scorecard vision indicator |
|
|
Found in: |
Requirements#
Computational requirements#
The R master script (from intermediate spatial data) was run on a MacBook Air M2 (2022) with 16 GB Memory, running macOS Sonoma 14.5. The run time was 116 minutes.
Software requirements#
Stata version 16 Datalibweb package version 2 (July 2024), see the “About” tab for more instructions of Datalibweb, installation of Stata package, it is available at https://datalibweb2.worldbank.org/home
R version 4.4.1 (2024-06-14) RStudio Version 2024.04.2+764 Platform: aarch64-apple-darwin20 Running under: macOS Sonoma 14.5
The R package renv is used to help create a reproducible environment by installing the same version of all packages required.
Memory, Runtime and Storage Requirements#
From intermediate spatial data: Memory: at least 16 GB Storage: at least 20 GB available Run time: 116 minutes (R master script) + 10 hours (Stata do-files)
For replication from input spatial data files, the following are recommended: Memory: at least 32 GB Storage: ~ 1 TB available Run time: > 14 days
Code Description#
R#
R Script |
Description |
|
|---|---|---|
|
Install packages using renv and run scripts to replicate |
|
|
Prepare Fathom flood data |
|
|
Prepare Deltares flood data |
|
|
Combine flood hazard data |
|
|
Prepare cyclone, drought and heatwave hazard data |
|
|
Prepare Degree of Urbanization data |
|
|
Prepare accessibility/Rural Access Index (RAI) data |
|
|
Define thresholds and produce categorical hazard data |
|
|
Combine hazard data for scenarios defined by return periods and exposure thresholds for each hazard type |
|
|
Combine hazard data and Degree of Urbanization data to produce categorical raster |
|
|
Get estimates of exposed population, population with low accessibility and total population in each region |
|
|
Rescale population estimates to match WDI at country level and save clean exposure data (.csv) for Stata |
Stata#
Seq. |
Dofile |
Description |
|---|---|---|
|
Sets globals |
|
1 |
|
Check the variable contents of all GMD data files |
2 |
|
Get poverty lineup estimates at the national level from PIP |
3 |
|
Update population, income class from PIP |
4 |
|
Prepare Findex data overall and for a lineup year 2021 |
5 |
|
Prepare ASPIRE data overall and for a lineup year |
6 |
|
Prepare JMP data overall and for a lineup year |
7 |
|
Prepare GED data overall and for a lineup year |
8 |
|
Prepare UNESCO data overall and for a lineup year |
9 |
|
Prepare water and electricity from WDI |
10 |
|
Prepare data list for all years with all inputs |
11 |
|
Check coverage |
12 |
|
Get a list for LIS |
13 |
|
Get a list for GMD |
15 |
|
Estimate national vulnerable from LISSY |
16 |
|
Estimate subnational vulnerable from LISSY |
17 |
|
Extract national vulnerable from LIS output text file |
18 |
|
Extract subnational vulnerable from LIS output text file |
19 |
|
Estimate subnational vulnerable for CHN 2021 |
20 |
|
Estimate subnational vulnerable for GMD surveys |
21 |
|
Estimate subnational vulnerable for IND 2021 |
22 |
|
Combine vulnerable estimates from GMD, LIS, special cases |
23 |
|
Merge exposure and vulnerable |
24 |
|
Prepare tables and figures |
25 |
|
Prepare Scorecard table |
Folder structure#
References#
Bloemendaal, Nadia; de Moel, H. (Hans); Muis, S; Haigh, I.D. (Ivan); Aerts, J.C.J.H. (Jeroen) (2023): STORM tropical cyclone wind speed return periods. Version 4. 4TU.ResearchData. Dataset. https://doi.org/10.4121/12705164.v4
Deltares. (2021). Planetary computer and Deltares global data: Flood Hazard Maps. Deltares. https://ai4edatasetspublicassets.blob.core.windows.net/assets/aod_docs/11206409-003-ZWS-0003_v0.1-Planetary-Computer-Deltares-global-flood-docs.pdf
Demirgüç-Kunt, Asli, Leora Klapper, Dorothe Singer, Saniya Ansar. 2022. The Global Findex Database 2021: Financial Inclusion, Digital Payments, and Resilience in the Age of COVID-19. Washington, DC: World Bank.
Development Research Group, Finance and Private Sector Development Unit. (2022). Global Financial Inclusion (Global Findex) Database 2021 [Dataset]. World Bank, Development Data Group. https://doi.org/10.48529/JQ97-AJ70 Accessed: March 2024.
FAO. (2023). FAO - Agricultural Stress Index System (ASIS). https://www.fao.org/giews/earthobservation/
Hersbach, H., Bell, B., Berrisford, P., Hirahara, S., Horányi, A., Muñoz‐Sabater, J., Nicolas, J., Peubey, C., Radu, R., Schepers, D. and Simmons, A., 2020. The ERA5 global reanalysis. Quarterly Journal of the Royal Meteorological Society, 146(730), pp.1999-2049.
Iablonovski, G., Drumm, E., Fuller, G., & Lafortune, G. (2024). A global implementation of the rural access index. Frontiers in Remote Sensing, 5, 1375476.
IEA, IRENA, UNSD, World Bank, WHO. 2023. Tracking SDG 7: The Energy Progress Report. World Bank, Washington DC.
Luxembourg Income Study (LIS) Database. 2024. http://www.lisdatacenter.org (multiple countries). Luxembourg: LIS.
Roy, Samapriya, Emily (Miller) Dorne, Somasundaram, D., Swetnam, T., & Saah, A. (2024). samapriya/awesome-gee-community-datasets: Community Catalog (2.9.0). Zenodo. https://doi.org/10.5281/zenodo.13733838
Russell, T. (2024). STORM tropical cyclone wind speed return periods as global GeoTIFFs [Data set]. Zenodo. https://doi.org/10.5281/zenodo.10931452
Sampson, C. C., Smith, A. M., Bates, P. D., Neal, J. C., Alfieri, L., & Freer, J. E. (2015). Fathom 90m global flood hazard data. (https://doi.org/10.1002/2015WR016954). www.fathom.global.
Schiavina, Marcello; Freire, Sergio; Alessandra Carioli; MacManus, Kytt (2023): GHS-POP R2023A - GHS population grid multitemporal (1975-2030). European Commission, Joint Research Centre (JRC) [Dataset] doi: 10.2905/2FF68A52-5B5B-4A22-8F40-C41DA8332CFE PID: http://data.europa.eu/89h/2ff68a52-5b5b-4a22-8f40-c41da8332cfe
Schiavina, Marcello; Melchiorri, Michele; Pesaresi, Martino (2023): GHS-SMOD R2023A - GHS settlement layers, application of the Degree of Urbanisation methodology (stage I) to GHS-POP R2023A and GHS-BUILT-S R2023A, multitemporal (1975-2030). European Commission, Joint Research Centre (JRC) [Dataset] doi: 10.2905/A0DF7A6F-49DE-46EA-9BDE-563437A6E2BA PID: http://data.europa.eu/89h/a0df7a6f-49de-46ea-9bde-563437a6e2ba
UNESCO Institute for Statistics (UIS) (2024). [Dataset]. https://uis.unesco.org/bdds Accessed: April 2024.
World Bank (2024). World Development Indicators: Access to electricity (% of population). [Dataset]. http://data.worldbank.org/indicator/EG.ELC.ACCS.ZS
World Bank, Climate Change Knowledge Portal (2024). Environmental Stress Index. URL: https://climateknowledgeportal.worldbank.org/
World Bank, World Development Indicators. (2024). “Population, total”. [Dataset]. http://data.worldbank.org/indicator/SP.POP.TOTL
World Bank. (2024). Global Monitoring Database [Dataset]. World Bank.
World Bank. (2024). Poverty and Inequality Platform (version 20240326_2017_01_02_PROD) [Dataset]. World Bank Group. www.pip.worldbank.org.