![]()
REaLTabFormer#
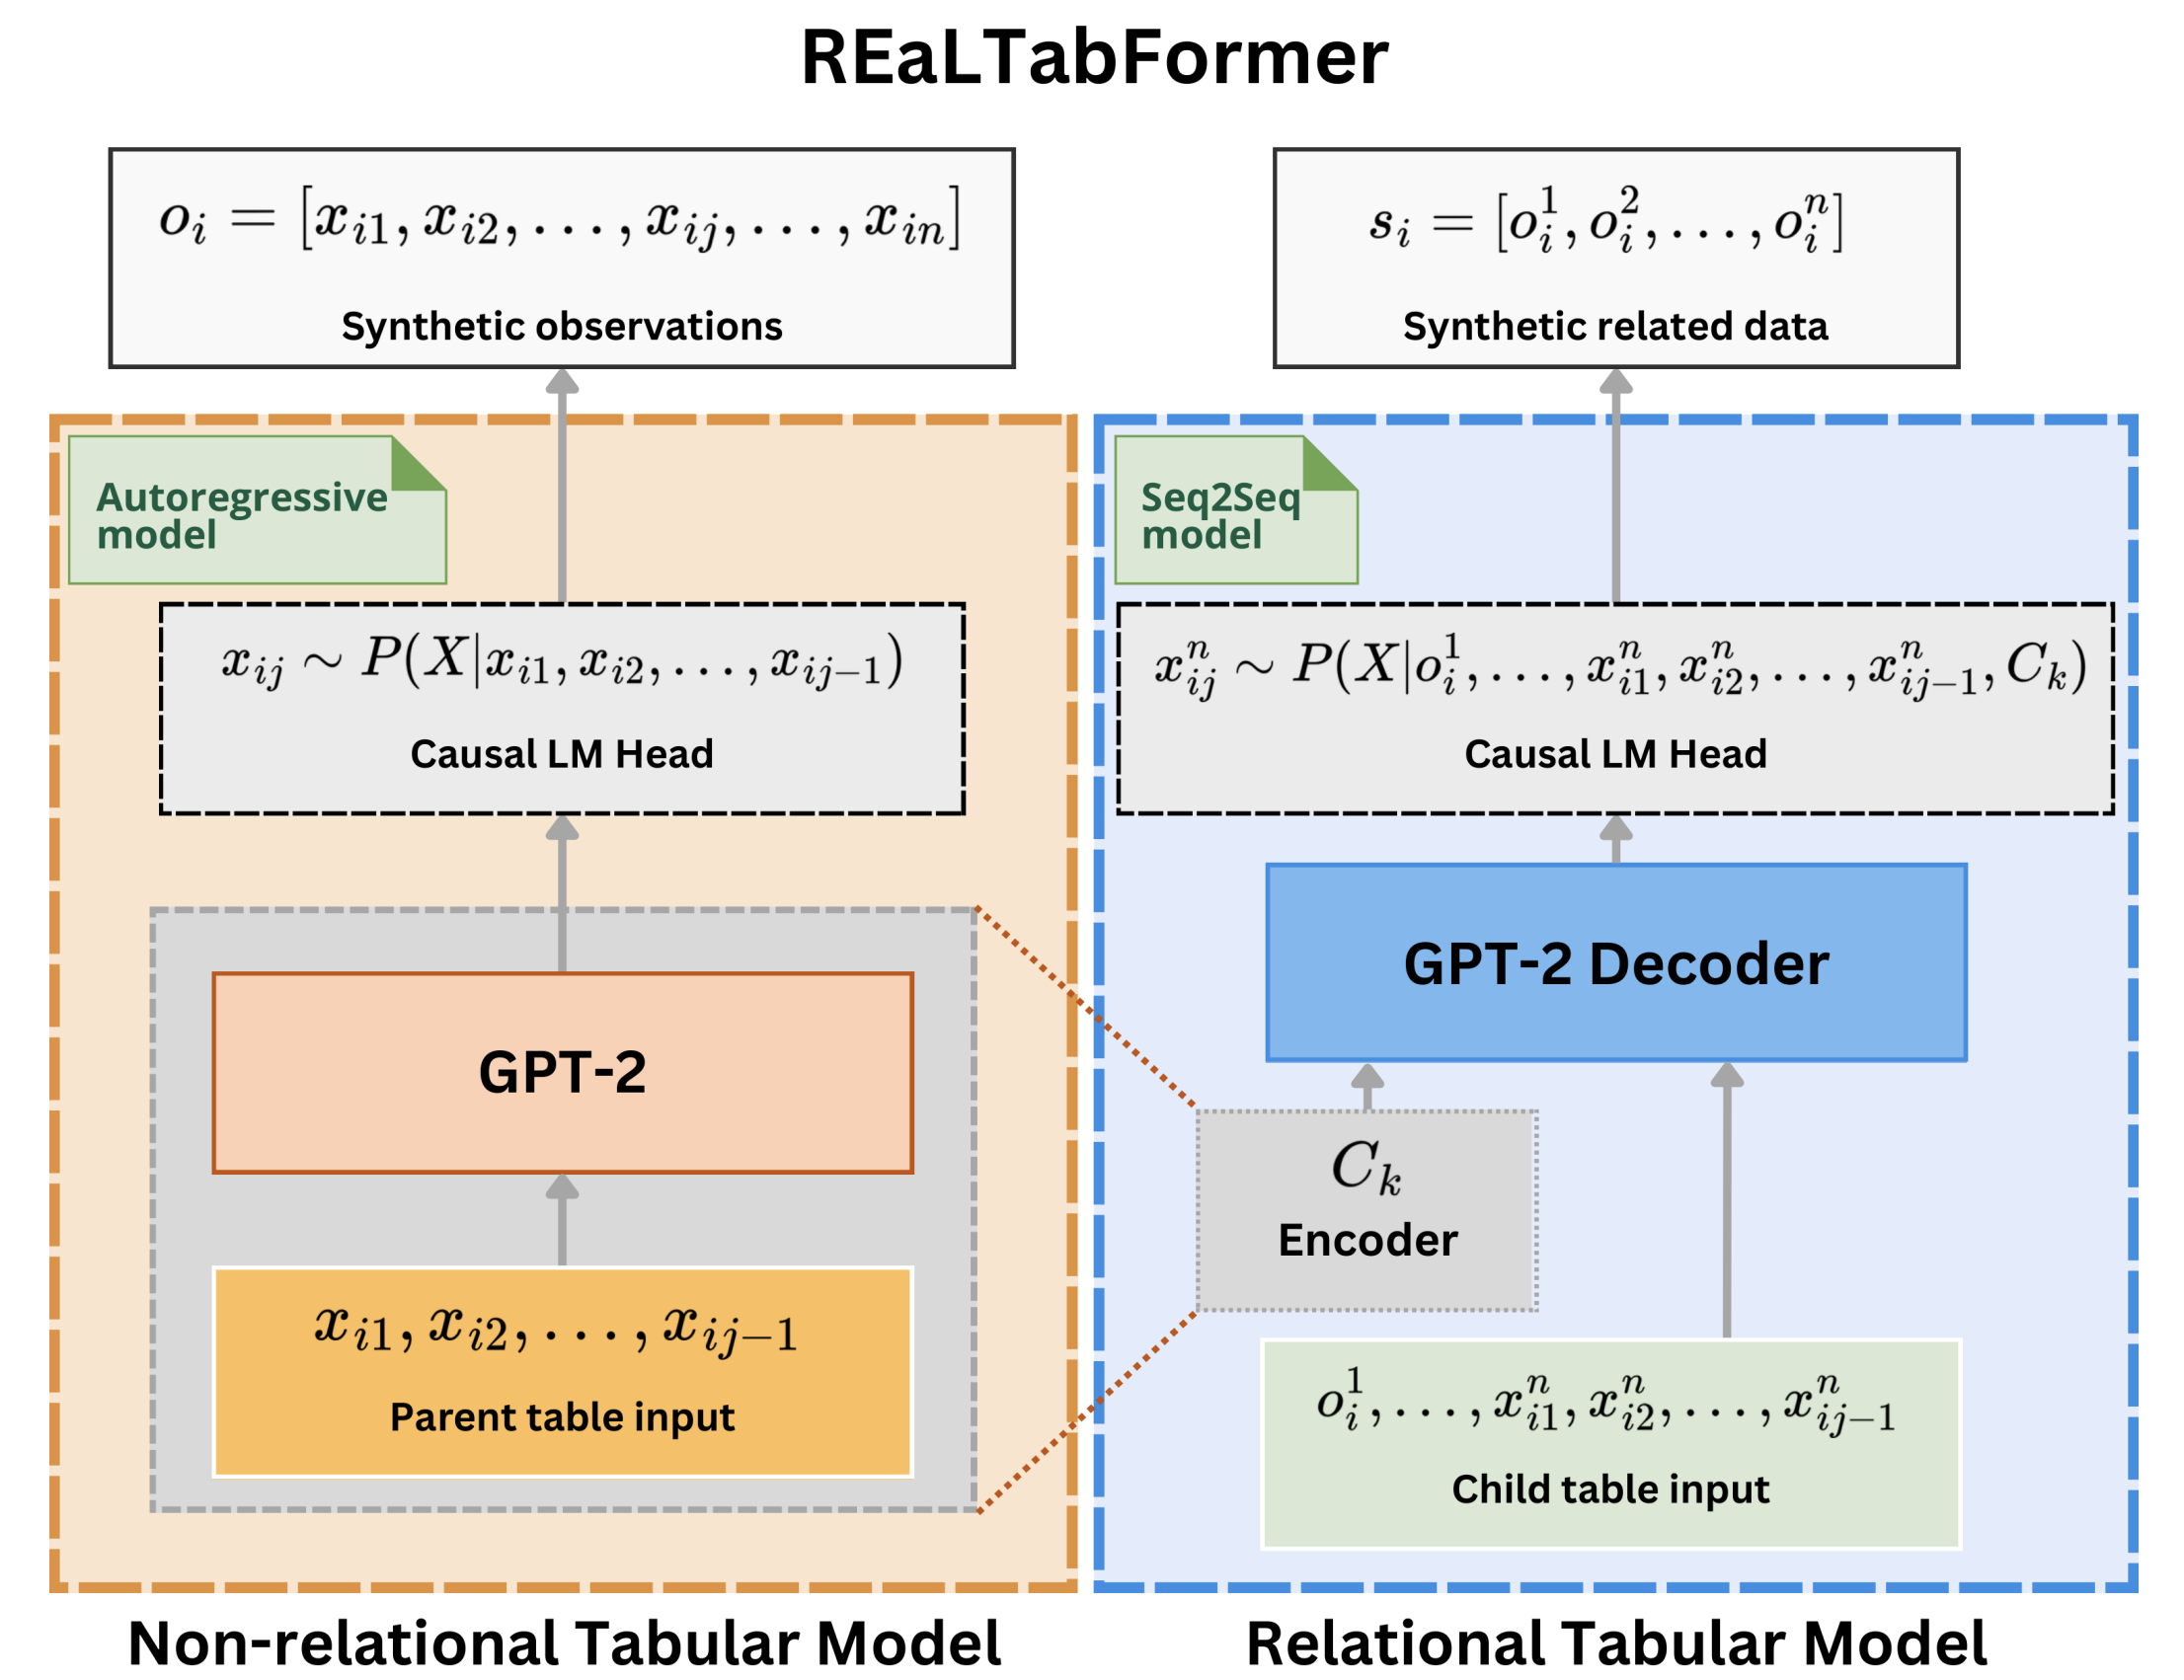
The REaLTabFormer (Realistic Relational and Tabular Data using Transformers) offers a unified framework for synthesizing tabular data of different types. A sequence-to-sequence (Seq2Seq) model is used for generating synthetic relational datasets. The REaLTabFormer model for a non-relational tabular data uses GPT-2, and can be used out-of-the-box to model any tabular data with independent observations.

REaLTabFormer: Generating Realistic Relational and Tabular Data using Transformers
Paper on ArXiv
Installation#
REaLTabFormer is available on PyPi and can be easily installed with pip (Python version >= 3.7):
pip install realtabformer
Usage#
We show examples of using the REaLTabFormer for modeling and generating synthetic data from a trained model.
REaLTabFormer for regular tabular data#
# pip install realtabformer
import pandas as pd
from realtabformer import REaLTabFormer

df = pd.read_csv("foo.csv")

# NOTE: Remove any unique identifiers in the
# data that you don't want to be modeled.

# Non-relational or parent table.
rtf_model = REaLTabFormer(
    model_type="tabular",
    gradient_accumulation_steps=4,
    logging_steps=100)

# Fit the model on the dataset.
# Additional parameters can be
# passed to the `.fit` method.
rtf_model.fit(df)

# Save the model to the current directory.
# A new directory `rtf_model/` will be created.
# In it, a directory with the model's
# experiment id `idXXXX` will also be created
# where the artefacts of the model will be stored.
rtf_model.save("rtf_model/")

# Generate synthetic data with the same
# number of observations as the real dataset.
samples = rtf_model.sample(n_samples=len(df))

# Load the saved model. The directory to the
# experiment must be provided.
rtf_model2 = REaLTabFormer.load_from_dir(
    path="rtf_model/idXXXX")
REaLTabFormer for relational data#
# pip install realtabformer
import os
import pandas as pd
from pathlib import Path
from realtabformer import REaLTabFormer

parent_df = pd.read_csv("foo.csv")
child_df = pd.read_csv("bar.csv")
join_on = "unique_id"

# Make sure that the key columns in both the
# parent and the child table have the same name.
assert ((join_on in parent_df.columns) and
        (join_on in child_df.columns))

# Non-relational or parent table. Don't include the
# unique_id field.
parent_model = REaLTabFormer(model_type="tabular")
parent_model.fit(parent_df.drop(join_on, axis=1))

pdir = Path("rtf_parent/")
parent_model.save(pdir)

# # Get the most recently saved parent model,
# # or a specify some other saved model.
# parent_model_path = pdir / "idXXX"
parent_model_path = sorted([
    p for p in pdir.glob("id*") if p.is_dir()],
    key=os.path.getmtime)[-1]

child_model = REaLTabFormer(
    model_type="relational",
    parent_realtabformer_path=parent_model_path,
    output_max_length=None,
    train_size=0.8)

child_model.fit(
    df=child_df,
    in_df=parent_df,
    join_on=join_on)

# Generate parent samples.
parent_samples = parent_model.sample(len(parend_df))

# Create the unique ids based on the index.
parent_samples.index.name = join_on
parent_samples = parent_samples.reset_index()

# Generate the relational observations.
child_samples = child_model.sample(
    input_unique_ids=parent_samples[join_on],
    input_df=parent_samples.drop(join_on, axis=1),
    gen_batch=64)
Validators for synthetic samples#
The REaLTabFormer framework provides an interface to easily build observation validators for filtering invalid synthetic samples. We show an example of using the GeoValidator below. The chart on the left shows the distribution of the generated latitude and longitude without validation. The chart on the right shows the synthetic samples with observations that have been validated using the GeoValidator with the California boundary. Still, even when we did not optimally train the model for generating this, the invalid samples (falling outside of the boundary) are scarce from the generated data with no validator.


# !pip install geopandas &> /dev/null
# !pip install realtabformer &> /dev/null
# !git clone https://github.com/joncutrer/geopandas-tutorial.git &> /dev/null
import geopandas
import seaborn as sns
import matplotlib.pyplot as plt
from realtabformer import REaLTabFormer
from realtabformer import rtf_validators as rtf_val
from shapely.geometry import Polygon, LineString, Point, MultiPolygon
from sklearn.datasets import fetch_california_housing


def plot_sf(data, samples, title=None):
    xlims = (-126, -113.5)
    ylims = (31, 43)
    bins = (50, 50)

    dd = samples.copy()
    pp = dd.loc[
        dd["Longitude"].between(data["Longitude"].min(), data["Longitude"].max()) &
        dd["Latitude"].between(data["Latitude"].min(), data["Latitude"].max())
    ]

    g = sns.JointGrid(data=pp, x="Longitude", y="Latitude", marginal_ticks=True)
    g.plot_joint(
        sns.histplot,
        bins=bins,
    )

    states[states['NAME'] == 'California'].boundary.plot(ax=g.ax_joint)
    g.ax_joint.set_xlim(*xlims)
    g.ax_joint.set_ylim(*ylims)

    g.plot_marginals(sns.histplot, element="step", color="#03012d")

    if title:
        g.ax_joint.set_title(title)

    plt.tight_layout()

# Get geographic files
states = geopandas.read_file('geopandas-tutorial/data/usa-states-census-2014.shp')
states = states.to_crs("EPSG:4326")  # GPS Projection

# Get the California housing dataset
data = fetch_california_housing(as_frame=True).frame

# We create a model with small epochs for the demo, default is 200.
rtf_model = REaLTabFormer(
    model_type="tabular",
    batch_size=64,
    epochs=10,
    gradient_accumulation_steps=4,
    logging_steps=100)

# Fit the specified model. We also reduce the num_bootstrap, default is 500.
rtf_model.fit(data, num_bootstrap=10)

# Save the trained model
rtf_model.save("rtf_model/")

# Sample raw data without validator
samples_raw = rtf_model.sample(n_samples=10240, gen_batch=512)

# Sample data with the geographic validator
obs_validator = rtf_val.ObservationValidator()
obs_validator.add_validator(
    "geo_validator",
    rtf_val.GeoValidator(
        MultiPolygon(states[states['NAME'] == 'California'].geometry[0])),
    ("Longitude", "Latitude")
)

samples_validated = rtf_model.sample(
    n_samples=10240, gen_batch=512,
    validator=obs_validator,
)

# Visualize the samples
plot_sf(data, samples_raw, title="Raw samples")
plot_sf(data, samples_validated, title="Validated samples")
Citation#
Please cite our work if you use the REaLTabFormer in your projects or research.
@article{solatorio2023realtabformer,
  title={REaLTabFormer: Generating Realistic Relational and Tabular Data using Transformers},
  author={Solatorio, Aivin V. and Dupriez, Olivier},
  journal={arXiv preprint arXiv:2302.02041},
  year={2023}
}
Acknowledgments#
We thank the World Bank-UNHCR Joint Data Center on Forced Displacement (JDC) for funding the project “Enhancing Responsible Microdata Access to Improve Policy and Response in Forced Displacement Situations” (KP-P174174-GINP-TF0B5124). A part of the fund went into supporting the development of the REaLTabFormer framework which was used to generate the synthetic population for research on disclosure risk and the mosaic effect.
We also send :hugs: to the HuggingFace :hugs: for all the open-sourced software they release. And to all open-sourced projects, thank you!
Documentation#
Contents