Map comparison is a complicated process, as there are many tools and approaches. In this project, we are comparing two methdologies for quantifying urban, both of which produce multiple binary rasters of urban areas:
Degree of Urbanization
| Urban area | Min Pop Density | Min Settlement Pop |
|---|---|---|
| Urban areas | 300 people/km2 | 5000 people |
| High density urban areas | 1500 people/km2 | 50000 people |
Dartboard
| Urban area | Definition |
|---|---|
| Urban areas | contiguous pixels for which the density is above the 95th percentile of the counterfactual |
| Cores | contiguous pixels within urban areas that are above the 95th percentile of the counterfactual within the urban core |
| Cities | urban areas that have a core |
Any attempt to compare these methods has to start with a question of what do we compare: the DoU method produces two layers, and the DB method produces three. After investigating the data it is clear that the DoU urban area is equivalent to the DB urban areas. However, the comparison of the DoU high density to the DB could be to either the Cores or the cities. In the figures below you can see the comparison to both, however, let’s look at the nature of the comparison:
The code to compare the data can be found here (LINK FORTHCOMING), for both comparisons, we use the table below to define agreement
| DB Core/City | DB Urban Area | DB Rural | |
|---|---|---|---|
| DoU High Density | High Density | Disagree Urban | Disagree Rural |
| DoU Urban Area | Disagree Urban | Urban | Disagree Rural |
| DoU Rural | Disagree Rural | Disagree Rural | Rural |
Kenya comparison
Using these categories the maps below were created to compare the DB classes. Based on these results we will focus on the comparison of the DB cores to DoU high density areas.
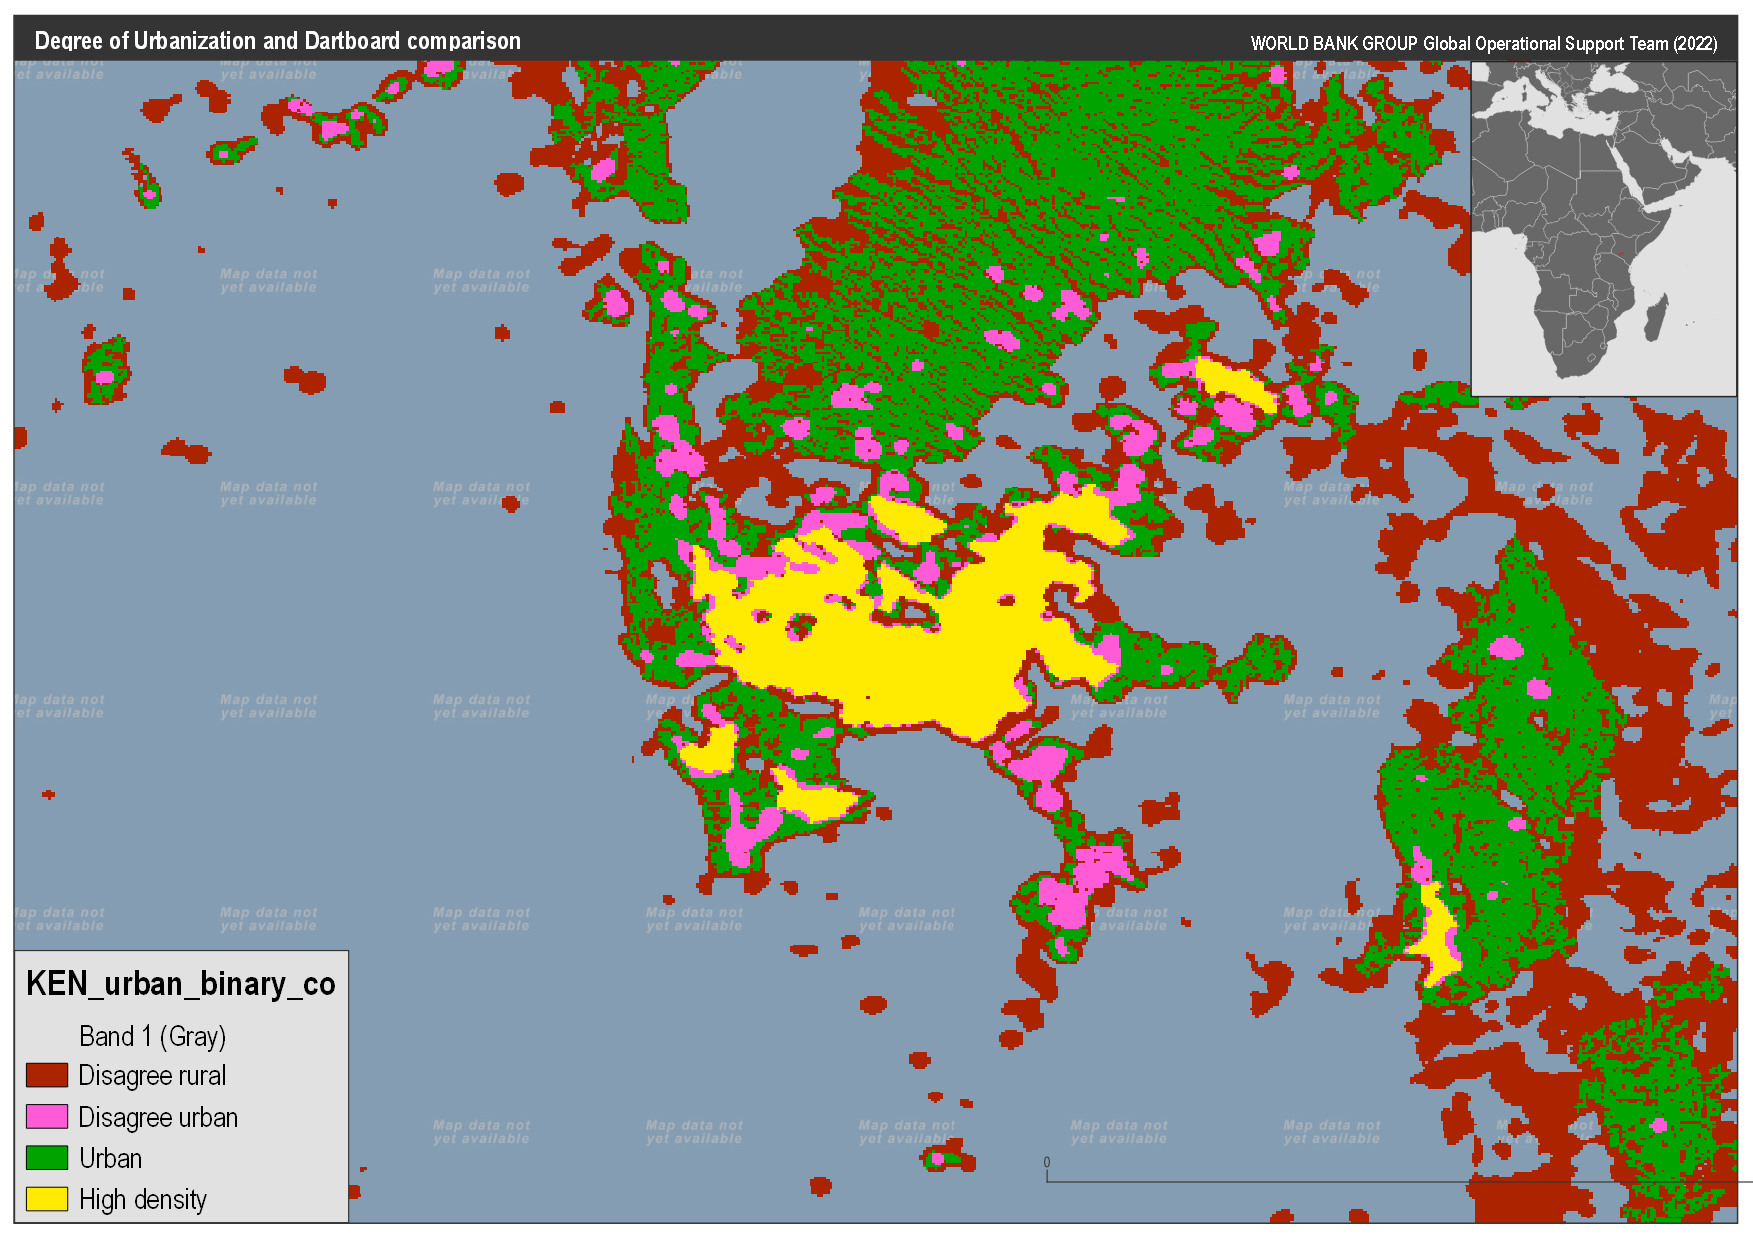
Nairobi zoom: comparing DB cores to DoU high density areas
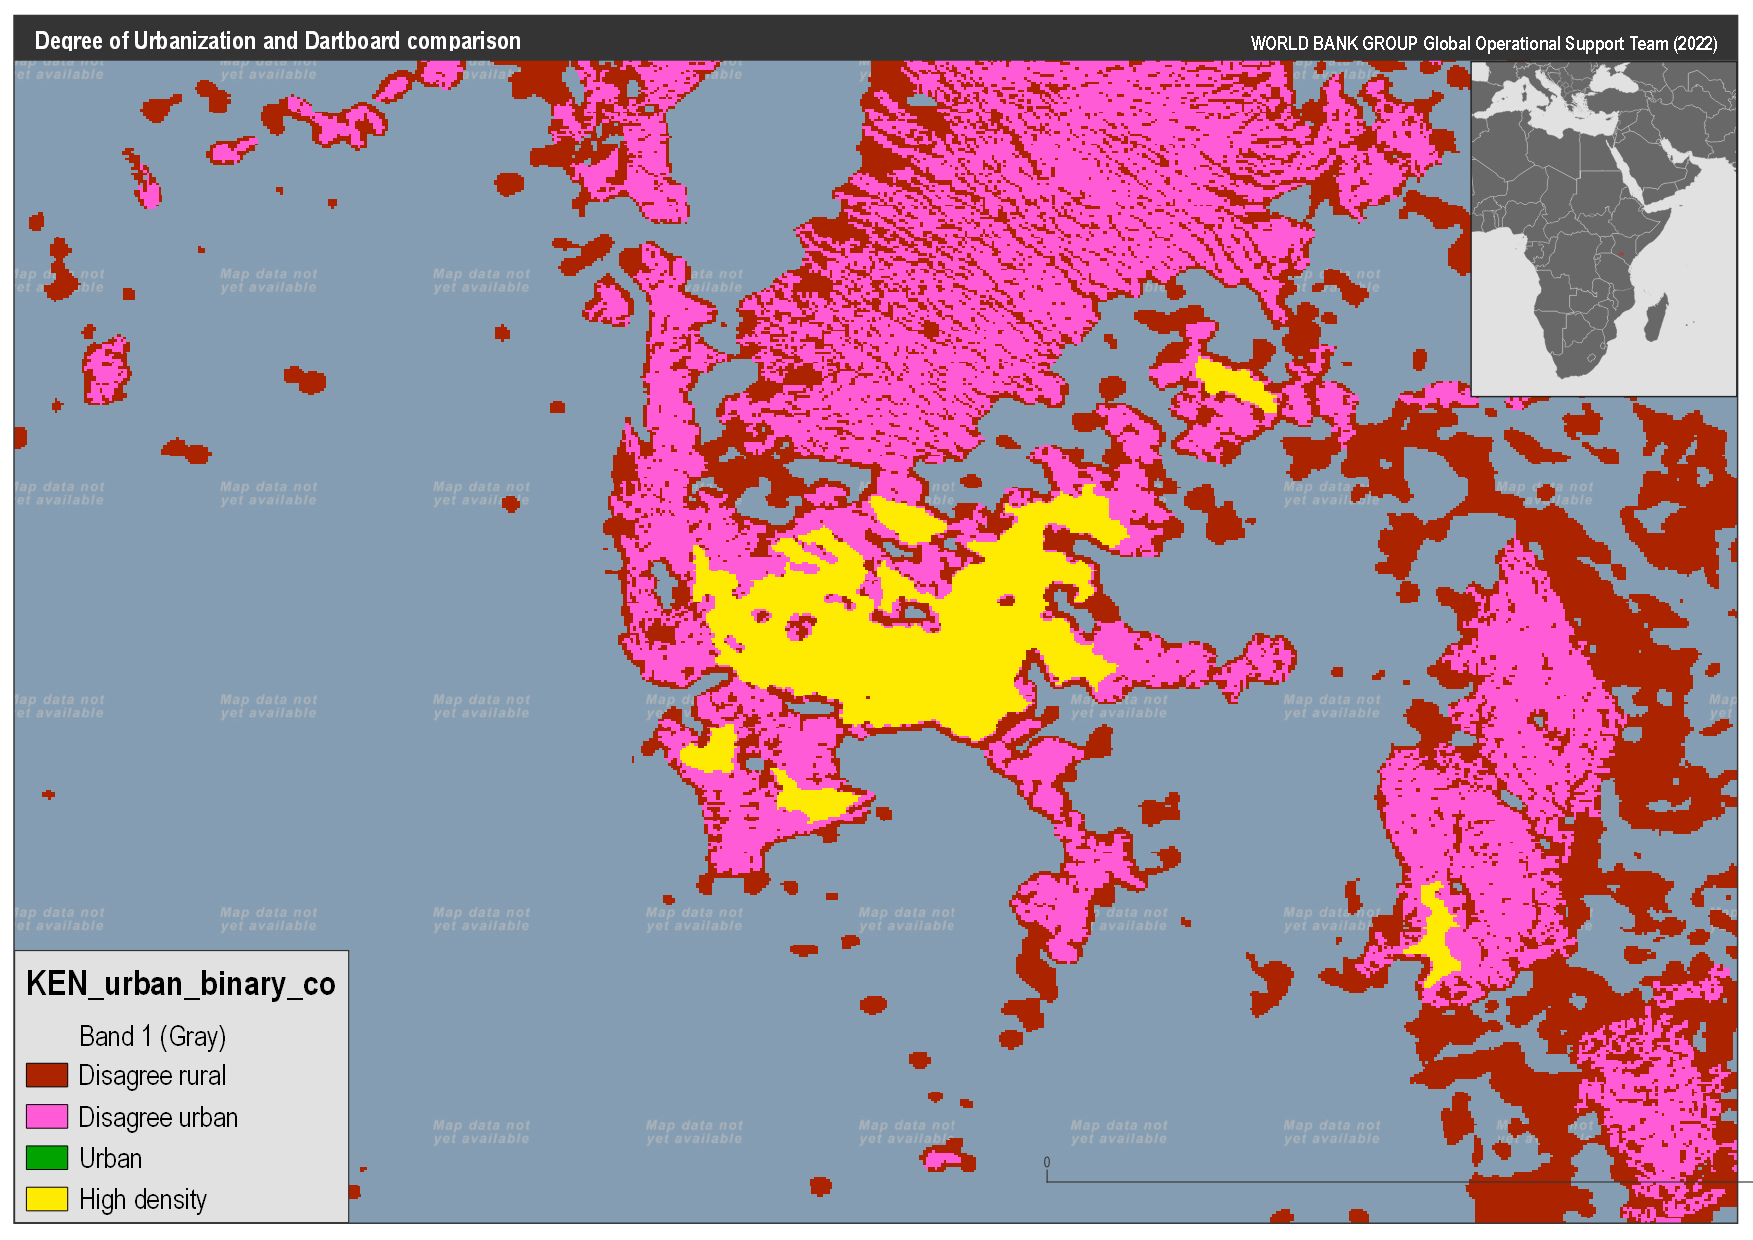
Nairboi zoom: comparing DB Cities to DoU high density areas
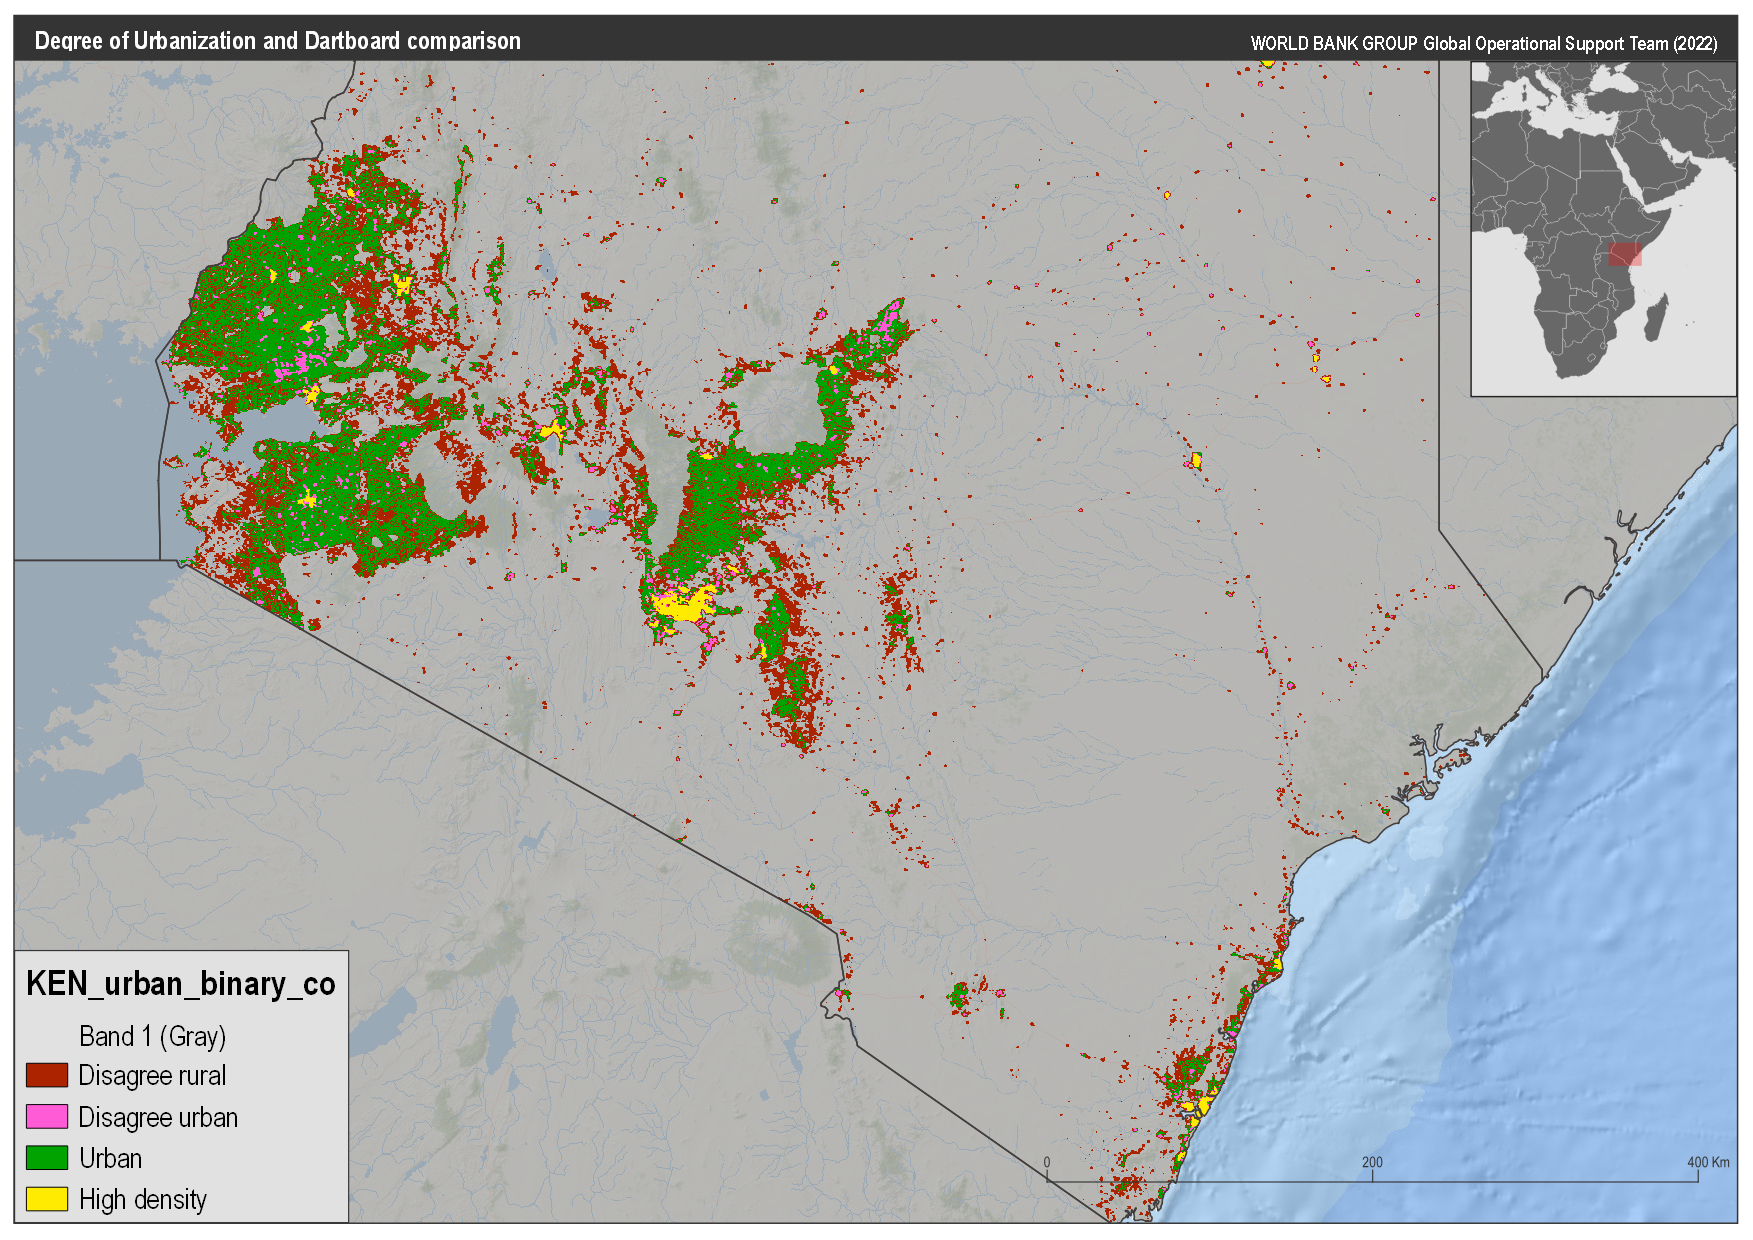
Comparing DB cores to DoU high density areas
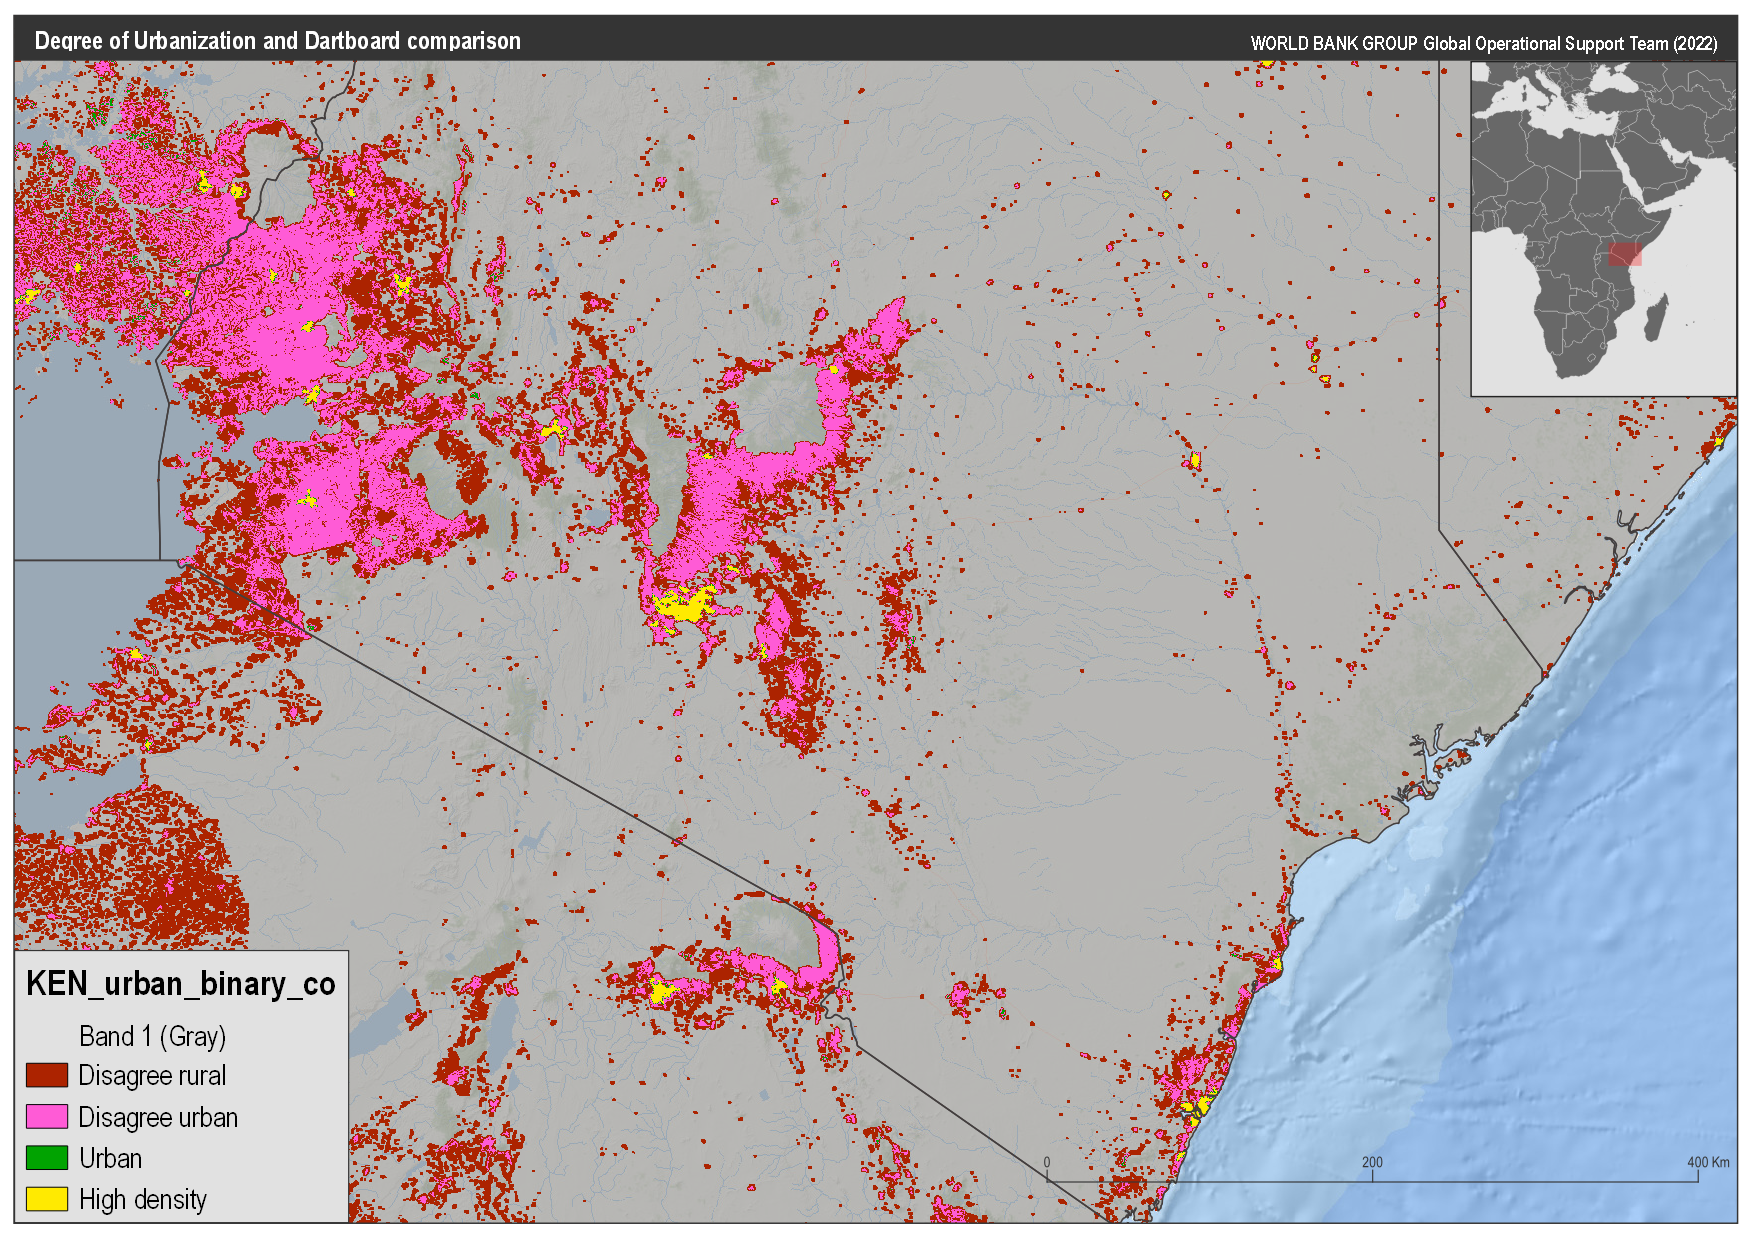
Comparing DB Cities to DoU high density areas